YouTube'dan Mağaza ile ilgili eğitici videoları izleyin
Bir alım-satım robotu veya gösterge nasıl satın alınır?
Uzman Danışmanınızı
sanal sunucuda çalıştırın
sanal sunucuda çalıştırın
Satın almadan önce göstergeyi/alım-satım robotunu test edin
Mağazada kazanç sağlamak ister misiniz?
Satış için bir ürün nasıl sunulur?
MetaTrader 5 için yeni Uzman Danışmanlar ve göstergeler - 141
Hello friends. I wrote this utility specifically for use in my profile with a large number of Expert Advisors and sets ("Joint_profiles_from_grid_sets" https://www.mql5.com/en/blogs/post/747929 ). Now, in order to limit losses on the account, there is no need to change the "Close_positions_at_percentage_of_loss" parameter on each chart. Just open one additional chart, attach this utility and set the desired percentage for closing all trades on the account. The utility has the following fu
FREE

Signal provider based on RSI Divergences
from a higher timeframe.
First 3 buffers export a signal.
Timeframe for which divergences are detected is optional, see
'RSI divergences timeframe' parameter.
The indicator uses different algorithms for divergences detection:
'Fast' algorithm is the simplest solution that works the fastest.
'Strict' algorithm filters out more noise but works slower than the previous one.
'Full' algorithm uses recursive functions and provides with lots of divergences
FREE

The currency strength momentum has a lot of similarities with currency strength meter presented in the previous page, but the difference are much more pronounced. You can try putting both in the same chart and see the difference in results. Currency strength momentum measures strength of a currency based on (you guess it) it's momentum relative to other currencies, while currency strength meter measures the strength of a currency based on pips it has moved in a certain direction.
FREE
30% OFF ONLY 10 COPIES HURRY UP! 8 LEFT COPIES Very precise patterns to detect High Accurate Order Blocks: It Draw zone after market Structure Breakout with a high Accuracy, institutional orders with the potential to change the price’s direction and keep moving towards it, have been placed. Features Auto Order Blocks Draw MTF Order Blocks Double Signal One Alert Signal Second Long Wick Rejection Signal Market Structure BOS LINE How to show MTF order Block Go on indicator setting at the en

LAZY TRADER MT5
Lazy Trader was designed to do all of the complex trading for you, so you can you relax on your couch, or sleep the night away. There is no reason to learn how to trade Forex when using Lazy Trader.
YOU DO NEED TO UNDERSTAND RISK AND MONEY MANAGEMENT HOWEVER...... Ok to Be Lazy and Smart, but PLEASE not Lazy and Stupid. READ THE RISK WARNING BELOW.
It's time for you to put your feet up and allow your trading bot do all the complicated work for you. After all, you deserve

Merhaba; Bu indikatör gerçek hacim seviyelerinin bazı matematiksel hesaplar ile giriş ve çıkış sinyallerinin oluşmasını sağlar.Kullanımı basit ve güvenlidir.Gerçek hacim seviyelerinin ortalamalar ile kesişmesi sonucu al ve say sinyalleri oluşturur. İndikatör parametre açıklamaları: A-PERIOD:Hesaplanması gereken bar sayısını ifade eder. B-GAMMA:0.618 olan bir sabit fibonacci trend ortalaması kullanılır.(En yüksek 0.786 en düşük 0.236 kullanmanız gerekmektedir.) C-VOLUME TYPE:Tick volume sabit ola

Drawdown Limit EA Prop Firm trading MT5
If you found this EA, it's probably because you want to get a funded account with a prop firm, but you see a rule that most of traders fear : Maximum Daily Drawdown. I've been through this problem myself as I'm a prop firm trader and I've made a bot to solve this rule, and you can get it to solve this problem too.
How does it work ?
When you first setup this EA, you need to input the initial deposit which corresponds to the size of your funded account.

Bu ürün kanal ölçeklendirme sayesinde kapanış barlarında sinyal üretir.Bu sinyalleri bir ok sayesinde görselleştirir.Ok rengi işlem yönünü ifade eder.Varsayılan ayarlar H1 periyot için geçerlidir.Her periyot ve ürün için backtest yapabilirsiniz.İndikatörün kod içeriği mümkün olduğunca fiyat hareketlerine uygun bir şekilde uygulanmıştır.Bu sebeple trend başlangıçlarını ve sonlarını iyi tespit eder. Parametre açıklamaları: PER: Hesaplanacak bar sayısını ifade eder. PRO: Kanal genişleme faktörünü h

GM Bounty Hunter MT5 is a fully automated/semi-automatic, The robot trades according to the overbought and oversold levels of the market. The EA's unique trading strategy has a high probability of winning. GM Bounty Hunter MT5 is optimized for use with low spread currency pairs. Info:
Working symbol XAUUSD, EURUSD, GBPUSD, USDJPY,.... Working Timeframe: M1, .....(The larger the timeframe, the more stable the signal) Min deposit $125 with Stop Loss settings (or equivalent in cents ) The minimum

Djin is an scalper designed for USDCHF H1/M15 (hedge account) . It doesn't use martingale. Always setup stoploss and takeprofit.
RECOMMENDATIONS :
- Recommended pair: USDCHF (hedge account)
- Recommended setting: USDCHF H1/M15 (hedge account)
- Recommended Lot: auto
- Minimum capital: 1000 USD (in this case a DD of 15/20% is possible, as the account is small)
- Minimum leverage: 1:100 or upper PARAMETERS: stoploss - stop loss in points takeprofit - take profit in points Trade volume
NEW: A Fully Automated strategy using price action and candle patterns to trade Gold (XAUUSD).
This EA can be used on any currency but recommended for XAUUSD, EURUSD and BTCUSD Safe stop loss option for FTMO and other funded accounts. REAL BACKTEST DATA - no manipulation or backtest conditioning like other EAs! 100% Modelling Quality Backtest! USE: Default settings on XAUUSD & XAUAUD on the M15 timeframe. Use ECN account for best results.
MAIN SETTINGS Setting Value Description Ma
Automatic Expert Advisor. Night scalp system, with trend detection and pullback entry. Dynamic exit signal, for SL or TP. Every trade has fix SL. No usage of risky strategies like martingale, hedge, grid etc.
About EA Scalper strategy Technical strategy Can use with small deposits Pairs with best rezults: AUDNZD, AUDCAD, AUDCHF, EURAUD, GBPAUD, USDCHF, CADCHF, EURNZD, EURGBP, GBPCAD, GBPCHF, EURCHF Time Frame: M15 Recommendations Broker account with ECN and low spread Test it first to find out

В основе индикатора EasyBands лежит тот же принцип, что и при построении Bollinger Band. Однако, данная модификация индикатора использует вместо стандартного отклонения средний торговый диапазон (Average True Range). Соответственно, с данныи индикатором абсолютно аналогично можно использовать все стратегии, которые применяются с Bollinger Band. В данной версии индикатора используется двенадцать уровней и средняя линия (белый цвет). Индикация тренда выполнена в виде окраски свечей в зависимости
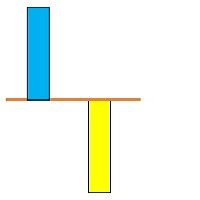
A technical Indicator Providing Price Convergence Signals along with value for experienced and professional traders. Easy to comprehend, Easy to understand.
This is a helping tool provides best signals. This indicator is designed based on the fundamentals of trade. A very good indicator you can customized its color. A best tool to find trade direction.
An adaptive indicator. It constantly adapts to the trade.

A value indicator for experienced and professional traders. It is helping tool to indicate the direction value gain. A best helping tool to trade value. This indicator is equipped with a colored line and a digital tool to indicate value numerically .
This indicator also helps to indicate value during trends. A study based on this indicator shows value of trade significantly changes during trends best tool to cash the trends.

Best helping tool for Professional and Experienced traders. A best Tool To find the trend. Instruction Manual: First Select your desired Symbol. Then attach this tool and wait till it identify the trend for you. Then it will be more feasible to trade.
Once again best tool to trade. Demo version is available you can fully test its functionality. More importantly there are always trend breaks Once Trend break is observed un-attach this tool and then re-attach to get the fresh trend. Precautions:
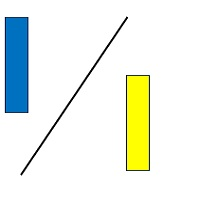
A basic tool for traders to trade percentile of the value. It indicates both values in the for of digits appeared on the left corner of the screen.
Instructions Manual : First choose your desired symbol and then select this tool. Please be remined that this tool is just a helping tool. its upon trader what he chooses. The function of this tool is just to provide a help in trading.

OPTIMIZE For settings. SL and TP should Start with 50000 Important to get the optimization before backrest and use. I optimized on the last month option in the strategy tester. BTC Miner was build for trading BTCUSD on 1 hour time frames. About the EA and strategy: It uses ADX and Envelopes to enter trades and uses Momentum and Moving Average crossovers for exits. There is a fixed lot size and all trades have a SL and TP. The EA does not use martingale or hedging as its strategy, it is based
Две простых симметричных пробойных трендовых системы для лонгов и шортов, которые работают абсолютно независимо друг от друга. В основе алгоритма открытия позиций пробой ценой по тренду мувинга, сдвинутого по вертикали на фиксированное в настройках эксперта количество пунктов. Входные параметры эксперта разбиты на две большие группы: Для лонгов с префиксом "L";
Для шортов с префиксом "S". Поскольку в данном эксперте две торговые системы, то оптимизировать и тестировать их сперва следует отдельн

EA介绍 :Stable Grid是一款中长期全自动化的交易顾问,放弃大起大落 只追求大概率稳定的细水长流。 资金门槛 :使用该EA的资金门槛稍微比较高,具体内容看配置介绍。 类型 :中长线EA策略
优点 :较为稳定、全自动
缺点 : 1.面对超大单边行情略显恐惧,若不是超大单边那也不屑一顾。 2.获利周期较长,对于短线交易者的心理造成焦虑感!
止损:每张订单都不设置止损,然而止损按照策略来执行。 止盈:按照固定点数来执行。
风险管理 :任何策略都不是最重要的,风险管理才是最重要的!本EA使用了复利模型,严格控制了仓位比例。
配置介绍 :必须严格按照推荐的配置来执行。 周期推荐:30分钟 货币推荐:美瑞
杠杆推荐:1:100-200 最低余额:$10000
要求 : 1.EA需要良好的经纪条件,平台最好是低点差低滑点,网络最好保持稳定。 注意 : 2.当使用EA 专家建立头寸之后,使用的连续性也是需要严格遵守,除了非交易日之外都应当挂上EA。举例:假设一年有365天,然而外汇市场一年的交易日仅为240天,在这240天内都应该连续使用EA!
EA测试 :(该EA属于中长

Correction Breakthrough, fiyat oluşumlarının analizine ve fiyat hareketlerinin ataletine dayanan bir düzeltme veya ticaret koridorundan olası koparma noktalarını tespit etmek için güçlü bir araçtır.
_________________________________
Gösterge sinyalleri nasıl kullanılır:
Gösterge, mevcut fiyat çubuğunda bir sinyal oluşturur. Oluşan sinyali, sinyal çubuğunun sinyal okunun üstünde/altında kapatıldıktan sonra kullanmanız önerilir. Gösterge sinyallerini yeniden çizmiyor.
_______________________
FREE

Momentum Reversal, fiyat hareketlerinin yoğunluğunun ve çubuk oluşumlarının analizine dayanan olası ters noktaları tespit etmek ve düzeltmeye başlamak için güçlü bir araçtır.
_________________________________
Gösterge sinyalleri nasıl kullanılır:
Gösterge, yeni bir fiyat çubuğunun ortaya çıkmasından sonra bir sinyal oluşturur. Oluşturulan sinyalin, belirtilen yönde kritik bir noktaya çarptıktan sonra kullanılması önerilir. Gösterge sinyallerini yeniden çizmiyor.
____________________________
FREE

Acceleration Points, fiyat dalgalanmalarının hızlanmasını hesaplama fikrine dayanan güçlü bir fiyat hareketinin kritik noktalarını tespit etme aracıdır.
_________________________________
Gösterge sinyalleri nasıl kullanılır:
Gösterge, yeni bir fiyat çubuğunun ortaya çıkmasından sonra bir sinyal oluşturur. Oluşturulan sinyalin, belirtilen yönde kritik bir noktaya çarptıktan sonra kullanılması önerilir. Gösterge sinyallerini yeniden çizmiyor.
_________________________________
Gösterge seçen
FREE

Market Palette, fiyat dalgalanmalarının ataletine ve hızlanmasına dayanan güçlü bir ticaret çözümleri filtreleme aracıdır.
_________________________________
Gösterge sinyalleri nasıl kullanılır:
Gösterge üç farklı renkte histogram sinyalleri oluşturur. Standart renk düzeninde, mavi renkli sütunlar göründüğünde, yalnızca uzun pozisyonlar tutmanız, kırmızı sütunlar göründüğünde - sadece kısa pozisyonlar ve gri sütunlar göründüğünde - ticaret eylemlerinden kaçınmanız önerilir. Daha yüksek sütun
FREE

Points of Inertia, fiyat hareketlerinin ataletini hesaplama fikrine dayanan güçlü bir fiyat hareketinin kritik noktalarını tespit etme aracıdır.
_________________________________
Gösterge sinyalleri nasıl kullanılır:
Gösterge, yeni bir fiyat çubuğunun ortaya çıkmasından sonra bir sinyal oluşturur. Oluşturulan sinyalin, belirtilen yönde kritik bir noktaya çarptıktan sonra kullanılması önerilir. Gösterge sinyallerini yeniden çizmiyor.
_________________________________
Gösterge seçenekleri,
FREE
EUR / USD döviz çiftinde işlem yapmak için basit bir Uzman Danışman ve sadece
BUX EA motoru tarafından desteklenmektedir
SEÇMEK.VAR: S1
Sinyal üretimi için en uygun gösterge seti Bir sinyalde / sinyalsiz açılış / kapanış işlemleri, Bekleyen emirler Martingale modu (Dinamik martingale dahil) Sanal sondaki durdurma (broker tarafından görülemez)
Ticaret stratejinizi test etmek ve optimize etmek için strateji test cihazını kullanın
Gerekli tüm bilgiler sss'de yer almaktadır. https://docs.googl
EUR / USD döviz çiftinde işlem yapmak için basit bir Uzman Danışman ve sadece
BUX solo'nun Lite versiyonu https://www.mql5.com/ru/market/product/84862
BUX EA motoru tarafından desteklenmektedir
SEÇMEK.VAR: S1 (OPT.VER: S1)
Sinyal üretimi için en uygun gösterge seti Bir sinyalde / sinyalsiz açılış / kapanış işlemleri, Bekleyen emirler Martingale modu Sanal sondaki durdurma (broker tarafından görülemez)
Ticaret stratejinizi test etmek ve optimize etmek için strateji test cihazını kullanın
G

Mevcut ana piyasa seansını ve sonraki seansları başlatmak için kalan süreyi görüntüler.
Piyasalar
New York Londra Frankfurt Tokio Sidney Özel ad, açılış ve kapanış zamanı ile 1 oturum daha
Saat süresi
GMT / UTC Yerel (bilgisayardan) Aracı (sunucu zamanı) Ayarlarda varsayılan saat GMT'dir. Yerel veya Aracı saatine değiştirdikten sonra, seçilen saat türüne göre her oturumun açılış ve kapanış saatini manuel olarak ayarlamak gerekir. Her bir piyasanın ve kapanış saati ayarlanabilir
Grafik ayarlar
FREE

M & W Pattern Pro is an advanced scanner for M and W patters , it uses extra filters to ensure scanned patterns are profitable.
The indicator can be used with all symbols and time frames.
The indicator is a non repaint indicator with accurate statistics calculations.
To use , simply scan the most profitable pair using the statistics dashboard accuracy , then enter trades on signal arrow and exit at the TP and SL levels.
STATISTICS : Accuracy 1 : This is the percentage of the times price hits TP
Demo version of the Virtual SL TP Trailing product for testing all functions https://www.mql5.com/ru/market/product/75210
ВНИМАНИЕ: ТОЛЬКО ДЛЯ ДЕМО-СЧЕТОВ !!!
Make Trailing Stop, Take Profit, Breakeven, Stop Loss levels invisible to the broker!
HIDDEN MODE (STEALTH MODE) Virtual Trailing Stop (Virtual Trailing Stop) Virtual Take Profit (Virtual Take Profit) Virtual Breakeven (Virtual Breakeven) Virtual Stop Loss (Virtual Stop Loss) Виртуальный 2-уровневый Трейлинг-стоп Virtual Tr
FREE

MartexMT5 is a moderately aggressive EA working on a martingale strategy with hedge. The EA independently monitors the risk and, if the risk is high, takes measures to exit the market with a minimum profit. In the hedging mode, the EA independently leaves the "lock" with a profit. A complete guide to the MartexMT5 EA can be found in the "Comments" section. Benefits automatic magic number, individual for each currency pair; automatic breakeven and automatic trailing stop; at high risk, reducing t
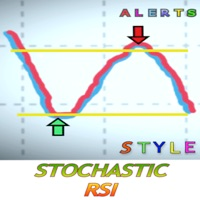
Stokastik RSI nedir?
Stokastik RSI (StochRSI), teknik analizde kullanılan, sıfır ile bir (veya bazı grafik platformlarında sıfır ile 100) arasında değişen ve Stokastik osilatör formülünün standart fiyat verileri yerine bir dizi göreli güç endeksi (RSI) değerine uygulanmasıyla oluşturulan bir göstergedir. Bu sürüm, gerçekten iyi fırsatları kaçırmamak için uyarılar içerir. Bir sinyal satın alma emri veya sinyal satış emri almak istediğinizde parametreyi ayarlarsınız. Herhangi bir sinyal almak iç

Martingal. "Constructor_Simple_MT5" Expert Advisor, aynı anda ve birbirinden bağımsız olarak çalışan 5 ayrı Expert Advisor'dan oluşur: Bar ticareti. iEnvelopes göstergeleri ile ticaret. iMA göstergesi ile ticaret. iIchimoku göstergesi ile ticaret. iSAR göstergesi ile ticaret. "Constructor_Simple_MT5" Uzman Danışmanı, "Constructor_MT5" Uzman Danışmanının basitleştirilmiş bir sürümüdür. Girdi parametrelerinin sayısı minimuma indirilmiştir, bu da hem Expert Advisor'ın kullanımını hem de optimiza

https://c.mql5.com/31/761/best-trend-indicator-logo-200x200-8493.png The indicator uses a solid line of red and green to reflect the myriad changes in market prices. The green line indicates a period of rising market prices and the red line indicates a period of falling market prices. Solid line color change indicates that the market has changed and the market is likely to reverse! It is recommended that you use this indicator on your daily K-chart. This indicator is not suitable for you to do
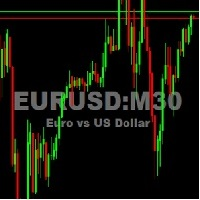
This utility tool shows the ticker symbol, timeframe, and description information as a watermark on the chart. Text resizes automatically according to chart size. It is useful to identify the correct chart when multiple charts are shown on the screen. Want more control over text apperance? Check out our Chart Watermark MT5 Premium utility. See the demonstration video below!
Inputs: Font Size: Initial font size for the ticker symbol and timeframe text (Default; 50). Description text font size
FREE

Multicurrency Expert Advisor works on the basis of determining several candlestick patterns, which should simultaneously form on several trading instruments.
Please test the Expert Advisor with 100% quality of quotes!
Built-in hedging system allows you to increase the stability of the work, reduces the drawdown and greatly increases the probability of reaching the take profit, specified in the settings of the expert. Version for MT4: https://www.mql5.com/en/market/product/84876 Check that all

本指标 基于 Zigzag 基础上... 增加了: 1.增加了箭头指示,使图表更鲜明 2.增加了价格显示,使大家更清楚的看清价格. 3.增加了报警等设置,可以支持邮件发送 原指标特性: 1.基本的波段指标构型. 2.最近的2个ZIGZAG点不具有稳定性,随着行情而改变,(就是网友所说的未来函数) 3.原指标适合分析历史拐点,波段特性,对于价格波动有一定的指导性.
Zigzag的使用方法一 丈量一段行情的起点和终点 (1)用ZigZag标注的折点作为起点和终点之后,行情的走势方向就被确立了(空头趋势); (2)根据道氏理论的逻辑,行情会按照波峰浪谷的锯齿形运行,行情确立之后会走回撤行情,回撤的过程中ZigZag会再次形成折点,就是回撤点; (3)在回撤点选择机会进场,等待行情再次启动,止损可以放到回撤的高点。 一套交易系统基本的框架就建立起来了。 Zigzag的使用方法二 作为画趋势线的连接点 趋势线是很常见的技术指标,在技术分析中被广泛地使用。 但一直以来趋势线在实战中都存在一个BUG,那就是难以保证划线的一致性。 在图表上有很多的高低点,到底该连接哪一个呢?不同的书上画趋势线的方法
FREE

Gann 9+ Indicator Introduction The "Gann Matrix Chart" is the most simple and clear technical analysis in Gann theory, which is the calculation tool that Gann has always been committed to using. It is the essence of Gann's whole life. The Gann 9+ indicator uses the matrix chart to find the future high or low points of stocks or futures. Indicator Input: The base and step size can be set as 1 by default; When the multiple is -1, the multiple will be automatically obtained, or it can be filled in
This EA is suitable for trading on the pair and else several. The EA itself uses universal strategies, but so far they are optimized for some currency pairs. Many settings can be adjusted. There are two panels on the chart, for visualization and settings. He displays his decision on the graph in the form of arrows. There are only two types of arrows. It does not use martingale. It works fine in the tester by default in the settings. It is already configured by default. You can also specify the

Of all the tasks that a trader faces when entering a market, the main task is to determine the direction of the trend. The Artificial Power indicator will help you with this task. Whatever goal the trader sets for himself, the tool to achieve it will be mainly trend indicators.
The Artificial Power indicator without delay and redrawing is used by traders in trend strategies in trading on financial markets (Forex, CFD, binary options). This indicator is designed to detect trends in price moveme

Flag Pattern pro is a Price Action (PA) analytical tool that scans the continuation patterns known as "Flag and Pennant Patterns" .
Flag and Pennant patterns are continuation patterns characterized by a move in a previous trend direction after a shallow retracement usually below 50% of the original move . Deep retracements can however be sometimes found at the 61.8 % levels. The original move is know as the flag pole and the retracement is called the flag.
Indicator Fundam

This is a buyer and seller aggression indicator that analyzes the shape of each candle and project this data in a histogram form. There are 4 histograms in one. On the front we have two: Upper - Buyer force. Lower - Seller force. At the background we also have two histogram, both with same color. They measure the combined strenght of buyers and sellers. This histograms can be turned off in Input Parameters. It is also possible to have the real or tick volume to help on this force measurement. IN
FREE

Presentation
Another indicator that makes scalping on tick charts easier, it displays an Heiken Ashi graph in Ticks.
It allows to detect entry points and trend reversals. Recommended number of ticks in a candle : 5, 13 or 21.
Parameters Ticks in candle: Number of ticks in a candle (default 5), Displays Trend arrows : displays a trend arrow based on EMA8 and EMA20 crossing, Displays MM50, Displays MM100, Max Candle (CPU): number of candles max to manage, low value will save ressources of your
FREE

Have you ever wondered which currency is the strongest at any particular time? Or which currency pair is trending the most. Well, the currency strength meter helps with just that. It compares USD , EUR , AUD , CHF , GBP , CAD and NZD depending on the timeline you have chosen in settings, and ranks them on the number of pips each has moved compared to the rest. N/B: All currency charts of the above pairs must have loaded. You can do this by highlighting all major and minor currencies in
FREE

Relative Volume or RVOL is an indicator that averages the volume of X amount of days, making it easy to compare sessions volumes.
The histogram only has 3 colors:
Green - Above average volume
Yellow - Average volume
Red - Below average volume
The default setting is 20 days, which corresponds more or less to a month of trading.
In this version is possible to choose between tick and real volumes (if you are using a broker which offers future contracts)
With the data obtained from this in
FREE
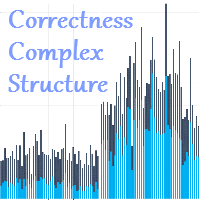
The Correctness Complex Structure indicator displays the complex structure of the bar, taking into account tick volumes in digital terms. How to interpret the information provided by the indicator. It's very simple, it's enough to analyze the chart. We will explain the work using an example, take the EURUSD instrument on the D1 timeframe, install this indicator and analyze the information provided by the indicator. The indicator works in the bottom of the chart and gives the result in the form
CalcFlat Creative is a flat indicator.
This is a more advanced version of the CalcFlat indicator. Three lines have been added for this indicator, which significantly improve the performance of the predecessor indicator. In addition to the two existing levels that the user reacted to and which were static, now the indicator has three dynamic lines on top of the main chart and interpreted as: signal line base, signal minimum, signal maximum.
These lines are formed due to the additional indicato
STARGOGS PRICE ACTION EA ABOUT: This Robot is based on Price Action mostly Trendlines and Support & Restistance. The Robot Also uses 2 Strategies which you can choose from by choosing which one to use (True/False) Strategy 1: One Entry at a time with Fixed TP and SL. Strategy 2: Grid and Matingale. You can also use this EA as a Indicator by Turning Trading off also by using (True/False). You can aslo use Lot multiply on loss if you want or use fixed lotsize. MINIMUM BALANCE:
The Minimum Balanc

Mega Recuroid is a professional expert system developed for market analysis based on the Recuroid indicator. The Expert Advisor works with one order (not a series), each order is accompanied by a stop loss and a take profit. Thus, the expert system uses safe orders for its work. The indicator entry itself can also be considered reliable, since a reliable Recuroid indicator is used. The principle of entry and holding/maintaining a position on the market is clear, there is a signal, close the opp

NeodymiumX is an expert advisor specialized to trade indices NASDAQ/ NDX100/ US100/ NAS100. It uses no dangerous strategy (matingale, grid, etc) and gives a safe and steady growth of an account. Unlike some commons NAS100 EA that only use buy order/position, NeodymiumX use buy or sell position according to the market trend. So it can make profit on both directions and still profitable even when US100 price drop (like at the beginning of 2022 until around June 2022). NeodymiumX live performance

Hi all, Morning Shift is a plug and go system programmed to trade on the GBPUSD pair only. It executes trades at a specific time each day using a fixed risk reward ratio. The system trades only during the London session because of the high price movement in relatively a single direction in the named pair. Please read the instructions below and the video attached in the description for instructions. Thank you. Requirements Adjust the local time zone of your device to UTC+3 Must be used on GBPU
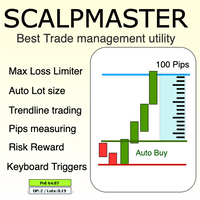
The Scalp Master tool not only provides proper trade management but also helps a trader to build a proper psychology and discipline to gain consistent results in his trading. It offers Max loss Limiter ( Risk per position ) and RPT limiter (Risk per trade), Auto calculates Lot size, CLOSE multiple trades with single click. Buy, Sell, Close with default Trend line and Horizontal line , Pips measuring tool, risk reward measuring tool and many other features. This tool offers to place quick

This indicator is very useful in observing the direction of the market. It allows users to enter multiple MA lines with specific display method. In addition, it is also possible to change the candle color same to color of the background of chart, so that we only focus on the MA lines. When a signal appears, represented by a red or green dot, we can consider opening a sell (red dot) or buy (green dot) order. Note: it need to set stoploss at the highest value of MA lines (with sell order) or lowe
FREE

This indicator combines RSI(14) and ADX(14) to find out the signal that price moves strongly. When it appears signal (represent by the yellow dot), and price is going down, let consider to open a SELL order. Otherwise, let consider to open a BUY order. In this case, the strength of moving is strong (normally after sideway period), so we can set TP by 3 times of SL .
FREE

Description :
A utility to create and save screenshots automatically and send to a chat/group/channel on telegram.
The saved/sent image file will include all objects that exist on the chart and also all indicators are displayed on the chart.
Features: Save screenshot of chart including all objects, indicators, ... Send screenshots to a telegram chat/group/channel
Wide range options to select when create screenshots
Logo and text adding feature
Inputs and How to setup the EA :
Various option
VixAlgo is fully automated Expert Advisor for trading Volatility 75 Index offered by Deriv formerly known as Binary Dotcom. The EA will spot entries when the conditions are met. It is based on Candle Breakout on Support or Resistance level and also is incorporated with Envelopes price Break Strategy. The EA will automatically open trades and close on Take Profit. Lot size or can can be also changed depending on account balance you have. This is not just a bot which miss trade opportunity, it ma
Hiçbir abonenizin alım satım terminalinizden alım satım etkinliklerinizi kaçırmaması için bildirim göndermek için otomatik bir sistem. Hesabınızdaki herhangi bir alım satım işlemi hakkında Telegram habercisine bildirim gönderen bir yardımcı program. Yardımcı programı Telegram'da bir kanala bağlamak için adım adım talimatlar -> HERE / MT4 -> HERE Avantajlar: Kolay kurulum ve ayrıntılı talimatlar, Ayarlanabilir ekran görüntüleri gönderme imkanı, Emoji kullanarak özelleştirilebilir bildirim

MT4 ve MT5 için Entry Points Pro EA ticaret robotu Satın aldıktan hemen sonra, talimatları ve çok güçlü bir bonusu almak için web sitesindeki özel mesaj yoluyla benimle iletişime geçin! Dikkat! İndirimli fiyattan sadece 2 kopya kaldı! Bir sonraki fiyat 749 dolar olacak. Entry Points Pro EA, MQL5'te 450'den fazla olumlu geri bildirim alan ve bir yıldan fazla bir süredir binlerce diğer gösterge arasında 1 numaralı pozisyonda bulunan efsanevi Entry Points Pro göstergesine dayanmaktadır.
İşte tic

Trend çizgileri, forex ticaretinde en önemli teknik analiz aracıdır. Ne yazık ki, çoğu tüccar onları doğru şekilde çizmez. Otomatik Trend Çizgileri göstergesi, piyasaların trend hareketini görselleştirmenize yardımcı olan ciddi tüccarlar için profesyonel bir araçtır.
İki tür Trend Çizgisi, Boğa Trend Çizgisi ve Ayı Trend Çizgisi vardır.
Yükseliş trendinde, Forex trend çizgisi, fiyat hareketinin en düşük salınım noktalarından geçer.
En az iki "en düşük düşük"ü birleştirmek, bir trend çizgisi o

50% off. Original price: $375 Reward Multiplier is a semi-automatic trade manager based on pyramid trading that opens additional orders with the running profit of your trades to maximize return exponentially without increasing the risk. Unlike other similar EAs, this tool shows potential profit/loss and reward to risk ratio before even entering the first trade! Download Demo here (starting lot is fixed at 0.01) Guide + tips here MT4 version here You only open the first order. When your trade
Sinyal veren bir göstergeniz var ve bunu Expert'e dönüştürmek mi istiyorsunuz?
Bu uzmanla, göstergenizi yeniden programlamak veya uyarlamak zorunda kalmadan dönüştürebilirsiniz, doğru şekilde yapılandırmak için adımları izlemeniz yeterlidir:
1) Gösterge, göstergeler klasöründe olmalıdır.
2) Gösterge tarafından sağlanan AL ve SAT tamponlarını dikkatlice seçmelisiniz.
3) Tüm işlemleri mi yoksa sadece AL veya SATIŞ türündeki işlemleri mi almak istediğinizi seçin.
4) İşleminize bağlı olarak,

SU YIRTICI ALTIN Ticaret Kuralları: Grafik: H6 Minimum Bakiye: 1000 Parti: 0.01 Bu EA Hakkında Waterstrider GOLD, GOLD/ XAUUSD piyasası için tasarlanmıştır. Bu, 4 pozisyonlu bir Günlük Ticaret stratejisidir. martingale yok, hepsi aynı parti. Giriş konumu, h6 Tablosu ile tetiklenen D1 analizine dayalıdır. her mum için sadece 1 pozisyon açılabilir. Piyasa pozisyona karşıysa, son pozisyonda (4 pozisyon), toplam pozisyondan 0.1x büyüklüğünde bir hedge pozisyonu hesaplar, bu, tüm pozisyonun kapanması
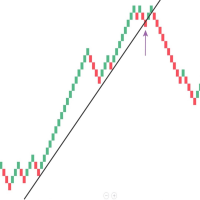
Mean Renko Bars are used for alternate price charting. Unlike the usual time framed chart – where every candle represents a fixed time interval – the goal of Renko chart is to display price movement in increments, called bricks. Best with the momentum strategies. Can make some Algo with this candel ---- ---- ---- ---- ---- ---- ---- ---- ---- ---- Support: primecapitalvn@ gmail. com
FREE

Introduction to Chart Pattern MT Chart Pattern MT is a chart pattern scanner to detect the triangle pattern, falling wedge pattern, rising wedge pattern, channel pattern and so on. Chart Pattern MT uses highly sophisticated chart pattern detection algorithm. However, we have designed it in the easy to use with intuitive user interface. Chart Pattern MT will show all the patterns in your chart in the most efficient format for your trading. You do not have to do tedious manual pattern detection an
Impulse Creative is a more advanced indicator of impulses for making decisions (compared to the Impulse Change indicator). The main task of this indicator is to warn the trader about the moment of price changes and also to give a command to enter according to the current trend. To determine the trend, use any other tool, this development forms only an entry point but not the entry direction.
First, look at the screenshots and notice that we see clearly expressed figures that the indicator form

Shift Trend is an indicator of the formation of entry signals, entry points. The indicator must be selected to work for a sufficiently short period of time. But who works in short ranges, then this indicator is well suited.
Options: Length1 - The first parameter. Length2 - Second parameter; PointActivity - Parameter controlling peak levels. PointMinDist - The parameter that sets the minimum distance. AvgLengthBar - Bar averaging.
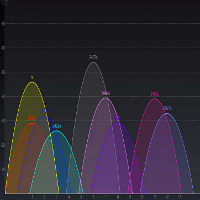
Change Analyzer - The indicator can be called an indicator of market balance. Since the indicator is on the zero line, then the market is balanced in a certain timeframe and a certain instrument.
Based on two virtual windows and their mutual placement, this graph is built. As a result of its work, the price chart normalizes relative to the zero line, which helps to draw conclusions about the price behavior. The indicator is somewhat reminiscent of the overbought and oversold system, but the al

Trading Direction is an indicator that will never go against a long trend, stable, accurate and without the slightest redrawing. The indicator goes through the whole story! You can find settings for any tool for which there is a free TDO utility .
Trade rules. When a signal appears (always at the bar opening price), we immediately close the opposite position, if it exists, despite the fact of a drawdown or profit. And we open a new position following the arrow in the right direction. And these

The Recuroid indicator shows very good entry points. Just look at the screenshots, then download the free version and look in the strategy tester and see for yourself.
The system is based on two key algorithms. The first algorithm (managed) creates a system of balanced transition from the buy zone to the sell zone and vice versa, draws arrows and lines, and forms entries. The second algorithm (managing) corrects the initial data for the first algorithm (managed) by measuring virtual windows, t
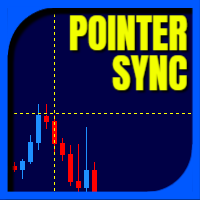
Pointer Sync is a pointer synchronizer between open charts. It makes the MT5 cross (activated by the middle mouse button) to be replicated on all open charts. In addition, it is possible to create horizontal lines (letter H) and vertical lines (letter V), very useful for studying. The appearance of the lines is customizable. Note: Synchronization is through the X and Y scale in pixels , not price and/or date. It is a simple and free utility. Enjoy!
This is a free indicator, but it took hours to
FREE
MetaTrader mağazası - yatırımcılar için alım-satım robotları ve teknik göstergeler doğrudan işlem terminalinde mevcuttur.
MQL5.community ödeme sistemi, MetaTrader hizmetlerindeki işlemler için MQL5.com sitesinin tüm kayıtlı kullanıcıları tarafından kullanılabilir. WebMoney, PayPal veya banka kartı kullanarak para yatırabilir ve çekebilirsiniz.
Alım-satım fırsatlarını kaçırıyorsunuz:
- Ücretsiz alım-satım uygulamaları
- İşlem kopyalama için 8.000'den fazla sinyal
- Finansal piyasaları keşfetmek için ekonomik haberler
Kayıt
Giriş yap
Gizlilik ve Veri Koruma Politikasını ve MQL5.com Kullanım Şartlarını kabul edersiniz
Hesabınız yoksa, lütfen kaydolun
MQL5.com web sitesine giriş yapmak için çerezlerin kullanımına izin vermelisiniz.
Lütfen tarayıcınızda gerekli ayarı etkinleştirin, aksi takdirde giriş yapamazsınız.