YouTube'dan Mağaza ile ilgili eğitici videoları izleyin
Bir alım-satım robotu veya gösterge nasıl satın alınır?
Uzman Danışmanınızı
sanal sunucuda çalıştırın
sanal sunucuda çalıştırın
Satın almadan önce göstergeyi/alım-satım robotunu test edin
Mağazada kazanç sağlamak ister misiniz?
Satış için bir ürün nasıl sunulur?
MetaTrader 5 için ücretli teknik göstergeler - 39

The GGP Trendlines with Breaks Alert MT5 Indicator is a technical analysis tool that can assist investors in identifying market trends. The indicator returns pivot point based trendlines with highlighted breakouts. Users can control the steepness of the trendlines as well as their slope calculation method. This indicator is MT5 conversion of the Trendlines with Breaks Indicator by “ LuxAlgo “ in Trading View website and some alert methods are added to provide real-time alerts when a trading sign
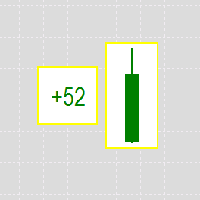
This Indicator shows the trend of movement. If the candle is red, you need to look for Buy signals. If the candle is Red, then look for a Sell signal.
The indicator is especially suitable for scalping.
When trading, take into account risk management.
For trading, I recommend the timeframe M5 M30
Good luck to all ))
If you have any questions, please contact us at +77767238899
Email dilshodaka25@gmail.com

GIVE A LOOK TO MY OTHER PRODUCTS ! 100 % PER MONTH PROFIT---- MY NEW SIGNAL HERE -------> https://www.mql5.com/en/signals/2162238?source=Site+Signals+My# Smoothed MA cross alert,is a cool indicator that notificate you directly on your telephone or email when 2 Smoothed Moving average ( you choose the parameters ) crosses. This is very important when you want to know a change of trend and you can't stay in front of your pc! The indicator give you the alert just when the next bar opens ,so give

Introducing our cutting-edge product, an innovative MACD Oscillator with a dynamic level enhanced by a decimal point Moving Average (MA) also with the versatility of multiple moving average modes. This advanced trading tool brings precision and flexibility to your technical analysis, offering a seamless experience for traders seeking a competitive edge in the financial markets.
Key Features: Dynamic Level Precision Our MACD Oscillator is equipped with a dynamic level feature, providing traders

Gobbo è un indicatore professionale che evidenzia il trend del mercato con un aspetto grafico chiaro e comprensibile, è basato sulla Moving Average e può essere impostato su qualsiasi periodo di intervallo, di default impostato sul periodo 14, scegliendo un periodo più alto evidenzierà meno cambi di tendenza per un approccio sul medio o lungo periodo, con un periodo più basso più cambi di tendenza per un approccio sul breve termine L'aggiornamento e l'adattamento al time frame scelto avviene in

Crash Spike Master, Crash piyasalarında işlem yapmak için gelecektir. 1 dakikalık zaman diliminde Crash 300, 500 ve 1000 piyasalarında çalışacak şekilde tasarlanmıştır. 2 farklı ticaret modu bulunmaktadır (Agresif ve Normal). Agresif mod, sarı ve mavi okları çizecektir. Doğru seçimi yapmanıza yardımcı olacak iki farklı koşul. İlk işlemi sarı ok üzerine girin ve ikinci işlemi mavi mum üzerine girin. Bu modda stop-loss, mavi oktan 10 mum uzakta olacaktır. Normal mod, yalnızca grafikte kırmızı okla

Altın Desen, Fibonacci dizisindeki altın orana dayalı 3 mumlu bir konfigürasyondur.
Altın oran 1,618'dir. Varyasyonları 0,618, 2,618 ve 3,618'dir. Bu göstergede sonuçlar 2,618 ile en iyi sonuçtur.
Altın formasyonu normal bir mum ve ardından ilk mumun en az 2,618 katı büyüklüğünde kapanış fiyatına sahip daha büyük bir mumdan oluşur.
Altın Boğa Deseni yükseliş mumlarından, Altın Ayı Deseni ise düşüş mumlarından oluşur.
Sinyale ek olarak, son 2 mumun üzerine yayılan, mavi bir çizgi

The Liquidation Estimates (Real-Time) experimental indicator attempts to highlight real-time long and short liquidations on all timeframes. Here with liquidations, we refer to the process of forcibly closing a trader's position in the market.
By analyzing liquidation data, traders can gauge market sentiment, identify potential support and resistance levels, identify potential trend reversals, and make informed decisions about entry and exit points.
USAGE (Img 1) Liquidation refer

Vision è un indicatore professionale che legge i dati storici del periodo impostato e in base a tali elabora una previsione scrivendo l'andamento sul grafico, l'impatto visivo eccellente rende chiaro l'andamento del prossimo trend e mette a fuoco il prezzo d'ingresso il posizionamento di ordini e la distanza per SL e TP, di default è impostato con un rapporto bilanciato 24 a 24 ciò significa che in base alle ultime 24 candele prevederà scrivendo sul grafico l'andamento delle 24 candele successi

Простой индикатор тренда в NRTR виде с отрисовкой линий стоплосса и тейпрофита, цвет и направление движения которых определяются действующим трендом. Индикатор имеет возможность подавать алерты, отправлять почтовые сообщения и push-сигналы при смене направления тренда. Следует учесть что значение входного параметра индикатора Deviation of the take profit line in points для каждого финансового актива на каждом таймфрейме необходимо подбирать индивидуально!

An indicator to show the current U.S. Dollar Index ( USDX , DXY , DX ). It is a weighted geometric mean of the dollar's value relative to the following select currencies: Euro (EUR), 57.6% weight. Japanese yen (JPY) 13.6% weight. Pound sterling (GBP), 11.9% weight. Canadian dollar (CAD), 9.1% weight. Swedish krona (SEK), 4.2% weight. Swiss franc (CHF) 3.6% weight.
You can request me to customize a similar indicator with weighted and currency pairs you desire. Just call me on MQL5, thank
Introducing the Engulfing Goddess Metatrader 5 (MT5) Indicator , a revolutionary tool designed for traders who seek to harness the power of candlestick patterns in their trading strategy. This indicator is built on the principles of engulfing candlestick patterns , a popular method used by successful traders worldwide. Our Engulfing Goddess Indicator stands out with its ability to detect various kinds of engulfing patterns . It employs a range of filters, providing you with a comprehensive anal
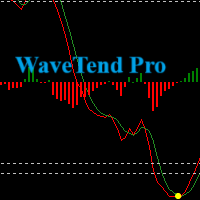
Introducing our Wave Trend Oscillator Indicator , exclusively designed for MetaTrader 5 . This advanced tool is a must-have for traders who seek precision and efficiency in their trading journey. Our oscillator is built on the principles of wave trend analysis , capturing the ebb and flow of market trends with unparalleled accuracy. It helps traders identify potential buying and selling points based on market wave patterns, enabling you to stay ahead of the market. One of the key features of ou

Introducing the True Currency Strength Indicator - Your Ultimate Guide to Market Mastery! Are you tired of guesswork when it comes to trading? Ready to elevate your trading strategy to a whole new level? Look no further! We present to you the True Currency Strength Indicator - the game-changer in the world of Forex trading. Unleash the Power of Multi-Currency Analysis: Gain a competitive edge with our revolutionary indicator that goes beyond traditional single-currency analysis. The Tru
Subscribe to the 'MA7 Trading' channel to receive notifications about new programs, updates and other information. Ask questions in the profile on the MQL5 .
Description of work
The 'MA7 Agave' indicator is based on the standard Average Directional Movement Index (ADX) indicator. Shows the intersection of the +DI and -DI lines. Detailed information about the 'MA7 Agave' indicator.
Indicator settings
General settings: ADX period - Average Directional Movement Index indicator period.
'MA7

This indicator helps you identify support and resistance levels. Also it adds break points when level is broken. Price sometimes goes back to break point. It has 4 technical parameters and 4 buffers for expert advisors. Buffer indexes: 0 - Resistance, 1 - Support, 2 - Resistance break point, 3 - Support break point". Number of Levels: Determines how many levels are on graph ( if 3 - 3 levels of support and 3 levels of resistance) Tolerance in percentage %: This parameter is used to filter out

Algo Map Lite ile tanışın - ticaret deneyiminizde devrim yaratmak için tasarlanmış son teknoloji bir yazılım. Bu gelişmiş araç, işlem seanslarınızla kusursuz bir şekilde bütünleşerek her durumda kapsamlı bir kırılma seviyesi analizi sağlar.
Sezgisel arayüzü ve gerçek zamanlı seviye yazdırma işlevselliğine ek olarak Algo Map Lite, performans iddialarını güçlendirmek için titiz kazanma oranı ölçümlerini bir araya getirmesiyle öne çıkıyor. Şeffaflık ve güvenilirliğe olan bağlılığımız, son 10

Our goal is to empower every trader with their own unique trading system.
Indicator - Red-Green Series
Ultimate simplicity: Red for uptrend, green for downtrend! It can be used independently or in combination with other indicators. This is a red-green indicator based on the crossover of two moving averages. We have more indicators in store and will be adding them gradually. Friends who make a purchase are kindly requested to contact us after their purchase.
In the world of financial tradi
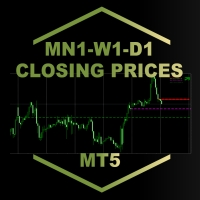
MN1-W1-D1 Close Price Indicator to Index Trading for MT5
The indicator draws lines to the close prices of the last closed bars of monthly, weekly and daily timeframes. Observably, these prices are significant support and resistance prices at major indices, like Nasdaq, DAX. The info panel always shows the prices relative to each other in the correct order. If the current price is the highest - i.e. higher than the last monthly, weekly and daily closing price - it is in the first row. The lowest

Smart Delta Volume: Dinamik Pazar Koşullarına Uyarlanabilir ve Hassas Araç Smart Delta Volume , sürekli değişen bir piyasa ortamında hassas ve uyarlanabilir analizler sunmak için tasarlanmış gelişmiş bir teknik göstergedir. Bu gösterge, volatiliteye göre otomatik olarak ayarlanan dinamik seviyeleri kullanarak, hacim akışı ile fiyat hareketleri arasındaki etkileşim hakkında daha kapsamlı ve güvenilir bir görüş sağlar. Bu uyarlanabilirlik, özellikle değişken piyasalarda hızlı ve doğru bilgiler

Subscribe to the 'MA7 Trading' channel to receive notifications about new programs, updates and other information. Ask questions in the profile on the MQL5 .
Description of work
The 'MA7 Flax' indicator is based on the standard Average True Range (ATR) indicator and candle data. Shows candles that are larger in size relative to the ATR indicator value. Detailed information about the 'MA7 Flax' indicator.
Indicator settings
General settings: ATR period – Average True Range indicator period

Subscribe to the 'MA7 Trading' channel to receive notifications about new programs, updates and other information. Ask questions in the profile on the MQL5 .
Description of work
The 'MA7 Viola' indicator is based on the standard Moving Average (MA) indicator. Shows a sharp increase or decrease in the moving average. Detailed information about the 'MA7 Viola' indicator.
Indicator settings
General settings: Difference – difference between the last two MA values, percentage; Period ; Method

We have turned one application of the RSI indicator into a separate indicator, represented by red and green bars, which is incredibly simple and effective.
By simply inputting the parameters for the RSI, you can obtain the RSI indicator represented by red and green bars. The application of the RSI indicator has been expanded into a powerful new indicator, visually presented through red and green bars, undoubtedly an innovative move in the field of financial technical analysis. The design of t

RSI Barometer Pro provides traders and investors with intuitive insights into market sentiment and potential trend reversals by representing RSI values using red and green bars. The meticulous design of red and green bars in RSI Barometer Pro visually showcases market dynamics. When the bars appear green, it indicates that the RSI is below 50, suggesting a relatively stable market phase. Conversely, when the bars turn red, it signifies that the RSI is above 50, indicating potential market volat

Product Name: RSI Momentum Gauge
Product Description: The RSI Momentum Gauge is an advanced indicator that transforms the traditional concept of overbought and oversold signals from the RSI (Relative Strength Index) into a visually intuitive representation using red and green bars. Designed to empower traders and investors with actionable insights, this innovative indicator provides a clear assessment of market conditions and potential trend reversals. The RSI Momentum Gauge's distinctive fea

Pips on Candles shows the number of pips involved in each candle on the chart. It is possible to set 3 different ranges for counting on each single candle via the RangeType parameter: With "HighLow" you count the pips present between the minimum and the maximum. The number is shown under each candlestick on the chart. With "OpenClose" you count the pips present between the opening and closing price of the candle. The number is shown under each candlestick on the chart. With "HighDistAndLowDist"

Exclusive Limited Time Offer! Grab this useful indicator for a lifetime at just $49. Enhance your trading experience with this amazing Metatrader indicator that tracks your live trade status. The indicator displays live take profit, stop loss & trailed stop loss, or trailed profit value with the best dashboard with account balance alert. Indicator Features:
Trade Details The indicator shows the last 5 active trades data in chronological order. Don't miss this opportunity to get your copy tod
Exclusive Limited Time Offer! Grab this powerful indicator for a lifetime at just $45 . Gain an unparalleled edge in the forex market with this Forex Correlation Dashboard Indicator, designed to streamline your trading process and provide deep insights through multi-timeframe, multi-currency correlations. Perfect for both novice and experienced traders, this indicator offers advanced features that empower you to make better-informed decisions, ultimately leading to more profitable trades. Joi
Subscribe to the 'MA7 Trading' channel to receive notifications about new programs, updates and other information. Ask questions in the profile on the MQL5 .
Description of work
The 'MA7 Galega' indicator is based on the standard Moving Average (MA) indicator. Shows a puncture of the moving average. Detailed information about the 'MA7 Galega' indicator.
Indicator settings
General settings: Period – MA period; Method – MA method; Apply to – price type; Consider the direction of the candle

Subscribe to the 'MA7 Trading' channel to receive notifications about new programs, updates and other information. Ask questions in the profile on the MQL5 .
Description of work
The 'MA7 Ixora' indicator is based on the standard Moving Average (MA) indicator. Shows the intersection of the fast and slow moving averages. Detailed information about the 'MA7 Ixora' indicator.
Indicator settings
General settings: Consider the direction of the candle .
Fast moving average settings: Period – M

MACD Histogram göstergesi, traderların piyasa trendlerini ve momentum değişikliklerini daha iyi anlamalarını sağlamak için tasarlanmış, MACD göstergesinin güncellenmiş bir versiyonudur. Orijinal MACD'den farklı olarak, bu versiyon iki çizgi arasındaki farkı gösteren bir çubuk grafik olan bir histogram içerir: MACD çizgisi ve sinyal çizgisi. Nasıl çalıştığına gelince: MACD çizgisi sinyal çizgisinin üzerinde olduğunda, yükseliş piyasasını önerir ve histogram çubukları yeşil renkte gösterilir. Öte

Subscribe to the 'MA7 Trading' channel to receive notifications about new programs, updates and other information. Ask questions in the profile on the MQL5 .
Description of work
The 'MA7 Aster' indicator is based on the standard Moving Average (MA) indicator. Shows the price deviation from the moving average. Detailed information about the 'MA7 Aster' indicator.
Indicator settings
General settings: Period – MA period; Method – MA method; Apply to – price type; Minimum distance – minimum d
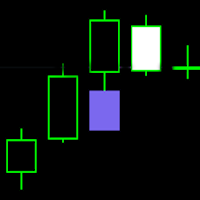
FVG - Fair Value Gap indicator is a three candle pattern indicator . It find inefficiencies or imbalances in market. It act as magnet before continue the trend.
indicator key function
1. No object is used to draw the plot. You can use this to build EA and backtest also.
2. Min and max value to Filter-out the noises .
It use as retest zone and can be use as entry price also. It popular among price action traders. your suggestion and comments are welcome and hopping that you will find th

Subscribe to the 'MA7 Trading' channel to receive notifications about new programs, updates and other information. Ask questions in the profile on the MQL5 .
Description of work
The 'MA7 Hypnum' indicator is based on the standard Commodity Channel Index (CCI) indicator. Shows overbought and oversold zones. Detailed information about the 'MA7 Hypnum' indicator.
Indicator settings
General settings: Period – period of the CCI indicator; Apply to – price type for calculating the CCI indicator

This indicator is created for traders who realized the need to study fundamental changes in the economy on global trends of world markets. Understanding that there are no easy ways in the world of big money, your odds. Secret Fairway indicator is designed as a universal tool in the arsenal of trader, analyst, investor. With it, you can create your own dashboard that reflects your views on economic theory and practice. By evolving with each transaction, each read book, article, and every entry
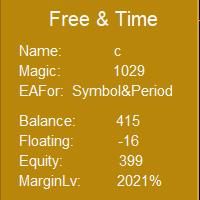
This indicator can use EAMagic to statistics EA since the operation of the revenue data and the current trading volume and trade data statistics, now the first version, should be slowly updated. When using, you must enter the number of EA's Magic when loading, in order to receive EA's transaction data. The part of the input currency pair and cycle can be filled in by the user to more clearly understand the currency pair and cycle that is currently being traded, and to facilitate the screenshot
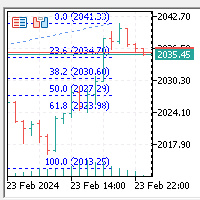
This indicator automatically generates Fibonacci regression lines in the K-line window: 0.0%, 23.6%, 38.2%, 50.0%, 61.8%, and 100.0%, following the displayed price. Zoom In, Zoom Out, Time Frame (M1, M5, M15, M30, H1, H4, D1, W1, MN) can automatically update and generate when the cycle changes, with the highest price worn up and the lowest level broken down. Both upward and downward trends can automatically adjust the direction of the Fibonacci regression line.

Kritik Bölgeler özellikle daha doğru piyasa girişleri arayan manuel yatırımcılar için oluşturulmuştur. Bu gösterge, grafikteki en ilgili destek ve direncin yanı sıra bunların kırılma ve yeniden testlerini hesaplayarak ilgi alanlarını tespit etmek için gelişmiş algoritmalar kullanır. Bu gösterge, potansiyel olarak kazançlı alım / satım fırsatları tespit edildiğinde uyarılar ve bildirimler gönderecek şekilde yapılandırılabilir ve yatırımcıların ekranlarının / MT4 sürümlerinin önünde olmadık

Candlesize Histogram is an indicator for monitoring candlestick sizes. This indicator is based on the high and low of a candle, also adopting the use of a histogram to easily determine the length of each candlestick bar. We can determine if the market is gaining momentum using this indicator. The histogram is calculated based on the size of the bars.
Key benefits
- Easily get the length of every candlestick
- Determine market condition if trending or not trending using the Candl
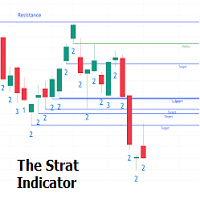
The Strat indicator is a full toolkit regarding most of the concepts within "The Strat" methodology with features such as candle numbering, pivot machine gun (PMG) highlighting, custom combo highlighting, and various statistics included.
Alerts are also included for the detection of specific candle numbers, custom combos, and PMGs.
SETTINGS
Show Numbers on Chart: Shows candle numbering on the chart.
Style Candles: Style candles based on the detected number. Only effective on no

Gösterge "Destek" ve "Direnç" çizgilerini gösterir (bu çizgiler DRAW_LINE çizim stili kullanılarak çizilmiştir - yani bunlar grafik nesneleri değildir). "Sinyal çubuğunun" solunda ve sağında yeni minimum ve maksimumlar için bir arama gerçekleştirilir - "sinyal çubuğu" her yeni yapının geleneksel ortasıdır. Göstergenin adında neden Esnek kelimesi geçiyor? Çünkü "sinyal çubuğunun" solunda ('Sol Çubuklar') ve sağında ('Sağ Çubuklar') farklı sayıda çubuk belirtme olanağımız var. Gösterge çizgi

Gerçek Zamanlı Çok Para Birimli Volatilite Tarayıcı Merhaba, traderlar. Sizlere eşsiz bir çözüm sunuyorum: Gerçek Zamanlı Çok Para Birimli Volatilite Tarayıcısı. Bu gösterge, birçok yıl boyunca kişisel piyasa gözlemlerimin bir sonucudur. Traderların karşılaştığı çeşitli temel sorunları ele alır: Gerçek Zamanlı Volatilite Takibi: Anlamlı hareketlerin nerede gerçekleştiğini görmek için sürekli olarak güncelleme yapma veya grafikleri değiştirme ihtiyacını ortadan kaldırır. Uluslararası Korelasyo

To get access to MT4 version please click here . This is the exact conversion from TradingView: "Schaff Trend Cycle" by "everget". This is a light-load processing indicator. This is a non-repaint indicator. Buffers are available for processing in EAs. All input fields are available except fillings(due to graphical aesthetics). You can message in private chat for further changes you need. Thanks for downloading

Gösterge yükseliş ve düşüş eğilimi gösteriyor. Göstergenin kendisi (normal stokastik gibi) bir alt pencerede görüntülenir. Grafik arayüzü : Ana pencerede, "Düşük" fiyattan "Düşük" fiyata (yükseliş farklılığı için) ve "Yüksek" fiyattan "Yüksek" fiyata (düşüş eğilimi sapması için) kadar üretilen "trend çizgisi" grafik nesneleri oluşturulur. ). Gösterge, penceresinde yalnızca grafik tamponlarını kullanarak çizer: “Ana”, “Sinyal”, “Nokta”, “Al” ve “Satış”. "Al" ve "Satış" tamponları farklılık gös

Pips Hunter PRO birkaç yıl içinde geliştirilmiştir ve selefinin geliştirilmiş bir versiyonudur. Bu güçlü gösterge, alım ve satım girişleri oluşturmak için piyasa ve fiyat geçmişini analiz eder. Bu girişlerin hesaplanması için, birlikte çalışan farklı göstergelerin yanı sıra daha az uygun girişleri filtreleyen ve bunları ortadan kaldıran karmaşık bir istatistiksel logaritma kullanır / MT4 sürümü . Stratejinin yüksek düzeyde verimliliğini sürdürmek için sürekli arama nedeniyle fiyat, 1000$ 'a
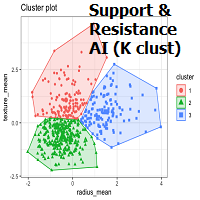
OVERVIEW
K-means is a clustering algorithm commonly used in machine learning to group data points into distinct clusters based on their similarities. While K-means is not typically used directly for identifying support and resistance levels in financial markets, it can serve as a tool in a broader analysis approach.
Support and resistance levels are price levels in financial markets where the price tends to react or reverse. Support is a level where the price tends to stop falling
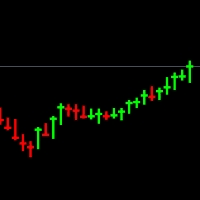
Not - mevcut grafik türünüzü gizlemeniz gerekir, bunu grafiğin renklerini değiştirerek yapabilirsiniz, nasıl yapılacağını bilmiyorsanız bu videoya göz atın - https://youtu.be/-4H6Z5Z4fKo veya priceaction9@outlook.com adresinden benimle iletişime geçin.
Bu, grafiğinizin yerine gösterilecek bir grafik türüdür ve yalnızca Yüksek, düşük ve yakını gösterir ve kalın fitillere sahiptir. Her bir mumdaki açık fiyatların yarattığı gürültüyü azaltarak her bir mumu daha iyi anlamanıza yardımcı olur.
Ö

This indicator, named Edyx_Candle_Size, is designed to be used with the MetaTrader 5 trading platform. It displays the size of the candlestick body for the current timeframe as a histogram. The indicator does not provide any specific trading signals or recommendations
Measures the size of of the candlestick. That is the difference between the open and close as the case may be for either a bullish or a bearish candle. This can be use to filter out entry position as to maximise profit and minimi

Order Blocks are supply or demand zones in which big traders can find the comfort of placing large buy and sell orders and completing a big, very big transaction. Order blocks are a unique trading strategy that helps traders find a direction in the market. Usually, it allows traders to find out what financial institutions are planning to do in a particular market and better indicate the next price movement.

Ticaretinizi bir sonraki seviyeye taşımaya hazır mısınız? WH Divergence Pro MT5 ile tanışın ,
çeşitli popüler teknik göstergeler arasından seçim yapmanızı sağlayan gelişmiş bir sapma göstergesi.
Artık sapma sinyallerinizi benzersiz ticaret stratejinize uyacak şekilde uyarlayabilirsiniz. Süreçler boyunca size rehberlik etmek için satın aldıktan sonra benimle iletişime geçin Ana Özellikler :
Gösterge Seçimi : Aşağıdaki seçenekler arasından tercih ettiğiniz göstergeyi seçin: RSI (G

Combination of Ichimoku and Super Trend indicators, with Signals and live notifications on Mobile App and Meta Trader Terminal. Features: Display five reliable signals of ARC Ichimoku Filter signals by their strength level (strong, neutral, weak) Send live notifications on Mobile App and Meta Trader terminal S ignals remain consistent without repainting Applicable across all time-frames Suitable for all markets Notifications format: "ARC Ichimoku | XAUUSD | BUY at 1849.79 | Tenken-Kijun cross |
Limited time offer, 30 usd only!!!
Discover the unparalleled capabilities of MentFX's structural rules , now optimized for MT5 ! Our state-of-the-art algorithm is engineered to commence calculations from a robust dataset spanning 1500 bars from the current position . This meticulous approach ensures unparalleled accuracy and dependability in your trading endeavors. Experience the seamless integration of MentFX with MT5 , empowering you to analyze markets with precision and confidence. With Me

Kontrol paneli iki göstergenin okumalarını tarar: 'MACD' ve 'Stokastik'. Sinyalleri üç sütunda görüntüler: MACD için, Stokastik için ve sonuç sütunu (sinyal her iki gösterge için de aynıysa). Tarama bir veya daha fazla zaman diliminde seçilebilir. Tüm zaman aralıklarını devre dışı bırakırsanız kontrol paneli yine de yüklenir, ancak bu tür durumlara özel ayarlar bulunur. Sinyaller her zaman göstergenin sıfır çubuğu (sıfır çubuğu grafikte en sağdaki çubuktur) açısından kontrol edilir. Parametreler

The well-known ZigZag indicator that draws rays based on the "significant movement" specified by the pips parameter. If a ray appears, it will not disappear (the indicator is not redrawn), only its extremum will be updated until the opposite ray appears. You also can display text labels on each rays describing the width of the ray in bars and the length of the ray in points.
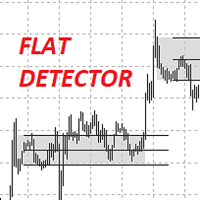
I present to you the IndFlatDetector indicator.
It belongs to the level indicators and shows the Trading Levels. This indicator combines the simplicity of intuitive settings and the accuracy of drawing levels.
Up count - the number of candlesticks up to determine the upper range
Down count - the number of candlesticks down to determine the lower range
Borders on the body or shadow - calculate the range by shadows or by body
Change the borders or not - change the boundaries of the orig

The ZigZag Wave Entry Alert** indicator, created by Azad Gorgis in 2024, is designed for MetaTrader 5 and aims to provide traders with entry signals based on ZigZag patterns. Here's a brief overview of its functionality and key features:
Functionality:
- Detection of ZigZag Patterns: The indicator identifies significant price movements and outlines potential ZigZag patterns on the chart. It detects new highs and lows based on user-defined parameters such as Depth, Deviation, and Backstep. -

The " Session Control " indicator is designed to display trading sessions on a price chart. This allows the trader to see at what points of activity the most important trading sessions occur: Pacific, European, American and Asian. Each of these sessions is characterized by a certain volatility and activity in the market, which is important for making trading decisions.
Peculiarities: Displaying sessions : The indicator shows time periods on the price chart corresponding to different trading s
Bu gösterge sabitlenmiş yarı logaritmik ölçekli bir osilatördür. Logaritmik ölçek, profesyonel veri bilimcileri tarafından, MT5'in fiyat verilerini haritalandırdığı gibi, bir zaman dilimi boyunca toplanan bilgileri daha doğru bir şekilde haritalandırmak için yaygın olarak kullanılır. Aslında bu göstergenin altında yatan mantık yurtdışındaki bir biyoteknoloji bilim adamından serbestçe elde edildi.
Bir log-log grafiği, hem x (yatay) hem de y (dikey) eksenlerinde logaritmik değerleri görüntüler;

Brief Description: A tool to display historical Open, High, Low, and Close (OHLC) price points for various time periods. Gain insights into market behavior with data from yesterday, the day before, the previous week, and the previous month. Recognize liquidity zones effectively. Features: 1. Comprehensive Timeframe Insights: Visualize crucial OHLC points for different timeframes. Historical data for yesterday, day before yesterday, previous week, and previous month. 2. Built on ICT's Teachings:

This indicator informs the user when the ATR is above a certain value defined by the user, as well as when the ATR prints a percentage increase or percentage decrease in its value, in order to offer the user information about the occurrence of spikes or drops in volatility which can be widely used within volatility-based trading systems or, especially, in Recovery Zone or Grid Hedge systems. Furthermore, as the volatility aspect is extremely determining for the success rate of any system based o

Introducing the Consecutive Green/Red Candle Alert Indicator for MT5 - Your Trend Spotting Companion!
Are you ready to take your trading to the next level? We present the Consecutive Green/Red Candle Alert Indicator, a powerful tool designed to help you spot trends and potential reversals with ease. Whether you're a new trader looking for clarity in the market or an experienced pro seeking additional confirmation, this indicator is your trusted companion.
Key Features of the Consecutive Gre

Buy CTS scalping indicator, provide buying and selling signals, automatic channeling and sending signals to mobile phones
Using technical analysis and price action methods and modern methods, CTS indicator can draw price channels and recognize price trends with high accuracy and issue entry and exit signals according to them. Traders can easily fluctuate using this indicator in different time frames and in different markets. With the CTS indicator, you can signal in different ways. This indicat
Buy DEMA 3 Scalp Indicator, Signaling and Trend Finder for Forex DEMA 3 indicator is a professional indicator for finding trends as well as finding entry and exit points for a symbol. This indicator is designed based on the DEMA indicator, which can tell you the signals accurately and quickly. The DEMA 3 indicator can give you accurate and early entry points for swings. Features of the DEMA indicator 3
Receive signals as notifications on the Metatrader mobile application. Receive signals by em
Linear regression AI powered Indicator: Linear regression is a simple yet effective AI technique that is the foundation of complex neural networks, This indicator is built based on linear regression analysis and tries to make predictions on the upcoming event in the market Inputs : train_bars: This controls the number of bars that the price information will be collected and used to train the AI inside it, The greater this value the better also the slower the indicator becomes during initializati

Ünlü Süper Trend göstergesinin tanıtım gerektirmeyen en kaliteli uygulaması. Orijinal algoritmaya tamamen sadıktır ve CCI indikatörü ile güçlendirilmiştir.
- Ticareti kolay - Her türlü uyarıyı uygular. - Çok zaman dilimli bir kontrol paneli uygular. - Yeniden boyanmaz ve arkadan boyanmaz.
Giriş parametreleri - ATR Dönemi - Bu ortalama gerçek aralık dönemidir. - ATR Çarpanı - Trendi tanımlayan ATR çarpanı. - CCI - Trend takibini güçlü kılar. - Maksimum Geçmiş Çubukları - Gösterge grafiğe yükl
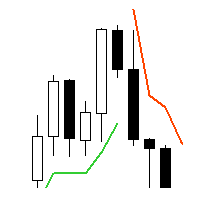
Supertrend - невероятно мощный и универсальный индикатор, предназначенный для помощи трейдерам в определении текущего тренда на конкретном торговом инструменте. С помощью двух встроенных индикаторов, Average True Range и Standard Deviation, трейдеры могут выбрать наиболее подходящий индикатор для своей стратегии торговли. Пользователи также могут настроить период этих индикаторов и выбрать цену (Close, High, Low, Open, Weighted), к которой он должен быть применен, с Typical price в качестве опци

Heikin Ashi Heikin Ashi, gelecekteki fiyat hareketlerini tahmin etmek için kullanılabilecek bir grafik tekniğidir. Geleneksel mum grafiklerine benzer. Bununla birlikte, normal bir mum grafiği aksine, Heikin Ashi grafiği, piyasadaki trend hareketlerini daha iyi tanımlamak için güçlü fiyat dalgalanmalarını yumuşatarak piyasa gürültüsünün bir kısmını filtrelemeye çalışır. Heiken Ashi'yi oluşturmak için, fiyat verilerinin girildiği bir formül kullanılırken, sıradan mumlar herhangi bir hesaplama kull

Çalışma prensiplerinizi alt üst edecek bir buluş.
Özellikle yatay ve durgun piyasalarda can sıkıcı kayıplar yaşanabiliyor.
Ayrıca trend çizgilerini, destek ve dirençleri takip etmek yorucu olabilir.
Tüm bunlara son vermek için profesyonel bir "hareketli ortalama" göstergesi oluşturmaya karar verdim.
Tek yapmanız gereken renkleri takip etmek.
Ek desteğe ihtiyacınız varsa profilimdeki "Heiken-Ashi" mum göstergesini öneririm.
bol kazançlar dilerim..

Description: Dimatis Watchtower is a powerful backtesting tool designed for traders seeking for an efficient way to test and optimize their trading strategies on the MetaTrader 5 platform. With a minimalist interface and advanced features, this tool provides an outstanding solution for evaluating the performance of your strategies in various market conditions. Key Features: Backtesting: Perform precise and reliable backtests of your strategies using historical data from your broker directly on M

Supertrend, Ortalama Gerçek Aralık 'a (ATR) dayanan trendi takip eden bir göstergedir. Tek çizgisinin hesaplanması, eğilim algılama ve volatiliteyi birleştirir. Trend yönündeki değişiklikleri tespit etmek ve durakları konumlandırmak için kullanılabilir.
Temel bilgiler Supertrend trendi takip eden bir göstergedir. Ana grafikte yer kaplar ve çizimleri mevcut eğilimi gösterir. Bir Supertrend, değişen sürelerde (günlük, haftalık, gün içi vb.) ve değişen araçlarda (hisse senetleri, vadeli işlemle
MetaTrader mağazasının neden alım-satım stratejileri ve teknik göstergeler satmak için en iyi platform olduğunu biliyor musunuz? Reklam veya yazılım korumasına gerek yok, ödeme sorunları yok. Her şey MetaTrader mağazasında sağlanmaktadır.
Alım-satım fırsatlarını kaçırıyorsunuz:
- Ücretsiz alım-satım uygulamaları
- İşlem kopyalama için 8.000'den fazla sinyal
- Finansal piyasaları keşfetmek için ekonomik haberler
Kayıt
Giriş yap
Gizlilik ve Veri Koruma Politikasını ve MQL5.com Kullanım Şartlarını kabul edersiniz
Hesabınız yoksa, lütfen kaydolun
MQL5.com web sitesine giriş yapmak için çerezlerin kullanımına izin vermelisiniz.
Lütfen tarayıcınızda gerekli ayarı etkinleştirin, aksi takdirde giriş yapamazsınız.