YouTube'dan Mağaza ile ilgili eğitici videoları izleyin
Bir alım-satım robotu veya gösterge nasıl satın alınır?
Uzman Danışmanınızı
sanal sunucuda çalıştırın
sanal sunucuda çalıştırın
Satın almadan önce göstergeyi/alım-satım robotunu test edin
Mağazada kazanç sağlamak ister misiniz?
Satış için bir ürün nasıl sunulur?
MetaTrader 5 için teknik göstergeler - 8

Divergence Force Diverjans Göstergesi Açıklama Divergence Force , bir varlığın fiyatı ile MACD (Hareketli Ortalama Yakınsama Iraksama) arasındaki uyumsuzlukları belirlemek için tasarlanmış bir göstergedir. Bu gösterge, fiyat ve MACD'nin zirve ve dip noktalarına otomatik olarak trend çizgileri çizer ve potansiyel ticaret fırsatlarını vurgular. Temel Özellikler Otomatik Uyumsuzluk Tespiti : Gösterge, fiyat ve MACD arasındaki boğa ve ayı uyumsuzluklarını otomatik olarak tespit eder. Trend Çizgisi T
FREE

This indicator managge all kind of ICT FVG include: FVG, SIBI, BISI, Inverse FVG. The advantage point of this indicator is mangage FVG on all timeframe. FVG - Fair value gap ICT Fair value gap is found in a “three candles formation” in such a way that the middle candle is a big candlestick with most body range and the candles above & below that candle are short and don’t completely overlap the body of middle candle. * This indicator allow filter FVG by ATR. So you can just show valid FVG which

This indicator is very useful for day traders or short term traders. (MT5 version) No need to calculate the number of pips manually, just look at the chart and you will see the Virtual Take Profit / Virtual Stop Loss target line and evaluate whether the entry point is feasible to reach the intended target or not.
Enter the intended Take Profit / Stop Loss pips for your trade. The indicator will display Virtual Take Profit / Virtual Stop Loss lines for you to easily see if the target is
FREE

Spike Catch Pro 22:03 release updates Advanced engine for searching trade entries in all Boom and Crash pairs (300,500 and 1000)
Programmed strategies improvements Mx_Spikes (to combine Mxd,Mxc and Mxe), Tx_Spikes, RegularSpikes, Litho_System, Dx_System, Md_System, MaCross, Omx_Entry(OP), Atx1_Spikes(OP), Oxc_Retracement (AT),M_PullBack(AT) we have added an arrow on strategy identification, this will help also in the visual manual backtesting of the included strategies and see ho
FREE

Önemli Not: Ekran görüntülerinde gösterilen "Bazı görseller" benim indikatörlerim olan Suleiman Levels Indicator ve RSI Trend V Indicator 'dan alınmıştır. RSI Trend V Indicator trend belirleme amacıyla tasarlanmış olup, Fibonacci ile entegre edilerek hedef bölgeleri ve potansiyel geri dönüş noktalarını belirler. Bu, genel trend yönünü belirlemede son derece güçlü, katı ve kullanışlı bir indikatördür. Potansiyel fiyat hareketi geri dönüş bölgelerinde görünen yükseliş ve düşüş okları içerir. Anca

MACD is probably one of the most popular technical indicators out there. When the market is trending, it actually does a pretty good job, but when the market starts consolidating and moving sideways, the MACD performs not so well. SX Impulse MACD for MT4 is available here . Impulse MACD is a modified version of MACD that works very well for trading Forex, stocks, and cryptocurrencies. It has its own unique feature which perfectly filters out the values in a moving average range and enables it

This indicator automatically identifies demand and supply zones on a number of 1000 candles or more, and you can change that number of settings.
It also carries a high level of accuracy in describing the type of each zone, as it contains:
Weak areas .
Untested areas . Strong areas . Role-taking areas . Areas tested + number of times visited . Areas to which a return is expected, depending on the direction . The indicator contains alert zones.
For signals and more free indicators, you can foll
FREE

** All Symbols x All Timeframes scan just by pressing scanner button ** *** Contact me to send you instruction and add you in "M W Scanner group" for sharing or seeing experiences with other users. Introduction: Double Top(M) and Double Bottom(W) is a very repetitive common type of price reversal patterns. Double Top resembles M pattern and indicates bearish reversal whereas Double Bottom resembles W pattern and indicates a bullish reversal that they have high win rate. The M W Scanne

Structure Blocks: a structured way to analyze market structure
This indicator is for you if you are a price action or smart money concept trader. It identifies market trends' ultimate highs and lows and intermediaries' swing lows and highs. It adjusts based on candles' body where most of the volume is, disregarding wicks. Need help or have questions? I am Lio , don't hesitate to reach out! I am always available to respond, help, and improve. How it works:
Each block consists of a move with
FREE

The Volume+ and VSA Signals indicator for MT5 is based on the Volume Spread Analysis (VSA) methodology to provide the signals. The signals are displayed at closing of bars on the main window or subwindow in the form of symbols. The symbols are not repainting. The indicator produces a signal on an individual bar and this signal is not buy or sell signal. When a minor trend goes in the opposite direction of a major trend, there are sequences of major trend-following signals that give a higher pro

The SyntheticaFX Boom & Crash Multi Indicator for MetaTrader 5 is an advanced trading tool designed to enhance your trading strategy by detecting potential spikes and analyzing market trends across various timeframes. This indicator is specifically tailored for the Crash and Boom indices, providing timely alerts and essential trend information to help you make informed trading decisions.
Key Features:
1. Spike Detection: - Identifies potential spikes on the following indices and timeframe

The Volume Weighted Average Price is similar to a moving average, except volume is included to weight the average price over a period. Volume-Weighted Average Price [VWAP] is a dynamic, weighted average designed to more accurately reflect a security’s true average price over a given period . Mathematically, VWAP is the summation of money (i.e., Volume x Price) transacted divided by the total volume over any time horizon, typically from market open to market close.
VWAP reflects the capitali
FREE

Boom and crash Gold Miner v2 trend histogram which works in conjunction with the indicator above that has arrows as shown in the video. PLEASE Note: That the top indicator and the bottom indicator are two separate indicators. the top indicator is https://www.mql5.com/en/market/product/98066 the bottom one is free. which is the histogram at the bottom. the trend histogram trading tool that helps to easy detect the trend blue color indicates an uptrend. Orange color is a down trend.
FREE

Overview The TTM Squeeze indicator helps identify low volatility periods (squeeze) that often precede price breakouts. It uses Bollinger Bands (BB) and Keltner Channels (KC) to determine when the market is "coiling" and ready to move. Configuration Guide Volatility Settings The indicator uses Bollinger Bands to measure market volatility. When BBs are inside Keltner Channels, a squeeze is detected. The squeeze suggests the market is consolidating and may soon break out. True Range Option Optional
FREE

ZigZag Indicator for MT5
The ZigZag Indicator is a valuable tool available in MetaTrader 5, designed to highlight the highs and lows on a price chart. By marking pivotal turning points in price—commonly referred to as Pivot Highs and Lows (HH-HL-LH-LL)—it simplifies the process of identifying price trends. In any price movement, consecutive peaks and troughs are formed. Understanding these patterns correctly is essential for recognizing the direction of the overall market trend or short-term fl
FREE

MASpeed, hareket hızı göstergesi ile evrensel hareketli ortalamadır. Ortalama, eşikten daha hızlı hareket ettiğinde çizgideki noktalar görünür. Eşik değerini ayarlarda belirtebilirsiniz. Bu göstergeye dayanarak, çok çeşitli ticaret stratejileri oluşturabilirsiniz. Göstergede hareketli ortalamanın ayarlanması için büyük fırsatlar var - 10 çeşit yumuşatma. İnşa edilecek 12 fiyat seçeneği. Ortaya çıkan hareketlerin ayrıştırılması için bir seçenek eklendi. Ek avantajlar şunlardır: hızlı ve optimize
FREE

Introduction
WaveTrend Plus is an amazing oscillator that can detect optimal entry points in the market with high precision using complex computations of price and momentum. This version packs many improvements compared to the original WaveTrend such as cleaner visuals, oversold/overbought signals and divergence detection
Signal
Buy when oversold signal appear (green dot below) or when a bullish divergence is detected (green dashed line)
Sell when overbought signal appear (red dot above) or
FREE
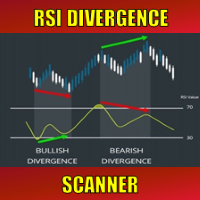
Special offer : ALL TOOLS , just $35 each! New tools will be $30 for the first week or the first 3 purchases ! Trading Tools Channel on MQL5 : Join my MQL5 channel to update the latest news from me Dinamik finansal piyasalarda, trend dönüş sinyallerini tanımlamak etkili ticaret için esastır. RSI Divergence Scanner, çeşitli döviz çiftleri ve zaman dilimleri üzerinde RSI diverjans sinyallerini doğru ve verimli bir şekilde tespit etmenize yardımcı olmak için tasarlanmıştır. Daha fazla
FREE
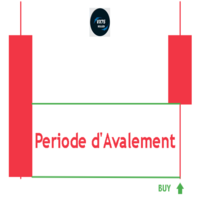
Engulfing Period V75Killed İndikatörü: Ticaret Stratejinizi Değiştirin!
(Bu indikatör ÖZELDİR ve yalnızca belirli amacı ve değerini bilen trader'lar için tasarlanmıştır.) Engulfing Period V75Killed İndikatörü, birden fazla zaman diliminde önemli engulfing dönemlerini zahmetsizce belirlemek isteyen trader'lar için bir devrim niteliğindedir. Engulfing bölgelerini grafiğinizde doğrudan işaretleyerek, bu indikatör zamandan tasarruf etmenizi sağlar ve yüksek olasılıklı ticaret fırsatlarını yakalama
FREE
Ekom Spike Detector
Navigate the volatile world of Boom and Crash indices with the Ekom Boom and Crash Spike Detector Indicator. This powerful tool detects explosive price movements, providing traders with accurate buy and sell signals 24/7.
Key Features:
- Accurate Spike Detection : Identify high-probability spike patterns in real-time - Clear Visual Signals : Displays clear buy and sell arrows on the chart for easy decision-making - Customizable : Easily switch from either Boom or Crash ba
FREE

Renko is a well-known Japanese charting technique that removes time from the chart. Instead of drawing bars in constant intervals (time) as a normal chart would, a Renko chart does so only when price moves beyond a predefined amount.
In a Renko chart, a bar is created when price exceeds the previous bar’s high or low by a predefined amount or what we call the Box Size. The result is a chart with equally sized bars running up or down in 45 degree angles. Such a chart offers the following advanta

VWAP, or volume-weighted average price, helps traders and investors observe the average price that major traders consider the "fair price" for that move. VWAP is used by many institutions to set up large operations.
In this indicator, you can enjoy the following features:
Daily VWAP, with option to display your current price next to the chart VWAP Weekly, with option to display your current price next to the chart Monthly VWAP, with option to display your current price next to the chart
FREE

Trend Line Finder will project forward a support and resistance lines using 2 previous highs for resistance and 2 previous lows for support. It will then signal to the trader by alert making the trader more aware that a possible good move is about to happen. This is not a stand-alone trading system but is very useful in finding key areas of support resistance levels where price will usually either rebound from or breakthrough. Its down to the trader to decide what to do with use of other s
FREE

I am a trader specializing in the development of rare , exclusive , high-performance trading bots designed for serious traders who are committed to achieving consistent profitability and success. This free indicator is more than just a visual tool—it powers the Midnight Throttle EA , an automated trading system that executes trades based on the precise market conditions this indicator observes. Midnight Watch : A Pro-Level Tool for Precision Market Analysis. An advanced , multi-functional MetaTr
FREE

The famous brazilian trader and analyst Didi Aguiar created years ago a study with the crossing of 3 Simple Moving Averages called "Agulhada do Didi", then later was also named Didi Index, as a separate indicator. The period of those SMAs are 3, 8 and 20. As simple as that, this approach and vision bring an easy analysis of market momentum and trend reversal to those traders looking for objective (and visual) information on their charts. Of course, as always, no indicator alone could be used wit
FREE

Purpose and functions of the indicator The indicator determines and marks the moments of trend change on the chart based on the theory of fractal levels breakout on any of the analyzed timeframes. If a breakout based on all rules is valid, a horizontal line with corresponding color will appear on the chart. If there is an uptrend, the line will be blue. In the descending trend, the line will be red. The blue line is a strong support level, the trader should look for buying opportunities above th

This is a derivative of John Carter's "TTM Squeeze" volatility indicator, as discussed in his book "Mastering the Trade" (chapter 11).
Gray dot on the midline show that the market just entered a squeeze (Bollinger Bands are with in Keltner Channel). This signifies low volatility, market preparing itself for an explosive move (up or down). Blue dot signify "Squeeze release".
Mr.Carter suggests waiting till the first blue after a gray dot, and taking a position in the direction of the moment
FREE
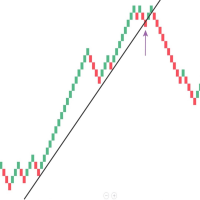
Mean Renko Bars are used for alternate price charting. Unlike the usual time framed chart – where every candle represents a fixed time interval – the goal of Renko chart is to display price movement in increments, called bricks. Best with the momentum strategies. Can make some Algo with this candel ---- ---- ---- ---- ---- ---- ---- ---- ---- ---- Support: primecapitalvn@ gmail. com
FREE
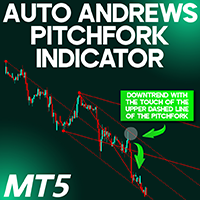
Auto Andrews Pitchfork indicator MT5
The Auto Andrews Pitchfork indicator MT5 is a specialized technical tool on the MetaTrader 5 platform that automatically plots three equidistant, parallel trendlines by using three selected pivot points (significant highs and lows). These lines serve as evolving zones of support and resistance, providing actionable trade signals when price interacts with them. This tool simultaneously generates two pitchfork patterns—one outlined in dotted lines and the othe
FREE
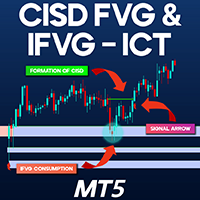
CISD - CSD + FVG – IFVG ICT Indicator for MT5 The CISD – CSD + FVG – IFVG indicator is an advanced tool that identifies CISD levels within liquidity-based trading strategies on MetaTrader 5 . This indicator examines price behavior concerning FVG and IFVG zones and generates arrow signals to highlight CISD levels, offering potential trade entries and reversal alerts. CISD – CSD + FVG – IFVG Indicator Specifications The table below outlines the key features of the CISD - CSD + FVG - IFVG indicat
FREE
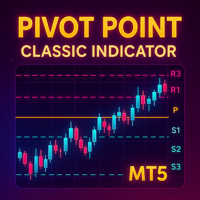
Detailed Description: The Pivot Point Classic Indicator is designed for traders who rely on classic pivot points and midpoints levels for their trading strategies. By automatically calculating and plotting these levels, the indicator provides a clear, visual representation of critical price areas where the market may reverse or break out. Key Features: Automatic Pivot Point Calculations : Automatically calculates pivot points, three support (S1, S2, S3) and resistance (R1, R2, R3) levels bas
FREE

The Heikin Ashi indicator is our version of the Heikin Ashi chart. Unlike competitor products, this indicator offers extensive options for calculating Heikin Ashi candles. In addition, it can be displayed as a classic or smoothed version.
The indicator can calculate Heikin Ashi with moving average by four methods: SMA - Simple Moving Average SMMA - Smoothed Moving Average EMA - Exponential Moving Average LWMA - Linear Weighted Moving Average
Main features The indicator shows Heikin As
FREE
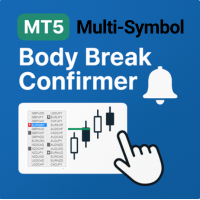
The Body Break Confirmer tracks price breakouts based on previous candle body breaks on H1 and higher timeframes — each activated separately on the chosen symbol, direction and timeframe with just one button click. This tool works perfectly for confirming market reversals in any reversal strategy. U se the tool either on a single symbol with only two buttons on the chart, or in multi-symbol mode with a convenient tracking panel to monitor all active alerts. Unlike standard reversal indicators,
FREE

MT5 için Chart Symbol Changer , panelindeki bir sembol düğmesini tıklatarak ekli mevcut grafik sembolünü değiştirme seçeneği sunan bir gösterge/yardımcı programdır. MT5 için Grafik Sembol Değiştirici , gözünüz üzerinde olsun ve en çok alım satım yapmak istediğiniz çiftleri ekleyerek 32 sembol düğmesini kişisel tercihinize göre yapılandırma seçeneği sunar. Bu şekilde hiçbir fırsatı kaçırmazsınız çünkü sadece birkaç tıklamayla grafiğinizdeki piyasayı daha hızlı görebilirsiniz.
MT5 Kurulum/Ku
FREE

Custom Spread Indicator *Please write a review, thanks!
Also MT4 version is available
Spread Indicator show the current spread in pips with color codes. Handle 3 levels, Low, Medium, High. You can set levels and colors for each level (eg. Low: Green, Medium: Orange, High: Red), and can choose display position on the chart.
There is two spread calculation mode: -> Server spread value -> Ask - Bid value
Can set opacity, for better customization. When spread jump bigger, then display do not
FREE

Do you love VWAP? So you will love the VWAP Cloud . What is it? Is your very well known VWAP indicator plus 3-levels of Standard Deviation plotted on your chart and totally configurable by you. This way you can have real Price Support and Resistance levels. To read more about this just search the web for "VWAP Bands" "VWAP and Standard Deviation".
SETTINGS VWAP Timeframe: Hourly, Daily, Weekly or Monthly. VWAP calculation Type. The classical calculation is Typical: (H+L+C)/3 Averaging Period to
FREE

The Hull Moving Average is not very well know in novice and maybe in intermediate trading circles, but it is a very nice solution created by the trader Alan Hull - please visit www.AlanHull.com for full details of his creation. The purpose of this moving average is to solve both problems that all famouse and common moving averages have: Lag and Choppiness . The implementation we did has, apart of the Period configuration and Price type to use in the calculations, a "velocity" factor, which could
FREE

Bu çok basit bir göstergedir ve herkes için kullanımı kolaydır. Ancak çok görsel, kullanışlı ve etkili. Her Forex sembolü ve herhangi bir zaman dilimi için uygundur. Ancak test ve incelemelerime göre, M1, M5, M15 zaman çerçeveleriyle kullanılmasını önermiyorum. Ayar. - Uyarı Açık/Kapalı'yı seçin (varsayılan AÇIK). - 2 uyarı arasındaki süreyi (saniye) seçin. Varsayılan 30 saniyedir
Nasıl çalışır?
- Yükseliş—Çubuğun rengi Yeşil olduğunda. - Düşüş Trendi—Çubuğun rengi Turuncu olduğunda. - Çubuğu
FREE

This is an indicator for Quasimodo or Over and Under pattern. It automatically finds the swing points and can even place virtual trades with stop loss and take profit. Press the "Optimize" button to automatically find the most effective settings. The pattern consists of four legs A,B,C,D as shown in the pictures. Open and close prices of the virtual trades are Bid price but the statistics in Display Panel take current spread into account. Its parameters are explained below. Buffer - Pips dista
FREE

This indicator is converted from UT Bot alerts indicator by @QuantNomad of Trading View to MT5. its considering ATR and creating new candles on chart and also is giving good entry points based on its candles. all buffers of new candles and also entry signals are included as buffer so can be used easily on any EA. there are also some different strategies on the internet that can be used or contact me to create it for you.

Are you tired of drawing Support & Resistance levels for your Quotes? Are you learning how to spot Support & Resistances? No matter what is your case, Auto Support & Resistances will draw those levels for you! AND, it can draw them from other timeframes, right into you current chart, no matter what timeframe you are using... You can also Agglutinate regions/zones that are too much closer to each other and turning them into one single Support & Resistance Level. All configurable.
SETTINGS
Timefr
FREE

Golden Spikes Detector Acknowledgement and Dedications: The name of this indicator was Inspired by an Original; Mr Grant Koopman; a Knowledgeable and experienced Synthetics trader. I dedicate this indicator to Mr Grant. Overview: The Golden Spikes Premium is a groundbreaking trading indicator meticulously crafted for the Boom and Crash indices on the Deriv market. Tailored to meet the needs of discerning traders, this powerful tool operates exclusively on the one-minute timeframe, providing
Tired of drawing opening range breakout line? Maximize your trading potential with the Range Breakout Indicator and the Opening Range Breakout (ORB) Indicator for MT5, two essential tools designed to enhance your trading strategy and boost your market performance. These powerful indicators allow you to profit from the explosive price movements that often occur at the opening of major stock indices, such as the DAX, DOW, NASDAQ, and S&P500. By leveraging the Opening Range Breakout Indicator, you

Fractals Dynamic Fractals Dynamic – sol ve sağdaki çubukların sayısını manuel olarak ayarlayabileceğiniz ve böylece grafikte benzersiz desenler oluşturabileceğiniz, Bill Williams tarafından değiştirilmiş bir serbest fraktal göstergedir. Artık Fraktallar Dinamik göstergesine dayanan veya temelinde bulunan tüm ticaret stratejilerinin ek bir sinyali olacaktır.
Ek olarak, fraktallar destek ve direnç seviyeleri olarak hareket edebilir. Ve bazı ticaret stratejilerinde likidite seviyelerini göster
FREE

Necessary for traders: tools and indicators Waves automatically calculate indicators, channel trend trading Perfect trend-wave automatic calculation channel calculation , MT4 Perfect trend-wave automatic calculation channel calculation , MT5 Local Trading copying Easy And Fast Copy , MT4 Easy And Fast Copy , MT5 Local Trading copying For DEMO Easy And Fast Copy , MT4 DEMO Easy And Fast Copy , MT5 DEMO Advanced Bollinger Bands:
1. The Bollinger rail will change color with the direction"
2. The
FREE

SUPER TREND; Olivier Seban tarafından oluşturulan Supertrend ATR ‘ye dayanan ve trendi takip eden bir göstergedir. Trend yönündeki değişiklikleri tespit etmek ve durakları konumlandırmak için kullanılabilir. Fiyat gösterge eğrisinin altına düştüğünde kırmızıya döner ve bir düşüş trendine işaret eder. Tersine, fiyat eğrinin üzerine çıktığında, gösterge yeşile döner ve bir yükseliş trendine işaret eder. Diğer göstergeler gibi, Supertrend ’de, MACD, parabolik SAR, Bollinger Band veya RSI gibi diğer
FREE
Level Box Tool is a powerful and user-friendly custom indicator designed for traders who utilize technical analysis tools like rectangles and trend lines to identify key support, resistance, and price zones. This tool simplifies and speeds up the process of marking chart levels, offering both visual clarity and precision with its fully customizable panel, and now includes price-cross alerts — so you’ll never miss a key level again. MT4 Version - https://www.mql5.com/en/market/product/136009/ Jo
FREE

This indicator identifies and displays zones, as it were areas of strength, where the price will unfold. The indicator can work on any chart, any instrument, at any timeframe. The indicator has two modes. The indicator is equipped with a control panel with buttons for convenience and split into two modes. Manual mode: To work with manual mode, you need to press the NEW button, a segment will appear. This segment is stretched over the movement and the LVL button is pressed. The level is displayed

Note from Developer:
This is the lite version of the Double TMA with Bands Indicator.
I will be uploading a paid version that comes with alerts and on screen signal arrows built in.
I will also be selling an EA based on this trading system once all backtesting and optimization have been completed.
Unlock your trading potential with the Double TMA Indicator with Reversal Detection!
Designed for swing and reversal trading, this versatile tool integrates two Triangular Moving Averages (TMA) f
FREE

Volume Profile Indicator – User Guide Description: The Volume Profile Indicator is a powerful tool designed for MetaTrader 5. It visualizes market activity using volume distribution across price levels, showing: Histogram of volume at each price bin POC (Point of Control) – the price with the highest traded volume Value Area – the range covering a configurable percentage of volume (e.g. 70%) Support levels: Min, Max, and Pivot Average tick size for BUY and SELL movements Inputs and Parameters:
FREE

Improved Fair Value Gap Void MT5
The Improved Fair Value Gap (iFVG + Void) indicator for MetaTrader 5 is an advanced iteration of the traditional Fair Value Gap "FVG" indicator. Fair Value Gaps emerge following sharp price movements, marking crucial zones where supply and demand are unbalanced. Price action often gravitates back to these levels. This indicator visually marks bullish Fair Value Gaps (FVG) with green boxes and bearish Fair Value Gaps with red boxes. Additionally, it shades the us
FREE

What is the Volume Weighted Average Price (VWAP)? The volume weighted average price (VWAP) is a trading benchmark used by traders that gives the average price an instrument has traded at throughout the day, based on both volume and price. It is important because it provides traders with insight into both the trend and value of the instrument.
What is the Difference between VWAP and AVWAP? While VWAP is having as starting point the beggining of the day,week,month etc. in the AVWAP you can pla

PREDATOR AURORA Ticaret Sistemi ile piyasanın gerçek gizli kalıplarını keşfedin — hibrit ticaret göstergelerinin son patronu. Başkalarının göremediğini görün! PREDATOR AURORA Ticaret Sistemi, sıradanlığın gölgesinde saklanmayı reddedenler için tasarlanmış bir güç merkezidir. Bu sadece başka bir gösterge değil; bu bir hile kodu; bu sizin haksız avantajınızdır, piyasa hareketlerini öldürücü bir hassasiyetle takip eden sofistike bir hibrit avlanma sistemidir. Sadece en güçlülerin hayatta kaldığı

The MACD 2 Line Indicator is a powerful, upgraded version of the classic Moving Average Convergence Divergence (MACD) indicator.
This tool is the embodiment of versatility and functionality, capable of delivering comprehensive market insights to both beginner and advanced traders. The MACD 2 Line Indicator for MQL4 offers a dynamic perspective of market momentum and direction, through clear, visually compelling charts and real-time analysis.
Metatrader4 Version | How-to Install Product | How-t
FREE

This indicator can be used to display Support and Resistance levels according to the Malaysian SNR concept , in which Support and Resistance are exact levels of a line chart. Malaysian SNR
There are 3 different horizontal levels in Malaysian SNR: A-Level : This level is located at the peak of this line chart. (shape looks like the letter A) V-Level : Level at the valley of a line chart, (shape looks like the letter V) Gap-Leve l: This level is located at the Close/Open gap between two candle

本指标 基于 Zigzag 基础上... 增加了: 1.增加了箭头指示,使图表更鲜明 2.增加了价格显示,使大家更清楚的看清价格. 3.增加了报警等设置,可以支持邮件发送 原指标特性: 1.基本的波段指标构型. 2.最近的2个ZIGZAG点不具有稳定性,随着行情而改变,(就是网友所说的未来函数) 3.原指标适合分析历史拐点,波段特性,对于价格波动有一定的指导性.
Zigzag的使用方法一 丈量一段行情的起点和终点 (1)用ZigZag标注的折点作为起点和终点之后,行情的走势方向就被确立了(空头趋势); (2)根据道氏理论的逻辑,行情会按照波峰浪谷的锯齿形运行,行情确立之后会走回撤行情,回撤的过程中ZigZag会再次形成折点,就是回撤点; (3)在回撤点选择机会进场,等待行情再次启动,止损可以放到回撤的高点。 一套交易系统基本的框架就建立起来了。 Zigzag的使用方法二 作为画趋势线的连接点 趋势线是很常见的技术指标,在技术分析中被广泛地使用。 但一直以来趋势线在实战中都存在一个BUG,那就是难以保证划线的一致性。 在图表上有很多的高低点,到底该连接哪一个呢?不同的书上画趋势线的方法
FREE
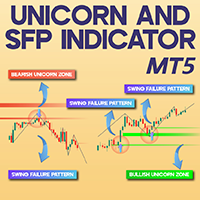
Unicorn + SFP Indicator MT5 The Unicorn + SFP Indicator is crafted to detect Unicorn Zones and identify the Swing Failure Pattern (SFP) . Unicorn Zones emerge when Breaker Blocks overlap with Fair Value Gaps (FVGs) , creating areas recognized for potential price reversals within the ICT trading methodology . This tool pinpoints false breakouts , commonly referred to as SFP , and marks them with small arrows when detected. Features of the Unicorn + SFP Indicator The table below outlines key detai
FREE

MT4 version Overview The Lowess Channel indicator is a smoothed trend-following tool designed to help traders identify the direction of the trend , detect flat or ranging markets , and spot breakouts from consolidation zones. It creates a central smoothed line with upper and lower channel boundaries, adapting to market noise while maintaining clarity. How It Works The indicator builds a channel around a smoothed price line. The central line reflects the current trend. The upper and lower bounda
FREE

The ICT Asya Aralık Göstergesi tüccarların ICT Asya Aralık Ticaret Stratejisi'ne göre temel piyasa yapılarını ve likidite bölgelerini belirlemelerine yardımcı olmak için tasarlanmış güçlü bir araçtır. Asya seansının en yüksek ve en düşük fiyat seviyelerini (New York saatiyle 19:00'dan gece yarısına kadar) işaretler ve sonraki ticaret seansları için piyasa hareketlerine dair kritik içgörüler sağlar. Bu gösterge, likidite taramalarını ve Adil Değer Boşluklarını (FVG'ler) vurgulayarak t

Candle Range Theory - CRT
Mark Candle Range Theory - CRT bars on the chart.
Options:
choose between 2 bar CRT or CRT that include inside bars Show higher time frame CRT on lower time frame chart show current time frame CRT on chart with higher time frame CRT Alert when new CRT has formed Show / Hide Labels
Button Menu to select Options
for more information on using Candle Range Theory - CRT look on X for @Romeotpt
@SpeculatorFL
Manual
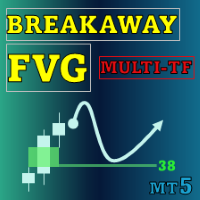
Special offer : ALL TOOLS , just $35 each! New tools will be $30 for the first week or the first 3 purchases ! Trading Tools Channel on MQL5 : Join my MQL5 channel to update the latest news from me Breakaway Fair Value Gaps (FVG) aracı, fiyatın dengeden uzaklaştığı alanları tanımlamak için tasarlanmış, tüccarlara derinlemesine içgörüler sağlayan son teknoloji bir çözümdür. Bu araç yalnızca kritik sinyalleri vurgulamakla kalmaz, aynı zamanda karar verme doğruluğunu artırmak için gel

Do you want to know how an economic event will impact price? What will happen to price after the news? How has an economic news affected price in the past? This indicator can help you with that.
Do you like technical analysis? Do you enjoy studying the tick history to predict the future? But what do you think could be more important than technical analysis, what could improve technical analysis? Of course, it's fundamental analysis! After all, economic events directly impact the market, and th
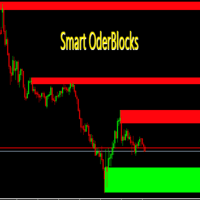
Smart OrderBlocks Indicator for MetaTrader 5 A Differentiated Vision and a Bit of Price Action! Smart OrderBlocks is an advanced indicator that reveals market structure from a unique perspective through intelligent supply and demand zone detection. Key Features OrderBlocks Detection Internal OrderBlocks : Capture micro-level market dynamics Swing OrderBlocks : Identify macro market momentum trends Advanced Volatility Intelligence Volatility detection using: Adaptive Average True Range (AT
FREE

The Pivot Point indicator automatically calculates and displays the pivot point line and support and resistance levels. Pivot can be calculated according to the Classic, Floor, Fibonacci, Woodie, Camarilla or DeMark formula. It is also possible to select the period for calculating the indicator. A trader can choose from daily, weekly, monthly, or user-defined periods.
Types of pivots Classic Floor Fibonacci Woodie Camarilla DeMark
Main features The indicator shows the current and historic
FREE

Gold Pointer en iyi trend göstergesidir. Göstergenin benzersiz algoritması, teknik ve matematiksel analiz faktörlerini dikkate alarak varlık fiyatının hareketini analiz eder, en karlı giriş noktalarını belirler ve bir AL veya SAT emri açmak için bir sinyal verir.
En iyi gösterge sinyalleri:
- SAT için = kırmızı trend çizgisi + kırmızı TF göstergesi + aynı yönde sarı sinyal oku. - AL için = mavi trend çizgisi + mavi TF göstergesi + aynı yönde aqua sinyal oku.
Göstergenin avantajları:
1. Gös
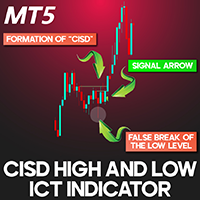
CISD - CSD + High & Low ICT Indicator in MetaTrader 5 The CISD – CSD + High and Low Indicator is a powerful tool that plots key High and Low-price levels while highlighting CISD formations on the chart. Designed based on the ICT trading strategy , this MT5 indicator helps identify false breakouts at major price levels and marks CISD occurrences with arrows to signal trade opportunities. CISD + High/Low Indicator Features Below is a breakdown of the CISD - CSD + High and Low Indicator specifica
FREE

Mucize umarak bu sistemi indirmenizi istemiyorum. Bu araç ne kadar iyi tasarlanmış olursa olsun, operasyonlarınızda gerçek bir dönüşümün parçası olmayı amaçlıyor. Sunduğu imkânları en iyi şekilde değerlendirin, analizler yapın, kendinizi profesyonel olarak geliştirin, büyük bir oyuncu gibi düşünün.
Bilgi güvenliğinde kaba kuvvet saldırısı, parolaları, oturum açma kimlik bilgilerini veya kriptografik anahtarları keşfetmek için sistematik bir deneme yanılma yönteminden oluşur. Bu yaklaşımdan ilh
FREE

Engulfing Candle Detector
Detectable pattern Double Candlestick Patterns Bullish Engulfing
The first candle is black candle. The second candle opens with a gap below the real body of the black candle but rallies upwards to close above the real body of the black candle. In other words, the second candle's real body completely engulfs the first candle's real body Bearish Engulfing
The first candle is white candle. The second candle opens with a gap above the real body of the white candle but dec
FREE

AtBot: Come funziona e come usarlo ### Come funziona L'indicatore "AtBot" per la piattaforma MT5 genera segnali di acquisto e vendita utilizzando una combinazione di strumenti di analisi tecnica. Integra la Media Mobile Semplice (SMA), la Media Mobile Esponenziale (EMA) e l'indice di Gamma Vero Medio (ATR) per identificare opportunità di trading. Inoltre, può utilizzare le candele Heikin Ashi per migliorare la precisione dei segnali. Lascia una recensione dopo l'acquisto e ricevi un regalo bonu

Introduction to Support Resistance Risk Management Support Resistance is the most trusted technical analysis. However, the risk management for the support and resistance is not practiced often. Hence we provide one effective risk managment method for the support and resistance trader. In the book: Scientific Guide To Price Action and Pattern Trading (Wisdom of Trend, Cycle, and Fractal Wave), how to use Support Resistance is described as well as Fibonacci Analysis, Harmonic Pattern, Elliott Wave
MetaTrader mağazasının neden alım-satım stratejileri ve teknik göstergeler satmak için en iyi platform olduğunu biliyor musunuz? Reklam veya yazılım korumasına gerek yok, ödeme sorunları yok. Her şey MetaTrader mağazasında sağlanmaktadır.
Alım-satım fırsatlarını kaçırıyorsunuz:
- Ücretsiz alım-satım uygulamaları
- İşlem kopyalama için 8.000'den fazla sinyal
- Finansal piyasaları keşfetmek için ekonomik haberler
Kayıt
Giriş yap
Gizlilik ve Veri Koruma Politikasını ve MQL5.com Kullanım Şartlarını kabul edersiniz
Hesabınız yoksa, lütfen kaydolun
MQL5.com web sitesine giriş yapmak için çerezlerin kullanımına izin vermelisiniz.
Lütfen tarayıcınızda gerekli ayarı etkinleştirin, aksi takdirde giriş yapamazsınız.