YouTube'dan Mağaza ile ilgili eğitici videoları izleyin
Bir alım-satım robotu veya gösterge nasıl satın alınır?
Uzman Danışmanınızı
sanal sunucuda çalıştırın
sanal sunucuda çalıştırın
Satın almadan önce göstergeyi/alım-satım robotunu test edin
Mağazada kazanç sağlamak ister misiniz?
Satış için bir ürün nasıl sunulur?
MetaTrader 5 için yeni teknik göstergeler - 33

Gösterge, bir miktar düzeltmeden sonra aynı anda trendi takip eden bir ticarete girmeye yardımcı olur. Belirli sayıda çubuk üzerinde bir döviz çiftinin güçlü trend hareketlerini bulur ve ayrıca bu trend için düzeltme seviyeleri bulur. Eğilim yeterince güçlüyse ve düzeltme parametrelerde belirtilene eşitse, gösterge bunu bildirir. Farklı düzeltme değerleri ayarlayabilirsiniz, 38, 50 ve 62 (Fibonacci seviyeleri) değerleri daha uygundur. Ayrıca minimum trend uzunluğunu, aranacak çubuk geçmişi sayı

BeST Swing Strategy MT5 is a Metatrader indicator based on the corresponding Jim Berg's work about volatility as described in his article "The Truth About Volatitlity" (TASC 2/2005).The indicator consists of 2 channel lines deriving as (MA+/- times the ATR) and can be used as a standalone trading system.The outlier prices of the Market as of the indicator's values can be used for producing Entry and Exit Signals.
Advantages of the indicator
== Uses 2 Swing Strategies
== Never repaints it

Indicator that show candlestick bars with an different sampling method than time fixed. Real time data is sourced to the indicator and it may be used as substitute of the default graph. Each bar is formed when a predefined amount of ticks is received, showing in the graph the OHLC of this clusteri of ticks. The input variable is the amount of ticks of each bar. It's a different approach of sampling, the amount of bars is proportional to the amount of negotiations insted of a sample in a fixed am
FREE

The M Extensions are variations of the Golden Ratio (Fibonacci Sequence). It is the World's first technique developed for Candle Projections.
Advantages:
Easy to plot. Candle anchoring; High and accurate precision as support and resistance; Excellent Risk x Return ratio; Works in any timeframe; Works in any asset / market. The M Extensions are classified into:
M0: Zero point (starting candle) RC: Initial candle control region M1: Extension region 1 M2: Extension region 2 M3: Extension r
FREE

When trading price action or using price action triggers such as Pbars, Inside Bars, Shaved Bars, etc. it is important to always wait for the bar/candle to close more than anything else.It is often the case (whether it’s the 4H, hourly, etc) that price action will be dominant in one direction for the majority of the candle only to reverse strongly at the end of the candle. Institutional traders know retail traders are less disciplined than they are. They know a good trading candle pattern coul
FREE

Investment Castle News Indicator will plot vertical lines before the news on the chart and categorized in three different colors in accordance with the news importance. You can choose to limit the news to the current chosen symbol or show all future news on the same chart. High impact news is marked in Red lines be default. Medium impact news is marked in Orange lines be default. Low impact news is marked in Yellow lines be default.
FREE

This simple, yet powerful indicator is very good way to determine actual S/R levels. It's main purpose is making your overview on markets much better.It has built-in arrow signal system, which should be used along with MT indicators for best results.Just try it.
Recommended MT indicators to use along:
Bollinger Bands (default) RSI (period 3, levels 10/90)

Hello Traders
I have created this indicator to Catch SPIKES on Crash1000, Crash500 and Crash300. Follow the below mention instruction for better Result
1. When Red arrow pop up on the Chart, Take a Sell entry
2. Stay in trade until price break below from entry
3. Do not hold trades after all trades went in Blue
4. Keep adding position until spike cross below from intial entry
See Example for more assistance
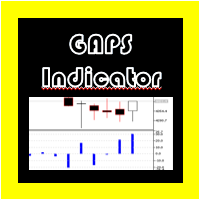
GAPS göstergesi Metatrader 5
Endekslerde, hisse senetlerinde ve diğer varlıklarda kullanılan stratejilerden bazıları için genellikle her bir mum çubuğunun GAP'ı ölçülür, ancak bunu manuel olarak yapmak istersek bu, hesaplama hataları yapmamıza neden olabilir.
Bu nedenle, mumların her biri arasında sunulan GAPS'lerin her birinin PIPS değerini otomatik olarak gösteren ve seçenek etkinleştirildiğinde ortaya çıktıklarında bir alarm oluşturan "GAP Göstergesi" oluşturulmuştur.

(Otomatik çeviri) Çoğu yatırımcı, 1700'lü yıllarda Munehisa Homma tarafından oluşturulan ünlü Japon Heikin-Ashi göstergesinin farkındadır. Bazen Heiken-Ashi olarak yazılır, ancak anlamı aynı kalır, yani Japonca'da "ortalama çubuk". Bu, çok iyi bilinen Heikin Ashi göstergesinin bir uygulamasıdır, ancak birkaç ek özellik eklenmiştir. Birincisi, ister tıklama sayımı hacmi , ister gerçek hacim , ister gerçek aralığa dayalı sözde hacim olsun, değerlerinin hacim ile ağırlıklandırılmasına olanak tanır.

MT4 Version MA Ribbon MT5 MA Ribbon is an enhanced indicator with 8 moving averages of increasing periods. MA Ribbon is useful to recognize trend direction, reversals and continuation points in the market as well as potential entry, partial take profit and exit points. Entry points for long and shorts position can be found when the price entries or leaves the Ribbon, at retest or a defined number of MA crossovers. It offers a good combination with mostly any volume or momentun indicators to
FREE

MT4 Version Fibonacci Bollinger Bands MT5 Fibonacci Bollinger Bands is a highly customizable indicator that shows areas of support and resistance. This indicator combines the logic for the Bollinger Bands with the Fibonacci level. Fibonacci Bollinger Bands is the first indicator in the market that allows the user to 100% customize up to 12 Fibonacci levels, the Moving Average type and the price data source to use for the calculations. This flexibility makes the Fibonacci Bollinger Bands easily
FREE
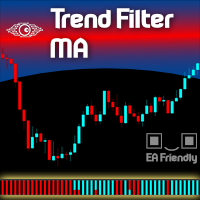
One of the best tools category for an Expert Advisor is the Filtering System . Using a filter on your entries will take your metrics to the good side. And even when you trade manually a filtering system is more than welcome. Let us present a commonly used filtering system based on Exponential Moving Averages - in fact, you can choose the type of the MAs as you wish and also mix them all up - we called this indicator Filter Trend MA . We present this indicator as a colored strip you can use at th

Indicator - HotKeys allows you to make your work in the MT5 terminal more comfortable
Indicator features: - Calling the creation of an object on the chart with keyboard shortcuts - Enable/disable auto scroll - Quick switching between main custom templates
Preset keyboard shortcuts: - Rectangle - Q - Fibo - E - Horizontal level - R - Cut - T - Auto Scroll - A
You can assign other keyboard shortcuts (capital letters of the English alphabet only)
Important: The indicator does not allow

If you like this project, leave a 5 star review. Often times we are using brokers that are outside of the GMT-0 timezone, this
not only complicates things, but, it can make seeing when a trading session starts
a bit more difficult than it should. This indicator allows you to set a timezone offset it will draw a vertical line for the: Day. Week. Month. Quarter. year.
FREE
This indicator is based on the same famous fractal indicator with a slight difference:
MetaTrader version 4 click here
Advantages:
Works on all instruments and time series,
Does not redraw its results,
Comparison depth is adjustable,
Works well with any popular strategy,
Adjust the power of fractals
Input settings:
Number of comparisons - The number of candles that each side selects for comparison.
Marker distance from the candlestick
You
This indicator is based on ParabolicSAR. This indicator does not change the trend easily and does not change the trend until it receives a clause and approval. This indicator can be used for trail stop or trend detection.
MT4 Version
benefits:
Works on all instruments and time series,
Does not redraw its results,
Comparison depth is adjustable,
Works well with any popular strategy,
The power of the areas is adjustable,
We assure you that we we

Highly configurable Force Index indicator. Features: Highly customizable alert functions (at levels, crosses, direction changes via email, push, sound, popup) Multi timeframe ability Color customization (at levels, crosses, direction changes) Linear interpolation and histogram mode options Works on strategy tester in multi timeframe mode (at weekend without ticks also) Adjustable Levels Parameters:
Force Index Timeframe: You can set the current or a higher timeframes for Force Index. Force In
FREE

Highly configurable Rate of Change (ROC) indicator. Features: Highly customizable alert functions (at levels, crosses, direction changes via email, push, sound, popup) Multi timeframe ability Color customization (at levels, crosses, direction changes) Linear interpolation and histogram mode options Works on strategy tester in multi timeframe mode (at weekend without ticks also) Adjustable Levels Parameters:
ROC Timeframe: You can set the current or a higher timeframes for ROC. ROC Bar Shift:
FREE

This is a general purpose indicator that displays colored lines at fixed and customizable price intervals, entered as parameters. It offers universal, constant, and familiar price ranges that allow quick and precise price analysis of a currency pair. With default parameters, this indicator implements The Quarters Theory , as described originally by Ilian Yotov . [ Installation Guide | Update Guide | Troubleshooting | FAQ | All Products ] Easy to use No optimization needed Customizable price inte

Indicator that shows you at any time the current number of closed deals as well as profit and loss totals of the closed deals of the account that you're logged into for a configurable period.
To do this, it is best to load Deals and "Complete history" in the account history in the terminal and then enter the desired period in the indicator (e.g. 2022.01.01-2023.01.01 would be for calendar year 2022).
Input options:
- Period (Attention: corresponding data must be loaded into the account h

Indicator basic idea is buy strong currency and sell weak currency. If A/B currency pair is in an uptrend, it shows if it is due to A strength or B weakness.On these signals one can choose the most optimal pair to trade. You can use Currency Power System for pattern trading as well, among basic patterns which can be used are: cross trend break divergencies So much for theory. I searched for a ready-made indicator (Currency Strength) to support my trade but did not find one. Well. I have to wr

This Supertrend strategy will allow you to enter a long or short from a supertrend trend change. Both ATR period and ATR multiplier are adjustable. If you check off "Change ATR Calculation Method" it will base the calculation off the S MA and give you slightly different results, which may work better depending on the asset. Be sure to enter slippage and commission into the properties to give you realistic results. If you want automatic trade with Supertrend indicator, please buy following pr
FREE

This is a multi-symbol and multi-timeframe table-based indicator designed for a candlestick patterns detection with 46 patterns for META TRADER 5. Each formation has own image for easier recognition. Here you find most popular formations such as "Engulfing", "Hammer", "Three Line Strike", "Piercing" or Doji - like candles. Check my full list of patterns on my screenshots below. Also you can not only switch all bearish or bullish patterns from input, but also select formation for a specified symb

It will perfectly complement your working Expert Advisor or manual trading with up-to-date information.
There is a sound notification of exceeding the established profit and loss limits of open SELL and BUY orders.
Moreover, for each currency pair EURUSD, GBPUSD, XAUUSD, and others, various sound alerts are activated in English.
Indicators are displayed on a special panel on the chart from the moment the indicator is activated: Elapsed time
Fixed profit
Current profit Maximum drawdown Curr

The Bridge indicator displays potential entry points on the chart as signals (points of absolute trend reversal).
The Bridge forex indicator algorithm was created on the basis of the original indicators for searching for extremes, the indicator is well suited for determining a reversal or a large sharp jerk to one side, thanks to it you will know when this happens, it will notify you with the appearance of a blue dot to buy red to sell. The indicator, according to a certain algorithm, qualifi

RSI Currencies is an indicator that is based on the RSI concept but with a totally different approach. It calculates its values calculating all RSI values of all pairs related to the same currency and making an average between them: the goal is to obtain a more solid and trustable information about what each currency are doing lowering the impact of market noise and extreme euphory on a particular pair to analyze the whole basket. It works on 28 forex majors and minor pairs related to these curr
FREE
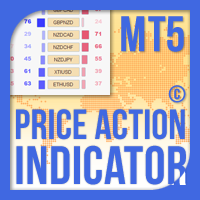
Fiyat Eylem Göstergesi MT5 , herhangi bir sembol/enstrümanın alım/satım gücü seviyesi dengesini, belirtilen (varsayılan olarak 8) geçmiş mumların saf fiyat eylemi verilerine dayanarak hesaplar. Bu, gösterge panelinde bulunan 32 sembol/aletin fiyat hareketini izleyerek size mümkün olan en yakın piyasa duyarlılığını verecektir. %60'ın üzerinde bir alım/satım gücü seviyesi, belirli bir sembolü satın almak/satmak için (varsayılan ayarları kullanarak) oldukça sağlam bir seviye sağlar. Fiyat Hareke

İşte size Deriv mt5 işlem platformunda CRASH sentetik endeksleri ile ticarette devrim yaratacak gösterge geliyor.
Tanrı Spike Crash.
Ana Özellikler:
Yalnızca CRASH endekslerinde hizmet verir. Trend filtresi vardır. Yalnızca piyasa düştüğünde uyarı gönderin. Sesli uyarılar. Cep telefonunuza uyarı gönderebilirsiniz.
Nasıl kullanılır:
m1 ve m5 zamansallıklarında uygulayın. Sesli uyarıyı bekleyin. Güçlü bir eğilim olduğunu veya halihazırda başlamış olduğunu analiz edin. Trendi

Işte size Deriv mt5 ticaret platformunda BOOM sentetik endeksleriyle ticarette devrim yaratacak gösterge geliyor.
Tanrı Spike Boom.
Ana Özellikler:
Yalnızca BOOM endekslerinde çalışır. Trend filtresi vardır. Yalnızca piyasa yükselirken uyarı gönderin. Sesli uyarılar. Cep telefonunuza uyarı gönderebilirsiniz.
Nasıl kullanılır:
m1 ve m5 zamansallıklarında uygulayın. Sesli uyarıyı bekleyin. Güçlü bir eğilim olduğunu veya halihazırda başlamış olduğunu analiz edin. Trendin sonunda

This indicator shows current major support and resistance, if one exists. And as a support or resistance is broken it shows the new current, if any. To identify support and resistance points it uses the high and low points identified on the current chart. Allows too you to inform the maximum number of bars used to consider a support or resistance point still valid.
FREE

This indicator draws the highest and the lowest prices of the previous periods on the chart. And If you want, Indicator can alert you when the current price arrives these levels. For example: If you are watching the H1 timeframe, Indicator shows you the lowest and the highest prices of H4, D1, W1 and M1 periods. So you don't need to open the other periods of chart windows. Alert Options: Send Mobil Message, Send E-mail, Show Message, Sound Alert Time Periods: M1, M5, M15, M30, H1, H2, H3, H
FREE
KF CROSS 3MA
This indicator show the collision points of moving averages in a separate window. so we will have a solitude chart. Features indicator: Show alert in Meta Trade Send notification to mobile Adjustable 3 MA (Fast-Middle-Slow) Can be used on all symbols Can be used in all time frames
Attention, the application does not work in the strategy tester
You can download the Demo version on the comments page : https://www.mql5.com/en/market/product/81152?source=Site
or cotact us : ht

Highly configurable Awesome Oscillator (AO) indicator. Features: Highly customizable alert functions (at levels, crosses, direction changes via email, push, sound, popup) Multi timeframe ability Color customization (at levels, crosses, direction changes) Linear interpolation and histogram mode options Works on strategy tester in multi timeframe mode (at weekend without ticks also) Adjustable Levels Parameters:
AO Timeframe: You can set the current or a higher timeframes for AO. AO Bar Shift:
FREE

An customize Indicator by which you can have Triple moving averages at close prices and send push notification on each crossing. This indicator is especially useful when you are doing manual trading. Notes: Cation: forex trading is a very risky business,... don't invest the money you cannot bear to lose. the probability of losing is high ... more high aaaand exponentially high.... something like EMA enjoy losing with us...

Hızla Geri Test ve Optimize Edin
Impulse Pro göstergesi, Çoklu Zaman Çerçeveleri Fibonacci Analizini tek bir grafikte çizmek için tasarlanmış güçlü bir Fibonacci göstergesidir
uyarı fonksiyonu ile
Kodlar, hem MT4 hem de MT5'te daha hızlı geriye dönük test ve optimizasyon için Optimize edilmiştir
Her iki yön de takas edilebilir veya analiz edilebilir, örn.
Al sinyali Impulse, satmaya benzer şekilde ters yönde de işlem görebilir.
Bir satış Sinyali Darbesi takas edilebilir veya ters yö

Do you know VWAP Bands? It is an indicator used to identify support and resistance points from the daily VWAP and you can use it to check the best entry and exit points. This indicator does not use the principle of bollinger bands. There is a difference in the calculation method. Use it according to your strategy. See the applications and what results you can get. The indicator is free and can be used on any account.
FREE

VWAP, or volume-weighted average price, helps traders and investors observe the average price that major traders consider the "fair price" for that move. VWAP is used by many institutions to set up large operations.
In this indicator, you can enjoy the following features:
Daily VWAP, with option to display your current price next to the chart VWAP Weekly, with option to display your current price next to the chart Monthly VWAP, with option to display your current price next to the chart
FREE

We at Minions Labs consider ATR ( Average True Range ) one of the most fantastic and most underrated indicators of Technical Analysis. Most of the traders really don't give a sh* about the True Range of the market and this probably can be because they could not apply the data right away in a practical way over their charts or over their own strategy, leaving this indicator in the land of obscurity and doubt. Well, this indicator, Bigger Than ATR , is a step forward to show you what is possible t

Highly configurable Macd indicator.
Features: Highly customizable alert functions (at levels, crosses, direction changes via email, push, sound, popup) Multi timeframe ability Color customization (at levels, crosses, direction changes) Linear interpolation and histogram mode options Works on strategy tester in multi timeframe mode (at weekend without ticks also) Adjustable Levels Parameters:
Stochastic RSI Timeframe: You can set the lower/higher timeframes for Stochastic RSI. Stochastic RSI
FREE
The Qv² Trend is an indicator that aims to identify trends.
Buying trend signals are indicated by arrows pointing up.
Selling trend signals are indicated by arrows pointing down.
It can be used in all deadlines.
It can be used in all pairs.
I use it on the H1 with a period of 24. Important Recommendation: Make sure you trade in trend market. Good Trades, in trend market

Info: marcobarbosabots
Pivot lines are an easy way to see market trend. The indicator provides the pivot line and three first support and Resistance lines.
Calculations used was:
Resistance 3 = High + 2*(Pivot - Low) Resistance 2 = Pivot + (R1 - S1) Resistance 1 = 2 * Pivot - Low Pivot point = ( High + Close + Low )/3 Suport 1 = 2 * Pivot - High Suport 2 = Pivot - (R1 - S1) Suport 3 = Low - 2*(High - Pivot)
You can use the calculated values on an EA too, just make sure the indicator

Bu projeyi seviyorsanız, 5 yıldız incelemesi bırakın. instagram'da izleyin: borelatech Kurumsal ticaret büyük hacimler olarak, onlar için nadir değildir
pozisyonlarını belirli oran seviyelerinde savunur. Bu seviyeler, kullanabileceğiniz doğal bir destek ve direniş olarak hizmet
edecektir
Ya bir ticarete girmek ya da pozisyonunuza karşı olası tehlikelerin farkında
olmak. Bu osilatör size yüzde varyasyonu gösterecektir: Gün. Hafta. Ay. Mahallesi. Yıl. Destek ve direnişlerinizi takip ettiğini
FREE

Developed by Chuck LeBeau, the Chandelier Exit indicator uses the highest high / lowest low -/+ a multiple of the ATR value to draw trailing stop lines (orange under buys, magenta over sells) that advance with the trend until the trend changes direction.The value of this trailing stop is that it rapidly moves upward in response to the market action. LeBeau chose the chandelier name because "just as a chandelier hangs down from the ceiling of a room, the chandelier exit hangs down from the high
FREE
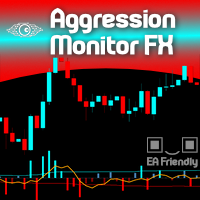
Would you like to monitor the aggression between Buyers and Sellers, minute by minute? Now you can! Welcome to the Aggression Monitor FX ! The Aggression Monitor FX indicator was developed for those markets that do not provide REAL data Volume, i.e. like the Forex market. We developed a way to use 1-minute Tick Volume data generated by Forex (and other) Brokers and manipulate it into "aggression" information in a very visual histogram with additional analysis lines. And it worked! (but hey! you

Created by trader and journalist Larry Williams, Setup 9.1 is a simple strategy that is easy to understand and execute, which is why it is so well known and popular in the world of traders and technical analysis. It is a REVERSION setup, where operations are sought when the moving average changes direction.
Setup Logic
With the open candlestick chart, at any time chart, it is only necessary to add the 9-period Exponential Moving Average (MME9). That done, we look for assets in which the MME
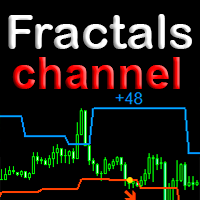
Trend indicator with a unique algorithm for detecting trend reversals. It uses Price Action and its own filtering algorithm to determine the trend. The algorithm is based on a price channel based on chart fractals. This approach helps to accurately determine the entry points and the current trend on any timeframe. Recognize a new emerging trend with fewer false positives without delay. Peculiarities
The advantage of the indicator is that its period is dynamic. Since it is tied not to the number

The Candle High Low Exit indicator uses the highest high and the lowest low of a range to draw trailing stop lines (orange under buys, magenta over sells) that advance with the trend until the trend changes direction. Moreover, the trailing stop lines are generated to support the order’s trend direction (long or short): In an upward trend, the long trailing stop line (orange line under buy) appears and advances upward until the close crosses under the line.
In a downward trend, the short tra
FREE

ContiStat restricted - Free DEMO version of the ContiStat indicator
Free version of the indicator is ment as DEMO of full paid version. Full functionality is available, however The indicator work only on M30 chart period . Find the ContiStat indicator for full functionality
Brief description The ContiStat indicator calculate statistic frequency of green (up) and red (down) movement in the chart and determine movement dynamics (silver curve). There are two key parameters to understand the Conti
FREE

Индикатор "Tiger" показывает развороты рынка. Основан на индексе относительной бодрости (RVI).
Представлен в виде осциллятора, который показывает энергию текущего ценового движения и отражает уверенность ценового движения от цены открытия к цене закрытия в диапазоне максимальных и минимальных цен за данный период. Это, в свою очередь, даёт трейдеру возможность находить точки разворота с большой вероятностью.
Не перерисовывает!
Хорошо показывает себя на боковом движении рынка, которое п

Brief description The ContiStat indicator calculate statistic frequency of green (up) and red (down) movement in the chart and determine movement dynamics (silver curve). There are two key parameters to understand the ContiStat principle: Block height and Block count . The ContiStat engine convert instrument price chart move to Blocks of constant height (price) regardles of how much time it take. Example 1: Block height is set to 50. DE30 index price make move from 15230 to 15443 in an hour. 4 g

Bu projeyi seviyorsanız, 5 yıldız incelemesi bırakın. instagram'da izleyin: borelatech Kurumsal ticaret büyük hacimler olarak, onlar için nadir değildir
pozisyonlarını belirli oran seviyelerinde savunur. Bu seviyeler, kullanabileceğiniz doğal bir destek ve direniş olarak hizmet
edecektir
Ya bir ticarete girmek ya da pozisyonunuza karşı olası tehlikelerin farkında
olmak. Yaygın kullanılan bir yüzdesin bir örneği, EURUSD'da% 0.5 ve% 0.5'dir
hafta, bu örneği ekran görüntüleri üzerinde görebi
FREE

Cumulative delta indicator As most traders believe, the price moves under the pressure of market buying or selling. When someone redeems an offer standing in the cup, the deal is a "buy". If someone pours into the bid standing in the cup - the deal goes with the direction of "sale". The delta is the difference between purchases and sales. A cumulative delta - the difference between the cumulative sum of purchases and sales for a certain period of time. It allows you to see who is currently contr

This indicator demonstrates the probable dynamic support and resistance levels of EMA, Ichimoku lines, and Key OHLC levels for different timeframes on one chart. This can drastically reduce the time and effort needed for switching between different timeframes.
EMA and Ichimoku Levels are drawn for the M1, M5, M15, M30, H1, H4, and D1 timeframes, and the Key OHLC levels of the last periods are drawn for the H4, D1, W1, and MN1 timeframes.
FREE
Unlike a standard moving average, trendy traders unique algorithm will show you a less choppy signal resulting in a smoother and easier trend to follow thereby making your trading decisions more confident. Put simply when price moves above the average it signals a bullish trend and when price moves below the average it signals a bearish trend. The trader is then given 2 levels of take profit and a stop loss on each new signal. It can also be added to other trend-following systems for better pe

the indicator will show signal arrows on the graph at the crossing of Awesome Oscillator base level it has push and audible alerts and Email alert. By crossing above base level , a blue arrow will come out for the BUY, at the same time an audible signal will sound. By crossing Below base level, a red arrow will come out for the SELL, at the same time an audible signal will sound. Possibility to deactivate push and audible alerts.
MT4 version : Buy the 'Awesome cross' Technical Indicator for

The Investment Castle Chances indicator will show signals on the chart for entering a buy or sell trade. There are 2 types of signals for each direction as follows: Buy / Sell (Orange colored candlesticks) Strong Buy (Green colored candlesticks) / Strong Sell (Red colored candlesticks) You may place a buy trade once you see the Buy arrow or vise versa, or you might prefer to wait for a further confirmation “Strong Buy” / “Strong Sell”. This indicator works best with the high time frames H1,
FREE

'Circle Rising Point' is an indicator based on the cycle theory. No matter whether your trading cycle is short or long, you can use this indicator to find the rise and fall points of different cycles and different bands. Therefore, the signals displayed to you on charts of different cycles are different, and applicable to left side transactions. This indicator is recommended to be used together with the multi cycle window for analysis. Indicator introduction Applicable products This indicator is
FREE
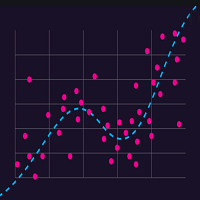
The Regression Channel consists of two lines equidistant above and below the regression trend line. The distance between the channel boundaries and the regression line is equal to the deviation of the maximum closing price from the regression line, only this definition corresponds to the most recent regression points.
The term regression refers to the field of statistics. The center line of the channel is the trend line. To calculate it, the method of least squares is used. The line above the

The utility helps to locate in the lower time frames the maximum and minimum of the upper time frame. The length of time frame level line represents the temporal length of the upper time frame. It's possible to OnOff the levels with a button or keys
The indicator draws lines that delimit the upper time frames candle and highlights his high-low price and the pips candle range. How it works:
Firstly . Choose which time frames levels to represent in the lower ones : monthly, weekly, da
The Traders Dynamic Index indicator is the only technical indicator you need to scalp the market successfully. The TDI is the only technical indicator that can read the market sentiment, market volatility, and momentum at the same time. The advantage of combining the qualities of several indicators into one indicator is that it can be the “holy grail” you are looking for. Let’s break down the Traders Dynamic Index indicator and go through it a little bit. As you can see, this scalping indicator

Fiyat kanalı, mevcut piyasa durumunu analiz etmek için bir tüccarın ana aracıdır. Onun yardımı ile gelecekteki fiyat davranışını başarılı bir şekilde tahmin edebilirsiniz, ancak kar elde etmedeki ana faktör zamanında kararlar. Bu genellikle bir sorundur, çünkü sürekli olarak monitöre bakmak imkansızdır. Bu gösterge, farklı periyotlarla (hızlı ve yavaş) iki trend kanalını otomatik olarak oluşturur ve günceller. Eğilim, doğrusal regresyon kullanılarak belirlenir. Kendiniz oluşturabileceğiniz 1 öze

Bu gösterge, mevcut zaman diliminde daha yüksek zaman diliminin bir projeksiyonunu oluşturur. Renkli mumlar şeklinde görselleştirme. Pazardaki süreçleri, ölçeğini ve dinamiklerini daha iyi anlamaya yardımcı olur. Tüm bunlar bir ilham kaynağı olabilir ve başarılı bir ticaret stratejisi bulmanın doğru yolunu gösterebilir. Gösterge, şamdan desenlerini aramayı basitleştirir. Birkaç göstergeyi farklı parametrelerle etkinleştirmek ve aynı anda birçok zaman dilimini görmek mümkündür. Ayarlarda mumları

Çünkü stil önemlidir
Mumun rengini, arka planı açık veya koyu olarak değiştirmek ve ızgarayı koymak veya kaldırmak için her seferinde özelliklere tıklamanın ne kadar can sıkıcı olduğunu biliyorum. İşte tek tıklamayla çözüm: Tüccarların istediği mum stilini seçmek için üç özelleştirilebilir düğme. Gündüz ve Gece modu arasında geçiş yapmak için bir düğme. Grafiklerde Izgarayı göstermek veya gizlemek için bir düğme. *****Ayarlarda, düğmelerin ekranda nerede görüntüleneceğini seçebilirsiniz*****
FREE

Hello, This indicator is a unique high reliability 7-in-1 multicurrency indicator comprising these sub-indicator’s: A Trend Power Crossover Indicator. A Percent Change Crossover Indicator. A Currency Overbought/Oversold Indicator. A Currency Deviation Indicator. A Currency Impulse Signal Indicator. A Trend Power Indicator. A Currency Volatility Indicator. The main advantage of this indicator is that it's reasoning by currency and not by currency pair. The values of each sub-indicator are calcula
FREE

We at Minions Labs love to study, challenge and discover new facts about Price Behavior in current markets. We would NOT call it Price Action because today this is a word totally overused and means, thanks to the False Prophets out there, absolutely NOTHING.
The study hypothesis we propose is this: Some Assets, in certain Timeframes, present a behavior of Price continuity when the candlesticks close without a Wick on them... So the purpose of this indicator is to "color" those candlesticks wh
FREE

The Pirates MACD is a Momentum Indicator that shows us not just the Classical MACD, it also shows us high priority trades. the user has an option of selecting among several options the best settings that suits their trading style, even if one has no trading style, Pirates always find a way to survive hence the Pirates MACD is equipped with easy to understand tools. that reduce the strain on ones analysis giving them visual advantages over classical MACD techniques.
This product is made as an
FREE

1. What is this Rising volatility and falling volatility are not the same, whether it is academic research or actual testing has shown this point. The original ATR indicator is calculated by putting up and down fluctuations together. This indicator is to calculate separately the upward volatility and the downward volatility, which can better help you study the market.
2. Indicator description There are two modes for the calculation of this indicator, as shown in the f

Este poderoso indicador analisa o gráfico e mostra zonas de Rejeição de Preços! Isto é, locais onde o preço foi, mas não foi aceito pelo mercado! A visualização desta zona de Rejeição, facilita o entendimento do trader na tomada de decisões de onde operar e como operar!
O indicador é composto por 4 linhas, sendo classificadas em 2 grupos: Linhas Vermelha e Amarela: Denotam os extremos onde o preço conseguiu chegar, mas não foi aceito! Linhas Laranja e Azul: A partir delas, denotam o Início da
FREE

The Bolliger Bands On-Off let you control the indicator using the keyboard or a button . You can choose if you want the indicator always shown or always hided while switching among different time frames or financial instruments . ---> This indicator is part of Combo Indicator OnOff
The Bollinger Bands identify the degree of real-time volatility for a financial instruments . A lower amplitude corresponds to a low volatility, conversely a greater bandwidth corresponds to high volatility
FREE
MetaTrader mağazası, geliştiricilerin alım-satım uygulamalarını satabilecekleri basit ve kullanışlı bir sitedir.
Ürününüzü yayınlamanıza yardımcı olacağız ve size Mağaza için ürününüzün açıklamasını nasıl hazırlayacağınızı anlatacağız. Mağazadaki tüm uygulamalar şifreleme korumalıdır ve yalnızca alıcının bilgisayarında çalıştırılabilir. İllegal kopyalama yapılamaz.
Alım-satım fırsatlarını kaçırıyorsunuz:
- Ücretsiz alım-satım uygulamaları
- İşlem kopyalama için 8.000'den fazla sinyal
- Finansal piyasaları keşfetmek için ekonomik haberler
Kayıt
Giriş yap
Gizlilik ve Veri Koruma Politikasını ve MQL5.com Kullanım Şartlarını kabul edersiniz
Hesabınız yoksa, lütfen kaydolun
MQL5.com web sitesine giriş yapmak için çerezlerin kullanımına izin vermelisiniz.
Lütfen tarayıcınızda gerekli ayarı etkinleştirin, aksi takdirde giriş yapamazsınız.