YouTube'dan Mağaza ile ilgili eğitici videoları izleyin
Bir alım-satım robotu veya gösterge nasıl satın alınır?
Uzman Danışmanınızı
sanal sunucuda çalıştırın
sanal sunucuda çalıştırın
Satın almadan önce göstergeyi/alım-satım robotunu test edin
Mağazada kazanç sağlamak ister misiniz?
Satış için bir ürün nasıl sunulur?
MetaTrader 4 için ücretli Uzman Danışmanlar ve göstergeler - 228

Face smiling trend indicator is an oscillator designed to search for turning points. Face smiling trend indicator represents an oscillator that uses in his work an average price for a certain period and is designed to determine the price reversal points. Face smiling trend indicator oscillates between 0.00 (oversold) and 105 (overbought) values depending upon market conditions. Red bars suggest bearish pressure and blue bars bullish pressure. Typically, a reversal of the trend occurs when achiev

Undefeated trend indicator, an indicator that uses MacD and Bollinger bands. It is a coded indicator to find trends. It finds these trends by its own algorithm. This indicator requires visual monitoring. It does not give any warning because it needs visual follow-up. The main trendline should turn down to find the down trend. The main trend line should go under the white line and then go under the yellow line. The main trendline should turn upward to find the upward trend. The main trend line sh

This indicator is designed to find the difference in price and indicator. This indicator uses various indicators. These indicators RSI, Macd, Momentum, RVI, Stochastic, Standard deviation, Derivative, Williams, and custom. You can use these indicators by selecting the indicator type section. This indicator shows the price and indicator difference on the screen. Indicators are individually selectable. You can use the custom type to enter the desired parameters. The user is alerted with the alert

This EA is Based on breakout strategy. It enters the trade when there is a price breakout from resistance or support levels, which are determined based on math algorithm. This system is designed for the H1 timeframe for XAUUSD, GBPJPY or other currencies. No martingale, grid, risky scalping. Always use Stop Loss to secure your investment. The EA can be used with other currency pairs to mitigate risk and has no complicated settings.
Parameters Lots = 0.1 : Fixed positions. SL = 600 : Fixed Stop

The MACD CloseBars indicator is a trading system based on the MACD indicator popular among many traders, which is built on the principle of bars closing above the moving averages selected in the indicator settings. The signal for entering/exiting the market is the frame of the bars colors according to the trend: in case the bars in the main window of the chart are closed above/below the Fast Moving Average, Slow Moving Average individually or both together.
Indicator Parameters Fast Moving Ave

The Grid Inside works on a counter trend mode, automatically opens a new order when it hits the price target due to the Fibonacci levels at 23.6 and 73.6. If the price goes the wrong way it opens another order with a calculated lot and position. All the positions are closed when it reaches the target profit defined on settings. As TGI does not use stop loss, I don't recommend you put on your account more than you can afford to lose, the higher the timeframe safer it gets. Once an order is trigge
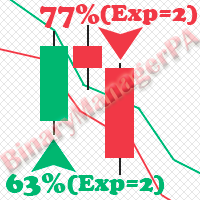
BinaryManagerPA is an indicator for binary options based on the analysis of the Price Action and indicator setups using complex filters. The main advantage of the indicator is that it estimates the current state of the market in advance with using several expiration times. As a result, the indicator generates the statistics on the percentage of successful trades (WinRate) for the selected instrument and timeframe. In addition, the indicator displays the win rate and the recommended expiration fo

The Pairs Trade indicator is a utility for semi-automatic pair trading. It allows combining the charts of two arbitrary instruments, even if the schedules of their trading sessions are different. It displays a spread chart in the form of a histogram with an overlaying moving average. It calculates the swap that will be charged for the synthetic position (in the deposit currency). It is possible to set a level for automatic opening of a synthetic position on the spread chart (analogous to the 'se

Super Custom Indicator allows you to design trading signals on your own without coding knowledge. You just need to input the trading rules and it will scan multiple symbols at multiple time frames to find the signals for you in real-time as well as in history chart. Real-time signals will be sent to your mobile and email also. The indicator can calculate and analyze every technical indicators, even custom indicators, with complex operations to give the signal exactly. Normally, it is hard for yo

Uses indicators: Relative Strength Index. Features The template features an adaptive forecast algorithm based on history data of price action; It has multiple filters for opening new orders; Compatible with any trading strategy, both manual or automatic (Expert Advisors); It has the maximum possible and compatible functionality: adaptive order grid, locking, averaging, rebuying.
Expert Advisor Installation It is recommended run the EA on a VPS and to launch it on multiple adjacent currency pai
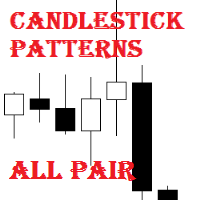
Candlestick Patterns All Pair is a simple and convenient indicator of candlestick pattens. It is able to identify 29 candlestick patterns. It displays the latest patterns for all pairs and timeframes.
The considerable advantages of the indicator It finds and marks 29 candlestick patterns; Displays a table of the last patterns for the 28 major pairs and each timeframe; It has settings for 5 extra pairs; Indicates the classic trade direction; Each candlestick patterns can be disabled in the sett

Venom Scalper is a scaler EA, which trades strong market movements. The Expert Advisor does not use hedging, martingale, grid strategies, arbitrage, etc. The basis of the EA strategy lies on breakouts of the key levels based on supply and demand. The EA analyzes the volatility values, sets the breakeven levels, controls slippages and spread expansions. The trailing stop allows the robot to capture most of the movements, while reducing the risks. The settings are indented for the H1 timeframe. At
Please download User Guide / set files / Strategy Tester Report from here: https://www.mql5.com/en/blogs/post/689449 Twins Grid System is a powerful and flexible tool for experienced trader. This system is consist of 2 full grids: Grid A and Grid B, each full grid contains 4 basic grid: BuyLimits Grid, SellLimits Grid, BuyStops Grid and SellStops Grid. There are 31 system parameters, 22 parameters for each basic grid. It’s able to create various kinds of grid strategies.
Features (1) Some grid
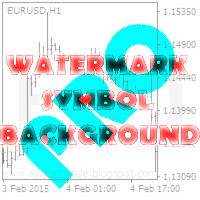
This utility displays the name of the current symbol and the current period in the chart background in a large font. It is very convenient, e.g. when you use multiple charts with different symbols, period or when saving a chart screenshot. The information is displayed in two lines. In the first line, the chart symbol and current timeframe are shown in a larger font (e.g. AUDUSD,h1 ). In the second line, the full name of the current symbol is displayed in a smaller font (e.g. for GPBJPY it shows

Hasty is an intraday trading system making profit during short-term price movements. The Expert Advisor has been optimized for working on EURUSD. However, it can successfully work with other currency pairs as well. You can examine the Expert Advisor's trading statistics for different brokers and symbols in the MetaTrader 4 Trading Signals sections.
Parameters Risk management: enter volume - volume for entry. If the value is greater than 0 - number of lots, if less than 0 - percentage of availa
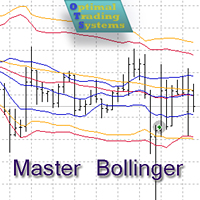
The Expert Advisor opens and closes positions using Bollinger Bands signals: it buys on lower bands when price rolls back, and it sells on upper bands. It has the option to close positions by an opposite signal, by take profit and stop loss, move a trade to breakeven upon reaching the central Bollinger band or after a certain price movement. Many good strategies use one or more Bollinger Bands indicators. In this EA, it is possible to use up to 3 such indicators. When using the first and second

The Zones indicator provides a visual display of the boundaries around a price action. There are two types of zones included in the indicator: High-Low price zones Time period zones (delineations) High-Low price zones display the boundaries of the High and Low price points. Typically, these zones are displayed for the High and Low price of the day. Time period zones display boundaries around time period intervals.
PARAMETERS Yancy indicator
IndicatorName – indicator name displayed in the char

What It Does During strong directional movements, the probability always leans towards moving along the trend. This is the probability utilized by the fully automated Catcher Trends robot, abbreviated CT. Trades are opened only in the trend direction and based on important levels. CT enters the market by its own algorithm using pending stop orders with predefined stop loss and take profit. This minimizes the slippages when opening trades, and stop loss prevents the unforeseen losses. The order p

Price Action Triggers indicator uses the purest form of data available in the market (price action) to determine the entry triggers. The signals are formed by observing the shape, positioning and relative size of the candles. The triggers will appear once either a single or a multi candle setup is detected. It is important to note that the triggers will not observe the broader direction of the market (market sentiment). Thus the indicator should not be used as a stand-alone trading system. The P

The ”Trend Guess” is a complex software that does not involve the MACD, RSI or moving averages. It adapts itself to current market conditions using complicated algorithms based on price action and out custom indicators. The indicator will gives you trading signals Buy or Sell stop loss levels indicated in the popup alert window and graphically. You have to do is to press buy or sell button whenever you get a signal
Important Rules Identify a current long term trend. Example – if you trade on a
MMMStochastic EA strategy: The robot uses its built in Parabolic SAR indicator all the time and does a calculation to determine the prices trends. If it indicates the price will be bullish, it sends a buy order. If the indicator indicates the price will be bearish, it sends a sell order; It will not send an order unless the calculations determines a good trend of profit; Like all MMM products it is also programmed to minimize your losses and protect your money from the hostile market. We have pr

Target Geometry is a next-generation indicator that uses the geometric nature of the markets to give high statistical probability levels ( Fibonacci ). This indicator creates a very important map that optimizes the entry points and it optimally defines your own money management. The indicator can be used both in static mode or in dynamic mode, you can use it on any financial instrument. The use in multi timeframe mode is a very good ally to have. The target levels are high statistical probabilit

Centaurus Trend Engine is an indicator that uses custom indicators to give the current momentum moves of the market with a multi-timeframe approach to trading Features Value Area -It is the (red/green) rectangular box on your chart based on the dynamic structure period set;Green to indicate you focus on LONG moves & Red for SHORT moves Analysis - Displays The Market Analysis Strength - Displays The Market Strength Trend - Displays The Market Trend Entry State - Displays the BEST entry time for t

Strong trend indicator is a special indicator designed to capture healthy signals. There are lines showing the signal of the indicator and the power of buying and selling. The signal line is yellow. The green lines are Buy lines. The ones that are brown are Sell lines. The green line must close above the yellow line to perform the operation. The brown line must close above the yellow line to sell. The important line is the first one that closes above the yellow line. If the first line is green,

Cross scalper is a scalper EA intended for trading AUDCAD, EURAUD, EURCAD and GBPAUD. The fundamental principles of the Cross Scalper are similar to the principles of the Yogi EA and Scalper GBP . The introduction of new functions, the revision of market entry logic and other changes allowed to adapt to trading new pairs. The Expert Advisor does not require optimization and will not become obsolete over time. The Expert Advisor does not use hedging, martingale, grid strategies, arbitrage, etc. M

This indicator indicates potential entry points. Rsi indicator and console wax combination. In addition to the signals in the graphic arrows, text comments are also used. Features
Works on any currency pairs. It works in all periods. Sensitivity setting. You can set the signal frequency. Use recommended standard settings. The greatest feature of this display is the possibility of manual martingale.
The signal intensity region tends to go in the direction of the signal. Works on all charts.
Stochastic is the indicator used by traders the most. This version allows to extract the maximum amount of information without hassle of constantly switching between the timeframes and, thereby, greatly simplifies working with it. This is a standard Stochastic oscillator provided with an info panel displaying the current relative position of %K and %D lines on all timeframes. The info panel is intuitive and easy to use. The oscillator is especially useful in scalping techniques when you need to

Fractals Trailing Stop is a tool that implements trailing of the stop loss order after the price based on the Fractals by Bill Williams. The utility provides all the necessary parameters for customization, which allows to select the optimal configuration for any user. The EA allows to choose the trailing line depending on the type of the trade. For example, buy trades can be trailed based on the downward fractals, and sell trades can be trailed based on the upwards fractals. The Magic parameter

The Expert Advisor has been created and tested on the EURJPY currency pair. It works based on round price levels, on any timeframe, in both directions at the same time.
Strategy The BF Dozer EA simultaneously opens two opposite positions at the round price levels. It uses averaging and martingale methods in its trading. To stop the EA operation, disable the "Buy" and "Sell" parameters in the settings, move all positions to breakeven using the "Buy to breakeven" and "Sell to breakeven" buttons

The EA works based on standard indicators.
Parameters Lot - initial lot size; Dynamic Lot - dynamic lot (0 - disabled); Take Profit - take profit; Stop Loss - stop loss; Trailing Stop - trailing stop; Trailing Step - step of the trailing stop; Slipping - slippage; Magic Number - identification number of the orders; Momentum Period - period of the Momentum; Momentum Price - price type of the Momentum; Moving Average Period - period of the МА; Moving Average Shift - shift of the МА; Moving Avera

use on EURUSD use on M5 price and indicator analysis. Deals is in the direction of the trend. analysis 4 TimeFrame. Price and MovingAvarage (MA) are analyzed at TF EA. Market conditions in each TF are analyzed separately, then the overall picture. The algorithm shown in the screenshot below Sets is in Comments
Advantages Advisor is optimized well for any instrument Can work on accounts with any spread, commissions, delays in the execution of orders Flexible settings specifically for your need

Use on EURUSD Use on M5 Intraday trading. Analise the price movements on the H1 timeframe (TF) (This allows to trade even in the absence of a global price trend). Analyzes 2 or 3 timeframes. On each TF, the EA analyzes the relative position of the price and moving averages (MA) (one or two on each TF). The operation algorithm is shown in the screenshot Sets is in Comments
Advantages The EA can be easily optimized for any instrument at any moment. Flexible customization specifically to your ne

The Extreme point indicator helps in determining the probable price reversal points on the chart. The indicator facilitates the search for points to enter the market with greater accuracy. The indicator displays certain impulses, after which there is a high probability of the price continuing its movement in the same direction. The indicator can be used in conjunction with other indicators for a more accurate detection of the position entry points. The indicator can also be used independently. F
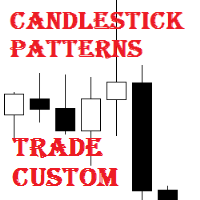
Candlestick Patterns Trade Custom is an Expert Advisor for trading candlestick patterns.
The considerable advantages of the EA It allows the user to configure the signal of each pattern, it is recommended to configure the EA in accordance with the analysis results of the Candlestick Patterns Analytics indicator; It does not use Martingale; Contains the integrated Candlestick Patterns Custom indicator.
Description of Input Parameters Each candlestick pattern has a drop-down menu with the opti

The RSI Panel MTF indicator has been created in order to have the ability to monitor the values of the standard RSI indicator from a multitude of timeframes and symbols on a single chart, as well as to receive timely notifications about the trading opportunities using an audio signal or a notification. The indicator can output both the indicator values, and only the indicator signals (confirmed and expected). A user-friendly feature for selecting the required symbol has been implemented - simply

The Advanced EMA indicator implements an exponential moving average with many additional features. First, EMA is color-coded to indicate distance between the price and EMA. This Advanced EMA has many features and configurations that set it far above standard EMA indicators used most platforms. There are 3 types of indications in the indicator. The EMA is color-coded. Secondly, cross points of price and EMA are marked. Thirdly, BUY/SELL signals are shown. Color-coding the EMA allows you to easil

The utility places virtual (hidden from your broker) trailing stop, breakeven, stop loss and take profit. It is necessary to allow automated trading in the terminal settings. In testing mode, the utility opens Buy or Sell positions on the first ticks, which allows you to visually observe the given logic, changing the utility parameters. In real mode, the utility does not open positions. Parameters magic - magic number. If less than 0, positions with any magic number are tracked. only_this_sy
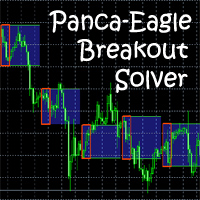
This expert is an implementation of 4 different strategies for trading with the PANCA EAGLE Break Out indicator. The indicator will be useful for traders who already use the PANCA EAGLE Break Out indicator, working with it manually.
Features Break Out PANCA EAGLE is a channel indicator for Forex, which displays the operating channel of the currency pair during the Asian trading session. The indicator determines the maximum and minimum price for the selected trading period and offers to make tr

This is a trading idea without further study analysis. Just use the capital management methods + be brave enough. Trades that are not successful to scalp are handled in a different and unique way of martingale. It includes two options to deal with open trades. Pending Order Martingale (It helps to reduce Draw Down) Market Business multi-dimensional order martingale Please note that: you always responsible for your account management
Requirements and recommendations Digit 4 (usage Spread sma

AIS Ağırlıklı Hareketli Ortalama göstergesi, ağırlıklı bir hareketli ortalama hesaplar ve trend olan bir piyasa hareketinin başlangıcını belirlemenize olanak tanır.
Ağırlık katsayıları, her bir çubuğun belirli özellikleri dikkate alınarak hesaplanır. Bu, rastgele piyasa hareketlerini filtrelemenize olanak tanır.
Bir trendin başladığını teyit eden ana sinyal, gösterge çizgilerinin yönündeki bir değişiklik ve gösterge çizgilerini geçen fiyattır.
WH (mavi çizgi), Yüksek fiyatların ağırlıklı

Grid Hero is a fully automated EA that uses a revolutionary Grid algorithm (P.A.M.A.) together with a signature synergy of Price Action trading and an Artificial Instinct Self-Adaptive Processing Unit. Grid Hero was strictly developed, tested and optimized using the "Reversed Sampling" development methodology based on "In-Sample" phase (2012 to 2017) and "Out-Of-Sample" phase (2004 to 2011). It has passed 13 years back test of real tick data and real variable spread (with commission) from 2004 t

Complete Scalper is a scalper EA that combines the strategies of three Expert Advisors - Yogi EA, Scalper GBP and Cross Scalper . The Expert Advisor does not use hedging, martingale, grid strategies, arbitrage, etc. Most of the settings are already integrated into the EA code. All you need to do is to select the currency pair, adjust the WET (Western European Time) time zone in the EA parameters and to start trading. Working timeframe - M15.
Advantages of Complete Scalper Trading strategy for

We present you our new project named Titan . The Expert Advisor has been developed for quite a long time. The EA uses a multitude of custom indicators to determine the market situations. The EA is suitable for working with any broker. The EA works with all pairs, but it is recommended to use 8 pairs, which have selected in many optimizations and tests and which proved to be the best. Optimized for 8 currency pairs / М15 timeframe: EURUSD, USDCHF, USDCAD, NZDUSD, AUDCAD, CADCHF, AUDCHF, AUDUSD. R

The oscillator shows trend direction using its own algorithm, which is based on calculating price values by analyzing prices of separate currencies (original valuation of currencies). The histogram shows the average value of physical price change over the selected period. When the histogram has a positive value, the trend is rising, if negative - the trend id falling. The indicator uses standard RSI to determine the current market direction on a selected period as follows: the default value of

PROvolumes is the tool for traders who trade on lower Timeframes such as M1 and M5. The Indicator is based on serveral Oscillators with Multitimeframe Trendfilters - The entries in the Market are really tight by this Indicator. It gives you visual view of the Signalratio for current Chart and Timeframe and will also notify you when it's time to go long or short. For maximum Profit you can use our top Trendindicator TrendFollowerSR to get even better Winrate. You don't need to configurate PROvolu

The Color Trend FX indicator shows on the chart the accurate market entry points, accurate exit points, maximum possible profit of a deal (for those who take profit according to their own system for exiting deals), points for trailing the open positions, as well as detailed statistics. Statistics allows to choose the most profitable trading instruments, and also to determine the potential profits. The indicator does not redraw its signals! The indicator is simple to set up and manage, and is sui

MMMStochastic EA strategy: The robot uses its internal Stochastic indicator all the time and does a calculation to determine the prices trends. If it indicates the price will be bullish, it sends a buy order. If the Stochastic indicator indicates the price will be bearish, it sends a sell order; It will not send an order unless the calculations determines a good trend of profit; Like all MMM products it is also programmed to minimize your losses and protect your money from the hostile market. We
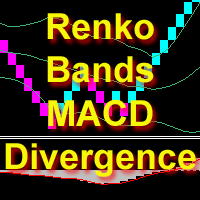
The indicator displays Renko bars, uses their data to calculate and display the Bollinger Bands, MACD indicators and provides buy/sell signals based on divergence/convergence of the price action and oscillator. Renko is a non-trivial price display method. Instead of displaying each bar within a time interval, only the bars where the price moved a certain number of points are shown. Renko bars do not depend on a time interval, therefore the indicator works on any timeframe without losing its effi

It would be good to always be aware of the "struggle" between buyers and sellers. Then it would be much easier to determine the best direction to go in order not to lose out. This indicator offers an original solution to this problem: the supply and demand values are compared with the High and Low prices for the selected period, thus trying to determine the market movement towards the stronger side without ignoring the strength of the opposite side. All this is displayed in a separate window usi

The Expert Advisor uses an averaging system and various indicators for determining signals. The Expert Advisor does not open positions during news releases. The EA has been optimized for the currency pairs / timeframe М15 : EURUSD, USDCHF, USDCAD, NZDUSD, AUDCAD, CADCHF, AUDCHF, AUDUSD.
The EA works with any broker. For the EA to work correctly, open Tools > Options > Expert Advisors. Check the option "Allow WebRequests for listed URL:". Add http://ec.forexprostools.com , http://time.is/UTC
Demo version here: https://www.mql5.com/en/market/product/21344 Purpose: For those who trade with trend line manually, this expert is suitable for you to manage your trade in easy way. Usage: Draw a trend line or horizontal line, and rename it according to input parameter in example "sell" >> for more details please watch the video below. Action: ea will identify the trend line, and trade based on the selected mode (Touch/Break), ea will also set the TP/SL/Lot automatically according to in
MILCH COW MIX PRO EA is primarily a Hedging and Multiples Strategy. It support to seize every opportunity in any direction as MILCH COW MIX but with an increased number of trades. YOU must run the expert on two chart at same currency. Not just opens the deals, but chooses the right time to close the open positions to begin trading again. We recommend the use of an expert with a pair of high volatility for the currency, such as GBPAUD, AUDCAD Testing expert during the period from 01.01.2014 until

Three moving averages with three timeframes and High/Low levels on one chart, individual period parameter for each of them. The indicator helps to determine the values of moving averages on the current, the next smaller and the next higher timeframes. The filtered vales are displayed in the top right corner of the chart according to the logic of traffic lights. If a buy or sell sign is green, then a long or short position can be opened in the specified timeframe. If the sign is red, it is time t

The OHLC Trailing Stop utility trails stop loss based on control prices of the specified bar: Open , High , Low , Close . In the utility settings, you can choose the bar number, which prices will be used for the trailing stop function. A control price for trailing can be specified separately for buy and sell trades. The Magic parameter allows using the utility together with other Expert Advisors.
Input parameters Magic - magic number: 0 - trailing of all trades, 1>= - trailing of trades with t
Candlestick Patterns Custom is the lite version of the Candlestick Patterns Analytics indicator , intended for use as a conventional arrow indicator and in expert advisors.
The considerable advantages of the indicator It finds and marks 29 candlestick patterns (43 variants of signal patterns) on the chart; It allows the user to configure the signal of each pattern in accordance with the analysis results of the Candlestick Patterns Analytics indicator; The indicator can also be used as an arrow

RiverScope automatically determines the nearest most important price levels and support and resistance zones in history, it also identifies a large number of price action patterns (30+). The support and resistance levels are determined based on an algorithm that calculates and filters the historical values of the price, its movement character, volumes, etc. It displays the current situation, therefore the nearest levels change in real time depending on the current price.
Advantages flexible cu

The Psychological levels indicator for the MetaTrader 4 terminal. Forex trading is very closely related to psychology. The psychological factors often cause spikes in demand or supply, which is bound to affect the movement of the currency quotes. In Forex, the price usually moves within a certain price corridor, the so-called psychological levels often serve as the boundaries of such corridors. Where are these levels located, and what causes their formation? The psychological Forex levels occur

Candlestick Patterns Analytics is a powerful tool for analyzing candlestick patterns. Do you trade based on candlestick patterns? Then Candlestick Patterns Analytics is designed for you.
The undeniable advantage of the indicator: Predicts trading result when trading candlestick patterns; Uses statistical data based on the history of the selected symbol and timeframe.
What the indicator does Finds and marks on the chart 29 candlestick patterns; Draws arrows to indicate the classical and stati

MMMAlligator EA strategy: The robot uses its internal Alligator indicator all the time and does a calculation to determine the prices trends. If it indicates the price will be bullish, it sends a buy order. If the Alligator indicates the price will be bearish, it sends a sell order; It will not send an order unless the calculations determines a good trend of profit; Like all MMM products it is also programmed to minimize your losses and protect your money from the hostile market. We have protect

For opening positions, the EA uses support and resistance levels, that are detected by advanced adaptive algorithm A. A.P.L. D. and a certain correlation of some standard indicators. The algorithm allows to detect dynamic levels of support and resistance, that gives the opportunity to respond quickly to changes of market conditions.
The EA is equipped with Autorecovery function, that allows to recover drawdowns of trading account.
Minimal recommended deposit: - $2000 for 0.01 lot for standa

Bollinger Breakout Trader tells the trader when the market is about to breakout from a non-volatile period. Non volatility usually means its building up steam for more good moves in future. A signal is formed when this switch from non-volatile to volatile occurs. These periods are measured by both Bollinger Bands and Keltner Channels. Bollinger Bands measure the standard deviation of price from the Moving Average which results in an expanding and contracting channel. Keltner Channels are based o
Candlestick Patterns MT4 is a simple and convenient indicator able to define 29 candle patterns.
Advantages Defines and highlights 29 candle patterns; Estimated trading direction is shown as an arrow; Each candlestick pattern can be disabled in the settings; The indicator can be used as an arrow indicator in EAs.
Parameters TextSize - chart text size; TextColor - chart text color; Alert - enable/disable alerts; ---------- Candlestick Patterns ------------- - settings separator; AdvanceBlock

Buffer Scan analyzses your custom indicator buffers with iCustom function on a certain period of history (configurable by the user) and writes buffers’s data to a csv file. The script helps determine buffers’ numbers, through which the indicator transfers any data, for example, the appearance of arrows, a particular color, a certain line and other information. The utility scans all 512 indicator buffers but it records to a csv file only those of them which have data. If a buffer does not transf
Operation principles The Expert Advisor works on any timeframe and symbol. The robot analyzes the relative MAs position. Pending orders are opened after the necessary conditions are met. No next order is opened till the previous one is closed. The server time is analyzed when opening orders. The EA opens orders in the most appropriate trading periods. A lot volume ratio is used when entering the market. The lot volume is changed during trading. You only need to set six parameters.
Parameters S

Nowadays a lot of traders need to open more positions for the same pair, because one position is not usually the best possible position, thus a lot of trades are accumulated, sometimes with different lot sizes, and not easy to calculate the breakeven price of all opened positions, for solving this issue the Breakeven Price indicator was created. Breakeven Price is an MT4 indicator which calculates real time the breakeven price of all Buy & Sell positions opened by trader or EAs. It shows real ti
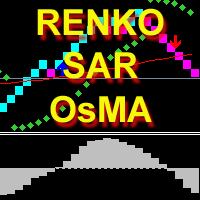
The indicator calculates and displays renko bars using Moving Average, Parabolic SAR and OsMA data as well as provides buy/sell signals. Renko is a non-trivial price display method. Instead of displaying each bar within a time interval, only the bars where the price moved a certain number of points are shown. Renko bars do not depend on a time interval, therefore the indicator works on any timeframe without losing its efficiency. The buy signal is generated when the OsMA indicator crosses the ze

The strategy is Based on the calculations of weighted volatility and related items. It uses a trading algorithm based on the price movement for avoidance trend conditions. Volatile market occurs 80% of the time. In this case, it is of great possibility to use the low volatility of EURCHF. When the trend of market, EA will stop work automatically, into the "smart avoidance state". When the market returns volatile, Transaction automatically return to normal! This EA does not use martingale or g

PARTIAL CLOSE & VIRTUAL TRAILING Virtual trailing with partial position closing. ( Version MT5 ) ea-PartTrailing&Close is a fully automated Expert Advisor for tracking trades. Version =Simple= provides tracking of one BUY or SELL orders (or 1 Buy+1 Sell simultaneously). The EA is almost perfect at averaging profit and loss. StopLoss without TakeProfit is recommended since the latter may limit your profit in case of sharp price spikes. The trailing is virtual since every movement of the levels r

The indicator works only on the chart periods smaller than the daily period. It shows the boundaries of the daily candle and trading sessions. Description of the indicator settings: Count_Bars - limit on the number of bars for indicator calculation lineColor - line color lineStyle - line style lineWidth - line width candle_up - color of bullish candle mark candle_dn - color of bearish candle mark candleWidth - candle width AsiaBegin - opening time of the Asian session AsiaEnd - closing time of t

The indicator displays the moment the price reaches an extreme level, including an invisible one (due to screen size limitations). Even small peaks and bottoms are considered extreme points. The level is shown as a trend line extending for a distance from the current candle (bar) to the left. The level has two values: distance (in bars) for the extreme point in a straight line to the left and distance (in bars) from the current candle (bar) to the extreme point (see the screenshots). The indicat
MetaTrader platformunun uygulama mağazası olan MetaTrader mağazasından bir alım-satım robotunun nasıl satın alınacağını öğrenin.
MQL5.community ödeme sistemi, PayPal, banka kartları ve popüler ödeme sistemleri aracılığıyla yapılan işlemleri destekler. Daha iyi bir müşteri deneyimi için satın almadan önce alım-satım robotunu test etmenizi şiddetle tavsiye ederiz.
Alım-satım fırsatlarını kaçırıyorsunuz:
- Ücretsiz alım-satım uygulamaları
- İşlem kopyalama için 8.000'den fazla sinyal
- Finansal piyasaları keşfetmek için ekonomik haberler
Kayıt
Giriş yap
Gizlilik ve Veri Koruma Politikasını ve MQL5.com Kullanım Şartlarını kabul edersiniz
Hesabınız yoksa, lütfen kaydolun
MQL5.com web sitesine giriş yapmak için çerezlerin kullanımına izin vermelisiniz.
Lütfen tarayıcınızda gerekli ayarı etkinleştirin, aksi takdirde giriş yapamazsınız.