YouTube'dan Mağaza ile ilgili eğitici videoları izleyin
Bir ticaret robotu veya gösterge nasıl satın alınır?
Uzman Danışmanınızı
sanal sunucuda çalıştırın
sanal sunucuda çalıştırın
Satın almadan önce göstergeyi/ticaret robotunu test edin
Mağazada kazanç sağlamak ister misiniz?
Satış için bir ürün nasıl sunulur?
MetaTrader 4 için ücretli Uzman Danışmanlar ve göstergeler - 212
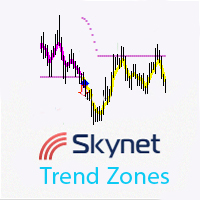
Skynet Trend Zones is based on classical indicators and some mathematical calculations and works in different market conditions for showing the trend. The principle of operation is as follows: if the price moves in a range, then a flat line is shown below or above the price depending on the previous trend; if the price moves down or up without a rollback, a line is shown at an angle to the price, and when a small rollback occurs, the indicator line is built again horizontally. Thus, you can work

The FX Indicators Alert is a Scanner Tool that allow you to set up alerts for any Indicator, and display or send notifications to your email box and/or mobile device. It will monitor your rules in the selected TimeFrames and Symbols. The tool can manage the standard indicators and the Custom one (7 buffers for the custom indicators). You can create your alerts by combining different indicators.
Please note that this tool is not supported in the strategy tester due to multi Symbols, TimeFrames,
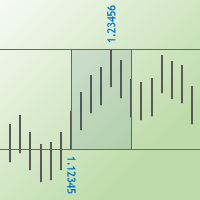
The Max Min Prices One indicator determines the maximum and minimum prices between two candles and shows them as rectangle on the price chart. You may also show the price values and their levels as horizontal lines.
Parameters Start bar time – time of the start candle End bar time – time of the end candle Rectangle filling - fill the rectangle with color Is show max and min prices - show labels of the maximum and minimum prices Is show horizontal lines - show levels of the maximum and minimum

This Expert Advisor uses the Parabolic indicator to determine the trend direction and to find better market entry and exit points. The Expert Advisor tries to enter the market at the beginning of a strong trend. The EA uses hedging strategy and grid of orders and which increases lot size. It uses parameter Max Order as an option in risk management.
Requirements and recommendations The minimum deposit is $10.000 or an equivalent cent account Leverage: 1:500 Stop level less than 20 or 30 points

This indicator is based on the MACD on one or more timeframes and on any Currency Cross Pair. The indicator generates an alert message when it detects a buy or sell signal. It also draws a vertical bar on the price chart: green for buy or red for sell, yellow if flat. Alert messages and Vertical bars for BUY or SELL, are generated when the MACD is consistent for all chosen timeframes else a FLAT signal is generated.
Features Easy flexible settings: Detection of the MACD signal for one or more

The Fibonacci Target indicator is an indicator that uses the Low, High and Fibonacci levels. This indicator has the ability to predict the target. It tries to determine the target that the graph will go on average and draws a target region. The indicator also serves as an oscillator. It can be used as a trend oscillator after making the necessary settings. This indicator is helpful to your strategy. There is no signal generating capability.
Parameters TargetPeriod - Target line period setting

Find pairs are good to trade. A demo version, unlimited and with all functionalities, (displays only 3 results max) can be download here . Up to 4 criteria. Candlestick patterns. Create your own screener with OR/AND conditions. Ex: (condition 1 OR condition 2) AND (condition 3 OR condition 4). From the result, simple click on the pair label displays the symbol in all charts you have. Load your own pair list. By default, the program works with: AUDCAD, AUDCHF, AUDJPY, AUDUSD, CADJPY, CADCHF, CHFJ

Jerus Line Scalper is an indicator for scalping on EURUSD, GBPUSD, AUDUSD, USDJPY and USDCAD pairs. Recommended pairs: M5, M15, M30 and H1. The trading strategy is as follows: as soon as the arrow appears, open an order in the direction of the arrow and set take profit to +10 points. Set stop loss at the indicator's stop line. Stop line is displayed in red or blue depending on the indicator signal. Also, the Martingale system can be applied in the system. If a trade is closed at a loss, the next

This Expert Advisor's main strategy is based on the usage of two kind of indicators: two built-in shifted MFI (Money Flow Index) to measure the asset prices oscillations and two Moving Averages calculated over Open Prices and Close Prices to confirm the trends. It combines these indicators signals in order to get stronger signals and ensure the EA will do good trading operations. The second strategy consists of sending a new opposite order against a losing order since it reaches the minimum nega

Spread Costs refers to the amount of the loss caused by the spread, and Swap Benefits refers to the amount of the income gained by overnight positions. Spread Costs is an important indicator for short-term traders, especially for scalping traders, and Swap Benefits is an important indicator for long-term traders. Since the spreads and swaps on the MetaTrader 4 platform are all expressed in points, we need to convert it into the amount expressed in the account currency. This tool can display the
CutTheTrend FX is an automated trading Expert Advisor, which does not use indicators, because the analysis of history often leads to incorrect decisions in the future. The Expert Advisor analyses the current market situation based on Price Action and opens a position according to these calculations. It opens one position, but, if necessary, can apply grid algorithms to maintain positive operation. Also the EA is equipped with protective techniques, such as Trailing stop and Risk Blocking (see th

Forest is a Trend Expert Advisor based on the analysis of a unique mathematical model of trend lines, which allows you to determine the trend movement. The Expert Advisor is most suitable for the currency pair "USDCHF" on period "H1". The EA can work on any type of accounts, and with any brokers. The EA uses mathematical analysis to open trades and applies loss control to open trades. At its core, the EA does not use any risky systems with the increase in the volume or increase in the number of

"ANYWAY Plus EA" is a tool designed to handle your trades in a different concept, similar to "ANYWAY EA". But it looks for opportunities on 28 currency pairs and displays the data on the current chart. The EA does not start its trailing by locking in profit. It just moves stop loss by 1. It will step the SL by 1 so for every 1 pip the SL moves to 19, 18, 17, etc. All these stop losses and take profits can be hidden from the broker by selecting SLnTPMode = Client. Run the EA on one pair on the M5
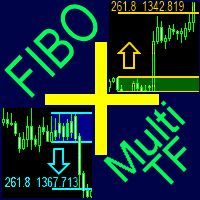
A ready-made multitimeframe trading system based on automatic plotting and tracking of Fibonacci levels for buying and selling any symbol.
Advantages Determines the trend direction based on a complex of 14 indicators ( Cx ), extremums of ZigZag ( Z ), RSI ( R ), Impulse ( I ) Displaying the values of 14 indicators comprising the trend direction ( Cx ) Plotting horizontal levels, support and resistance lines, channels View the plotting option of Fibonacci levels on any timeframe, with the abili

"ANYWAY EA" is a tool designed to handle your trades in a different concept, which does not start its trailing by locking in profit. It just moves stop loss by 1. It will step the SL by 1 so for every 1 pip the SL moves to 19, 18, 17, etc. The brokers can see this and do nothing to deal with it. While you are sitting there waiting for it to lock in the points it has already made. All these stop losses and take profits can be hidden from the broker by selecting SLnTPMode = Client. Run the EA on a

The Bollinger Bands Oscillator is an oscillator based on the "Mastering the Trade" strategy by John Carter. The strategy aims to track the movement from low to high volatility. The Bollinger Bands Oscillator measures the market's momentum. If volatility increases, Bollinger Bands is expanding and encircling the Keltner channel. Bollinger Bands Oscillator uses Bollinger Bands and Keltner Channel. The Momentum indicator is also used as a confirmation of open positions.
Recommendations Currency p

>>> BIG SALE PROMOTION: 50% OFF + GIFT EA! - Promo price: $64 / Regular price $129 <<< - The promotion will end soon!
Smart Impulse Trader is an automated forex trading robot. The main idea behind this strategy is to detect the impulse and to open two trades at the same time and in the same direction. There are separate take profits for both trades: First_Trade_TP and Second_Trade_TP. When the first trade is closed with profit, then the robot sets take profit value to the second trade. The d

Fibo Scalper Pro Expert Advisor, popüler Fibonacci Ticaret Stratejilerini otomatikleştirmek için tasarlanmış güçlü bir araçtır. Grafik üzerinde Fibonacci seviyelerini otomatik olarak çizerek ve ayarlayarak ticaret sürecini basitleştirir. Bu özellik, analizlerinde Fibonacci düzeltmelerini ve uzantılarını kullanan tüccarlar için kolaylık ve doğruluk sağlar.
Fibo Scalper Pro'nun en önemli özelliklerinden biri, özelleştirme olanağıdır. Profesyonel tüccarların, kendi özel ticaret tercihlerin

Monitoring of online trading on a DEMO account https://www.mql5.com/en/signals/2000836
The Idea Finding the third Elliott wave. Analyze the market as a wave structure in the format of 1-2-3 waves.
Algorithm The EA analyzes the closed bars using a simple algorithm with the ability to adjust various parameters. Reference point - touching of the High/Low of a certain bars range. After an impulse in the direction of the reference point, the EA waits for a rollback - the second wave. As soon as

The Expert Advisor performs trading operations using the signals of the Heterodyne indicator. The indicator is built into the EA, so there is no need to additionally launch it in a price chart. Buy signals are generated when the indicator crosses a given level upwards, sell signals are generated when the indicator crosses the level downwards. If orders have not reached the specified profit, the Expert Adviser opens repeated orders with an increased lot, following the signals of the indicator. Th

Breakout Hero is a Multi Symbol , Auto Timeframe , Breakout Expert Advisor . It recognizes breakout patterns and will set pending trades. When triggered Breakout Hero will monitor trades and adjust the stop loss. Breakout Hero is a multi symbol EA, it will trade EURUSD, GBPUSD, USDJPY and USDCAD. Also, Breakout Hero is auto timeframe. Just drop Breakout Hero on any chart and start trading. Only one chart is needed, Breakout Hero will trade the symbols you pick from the settings. You can monitor

This indicator shows the latest untouched support and resistance as horizontal lines. The indicator can show support/resistance from higher timeframes. With this indicator you can e.g. easily see the support/resistance of the timeframes H4, D1 and W1 on a H1 chart, which can be a big advantage while time your entry on H1. This is the FULL version of the indicator: Support Resistance Multi Time Frame FREE
Parameters referenceTF: the timeframe from which the support/resistance is calculated cand

Overview It only needs a small initial deposit. Immunity to the large delay and the size of the spread. Monitoring of my accounts : https://www.mql5.com/en/signals/author/mizrael
How it works The EA opens orders based on a built-in indicator. The EA determines the order with the greatest negative profit each tick. Then it determines the total profit of Buy and Sell orders on each currency pair. If the total profit of Buy or Sell orders on each currency pair exceeds the value of the Profit p

EA Mbot News Trader is an Expert Advisor based on a classical news trading strategy. You just need to configure from properties News time and the rest is automatically handled by the robot. The Expert Advisor uses pending orders expecting both breakout and rollback. Before news release, the EA places two pending orders at a preset distance from the current price. Once one of the orders triggers, the second one is deleted. A common trailing stop is used to manage positions. If a news release is n

The oscillator shows reversal points and the movement strength very well. It can be used on any symbol and any timeframe. It has a parameter of the level when the signal reaches the required power. The indicator is very easy to setup. Indicator bars are not redrawn.
Description of the Parameters PeriodPower - signal power calculation period LevelPower - the required level of the signal power
Description: - Chart Time + Indicator is very simple and easy, but it can be very important to control the time before opening any manual trade. This indicator shows the time in a panel between 3 different options. Can be possible to move the panel with mouse or with fixed coordinates on the chart. Input Parameters: - Local Time : Enable Local Time if you want to show it (Personal Computer Time). - Server Time : Enable Server Time if you want to show it (Broker Time). - GMT Time

This Expert Advisor is based on pivot points. Users can choose entry level and direct themselves. Expert use martingale strategy to recover unsuccessful trades. When going into drawdown it starts its slipping mode in which it always tries to keep the whole set of trades on a steady course level. In hedging mode, all take profits will be deleted and the basket will try to close at breakeven price. EA can also be used as normal with Stop loss. Please test before using with Stop loss. The EA can tr
Uses an advanced grid algorithm with no martingale or limited Martingale (default) (version for MT5: GS grid5 ) . Defines and control the current trend; It switches himself its parameters in accordance with the current market conditions ;
Flexible customizable grid algorithm with or without martingale; Drawdown reduction algorithm (DD Reduction Algoritm); Hedge algorithm; Interactive trade control buttons; The ability to open / close orders manually; News filter to prevent trading during news

Automatic fibonacci with alerts is an indicator that automatically plots a fibonacci retracement based on the number of bars you select on the BarsToScan setting in the indicator. The fibonacci is automatically updated in real time as new highest and lowest values appear amongst the selected bars. You can select which level values to be displayed in the indicator settings. You can also select the color of the levels thus enabling the trader to be able to attach the indicator several times with d

This is an indicator of "round levels" with a trading system module based on market scenarios near psychologically significant "market prices". Visualizing the SL/TP levels and modeling deals when they interact with OHLC prices, the module collects statistics for the specified period and plots the "profitability curve" on its basis, which allows controlling the expected profitability of trading signals.
Trading system The algorithm is based on the trading system The Elementary, Watson! ( EW )

This indicator visualizes the intersection of two moving averages in the MACD oscillator. It uses the histogram color to signal about the moving averages crossing the zero level of the indicator. The MACD (Moving Average Convergence/Divergence) indicator is a popular oscillator actively used by traders when working in the currency and stock markets to determine trends and to search for trading signals. This linear indicator allows obtaining a variety of trading signals: crossing the zero line; d

DotaScalping is a semi-automated trading system for scalping. The indicator shows recommended moments for opening Buy/Sell trades as dots on the chart. Signals are generated based on the algorithm for price amplitude smoothing. The indicator tries to accurately calculate the moments of the maximum peak price values and produces signals based on the smoothed correlation. The indicator determines the High and Low price values and generates signals based on the trend direction. The indicator is v

The Expert Advisor has been developed specifically for the features of the CHFJPY currency pair. The EA's algorithm determines the direction of the current trend and starts operation. In case of a price reversal within the current trend, the EA adds additional orders. If trend changes, the EA starts to work in the direction contrary to the initial grid of orders. If there were no conditions for closing orders and the trend direction changed again, the EA continues to work with the "first" grid o

Essentials for manual trading. The utility includes functions such as money management, automatic exits, hedging of positions, setting orders by date, OrderClose menu and others. Simple operation and clearly arranged, the tool works with one or more orders. Low tick rate compatible.
Features Display money management - right lot size is calculated from stoploss, account balance and risk appetite Scheduling of pending and market order - time based strategies or for preparing an order when the ma

Esnek EA, Alış/Satış sinyallerini ve TP/SL sinyallerini tetiklemek için özel göstergelerinizi EA'ya yükleyerek çalışır; ayrıca yerleşik gelişmiş ızgara, ortalama alma, izleme ve filtreleme sistemlerine sahiptir.
Çoğu zaman güzel bir gösterge yakaladınız ve grafiğinizde beliren güzel mavi ve kırmızı okları veya noktaları izleyerek, yalnızca bu göstergenin performansını görmek için geri test yapabiliyorsanız istediğiniz alım/satım sinyallerini gösterdiniz.
Bu hepimizin başına ve birçok kez ge
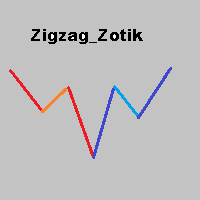
The Zigzag Zotik indicator displays the price movement in the form of a zigzag based on the AO_Zotik indicator values. The Zigzag Zotik indicator displays the trend movements and their corrections. The AO_Zotik indicator consists of three lines moving relative to "0": "main" line; "support and resistance" line; "balance" line. The "main" line crossing the "support and resistance" line indicates the end of one wave and the beginning of the other. The Zigzag Zotik indicator displays this on the ch
This indicator is based on Ichimoku kynko Hyo but personalized with We-Trading rules.
Ichimoku Trend Arrows As you can see, the indicator shows two types of arrows (signals): Big arrows to follow the big trends Minor arrows to re-enter on trend adding more trades With Ichi-Trend indi, you can follow the trend of the market. You can use it on Forex and on all CFDs and with all the fimeframe you like.
Parameters Main parameters help trader to setup Ichimoku value as: tenkan_sen - default valu

The CCI Dashboard is an information panel which allows you to have a global market vision through a Commodity Channel Index. CCI Dashboard analyzes and tracks all the actives you want to invest in. Take advantage of this useful dashboard where you can open in a few seconds the chart and quickly invest on it.
Main Features of CCI Dashboard Graphic panel that allows you to know the situation of many assets. 7 Different Commodity Channel Index situations to discover when an asset is overbought or

This Expert Advisor is based on a scalping strategy that uses the Bollinger Bands indicator . The Bollinger Bands indicator reflects the price overbought or oversold conditions, which help to identify the entry or exit points as well as possible trend break-downs. The Bollinger Bands consist of an upper band placed above, and a lower band placed below. The distance between the Bollinger Bands or the width of the bands/channels based on the volatility measure. The mechanism of this system is simi

This scanner shows the trend values based on crossovers of two moving averages for up to 30 instruments and 8 time frames. You can get alerts via MT4, Email and Push-Notification as soon as the direction of the trend changes.
Important Information How you can maximize the potential of the scanner, please read here: www.mql5.com/en/blogs/post/718074
You have many possibilities to use the scanner. Here are two examples: With this scanner you can trade a top-down approach easily. If two higher

This software will give you the possibility to do different things (both in live markets and in strategy tester) . You'll have at your disposal 5 operative panels, each one of these have buttons that let you interact easily at market:
1. Opened Orders Manager (screenshot 1): 6 buttons: Close all buy orders. Close all sell orders. Close all orders. Close all profitable buy orders. Close all profitable sell orders. Hedge orders. 2. Stop Orders Manager (screenshot 1): 2 informative sections: Nume

The Expert Advisor is able to trade on any financial instruments quoted in MetaTrader 4. To ensure this, it is necessary to monitor the correctness of settings. The trading logic is based on a series of pending orders. The full traded lot is composed of numerous small lots. Complex lot allows for a more precise control of the risk of the position volume, entering the market in parts. The advantage of the system of pending orders is that order trailing allows opening deals at more favorable price
This is a grid Expert Advisor. It has several trading strategies based on the MACD indicator. The virtual trailing stop, stop loss, take profit levels can be set pips, in the deposit currency or as a percentage of the balance. Depending on the settings, different orders may be opened for diversifying risks. Their closure can be either an oppositely directed or unidirectional basket of orders. The orders grid is adaptive, only market orders are used in it. If the price moves the distance of Order

This is a grid Expert Advisor. It has several trading strategies based on the Bollinger Bands and RSI indicators. The virtual trailing stop, stop loss, take profit levels can be set pips, in the deposit currency or as a percentage of the balance. Depending on the settings, different orders may be opened for diversifying risks. Their closure can be either an oppositely directed or unidirectional basket of orders.
The orders grid is adaptive, only market orders are used in it. If the price moves
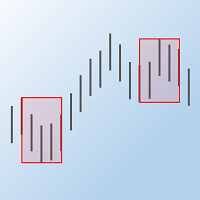
The "Max Min Prices" indicator determines the maximum and minimum prices between two candles within the trading day and shows them as rectangles on the price chart.
Indicator Parameters Start hour – hour of the start candle Start minute - minute of the start candle End hour – hour of the end candle End minute - minute of the end candle Rectangle lines type - style of the rectangle lines Rectangle lines width - width of the rectangle lines Rectangle filling - fill the rectangle with color Colou

This indicator is based on a combination of 2 different SuperTrend, a trend following indicator developed by Oliver Seban. You can find some implementation in the following pages: https://www.mql5.com/en/code/8268 https://www.mql5.com/en/code/10851 and others. Double ST indicator combines 2 different SuperTrends to have the trend direction at a glance. Simply insert the values for the 2 SuperTrends and you will see a ribbon with 3 different colors: red means that price is under both the SuperTre
A trend indicator based on the CCI indicator. ZI Trend PaintBar Indicator is an improved variant of the CCI indicator, which shows the moment of trend following quite accurately. Combination of CCI indicator makes a better use of these advantages: Colored candlesticks showing the trend direction based on CCI indicator. Messages/Sounds (Notifications and sound settings) Mail - enable/disable sending emails. Alerts - enable/disable messages in the terminal when signals occur. Push - enable/disable
Merlin Grid is a fully automated EA that uses a clever combination of grid, price action, fast scalping, smart filtering and artificial intellect (artilect) to determine profitable entry and exit points into the FX market. Merlin Grid is optimized and backtested over a period of 8 years (2010–2018). Download the free demo version and give it a run yourself. Visit Merlin Grid's blog for set files, news, updates, wish list, etc.
Characteristics FIFO compliance option. Price averaging of same kin

Introduction to Harmonic Volatility Indicator Harmonic Volatility Indicator is the first technical analysis applying the Fibonacci analysis to the financial volatility. Harmonic volatility indicator is another level of price action trading tool, which combines robust Fibonacci ratios (0.618, 0.382, etc.) with volatility. Originally, Harmonic Volatility Indicator was developed to overcome the limitation and the weakness of Gann’s Angle, also known as Gann’s Fan. We have demonstrated that Harmonic

Trend Control is a trend-following Expert Advisor that determines the trend direction and closes positions only at trend reversals. The EA is equipped with a minimum of the most necessary functions to simplify working with it. The EA is most suitable for working on the EURUSD currency pair and the M5 timeframe. The EA is suitable for both five-digit quotes and four-digit quotes. The EA is equipped with a Stop Loss. The EA does not use any risky systems which increase the volume or increasing the

Haber Robo Uzman Danışmanı, haber tüccarlarının haber bültenleri sırasında gizli zarar durdurma ile bekleyen emirleri açmasına yardımcı olmak için tasarlanmış güçlü bir araçtır. Alım satım deneyiminizi geliştiren ve alım satımlarınızı koruyan çeşitli özellikler sunar. News Robo'nun en önemli özelliklerinden biri, zarar durdurma işlemlerini piyasa yapıcı brokerlerden gizlemeyi tercih eden haber yatırımcıları için ideal olan gizli zarar durdurma özelliğidir. Kârlı bir pozisyona ulaşıldığında, zara

An indicator of round levels. A range of important price levels with sound and text alerts, which are generated when the current Bid price of a currency pair is equal to a round number. This indicator visually shows the trader true support and resistance levels, which are used by most of traders and trading robots. The advantage provided by this indicator is that the trader using this indicator on a chart does not need to draw any additional levels. Round price levels represent a certain barrier

This Expert Advisor is designed for working with all major currency pairs on all timeframes (M1-D1). Micro Martingale is a flexible concept of Martingale, which can work as Full Martingale (Average closing) or Martingale combined with trailing, stop loss and take profit, depending on parameter settings. Orders are triggered based on mathematical algorithms of price correction/reversal. The Expert Advisor will work better during high fluctuations.
Warning Martingale System is at high risk. For
This is a grid Expert Advisor. It features several trading strategies based on Moving Average. It works on minute bar Open prices. Virtual trailing stop, stop loss and take profit can be set in pips, in the deposit currency or as a percentage of the balance. Depending on the settings, different orders may be opened for diversifying risks. Their closure can be either an oppositely directed or unidirectional basket of orders. The order grid is adaptive and is made of market orders. If the price ha
This is standard ZigZag indicator with some cool additional features - colored range, amount of pips between highs and lows and also amount of candles between indicator range.
Default ZigZag indicator variables depthZigZag deviationZigZag backstepZigZag
Bullish market variables lineUpColor - line color lineUpStyle - line style lineUpWidth - line thickness textUpColor - color of text with amount of pips and candles textUpFont - font of text with amount of pips and candles textUpSize - size of
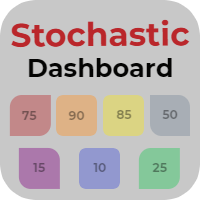
Stochastic Dashboard is an information panel which allows you to have a global market vision through a stochastic indicator. Stochastic Dashboard analyzes and tracks all the assets you want to invest in. Take advantage of this useful dashboard where you can open in a few seconds the chart and quickly invest in it.
Main features of Stochastic Dashboard Graphical panel that allows you to know the situation of many assets. 7 different stochastic situations to discover when an asset is overbought
This indicator is based on the Stochastic on one or more timeframes and on any Currency Cross Pair. The indicator generates an alert message when it detects a buy or sell signal. It also draws a vertical bar on the price chart: green for buy or red for sell, yellow if flat. Alert messages and Vertical bars for BUY or SELL, are generated when the Stochastic is consistent for all chosen timeframes else a FLAT signal is generated.
Features Easy flexible settings: Detection of the Stochastic signa

This Expert Advisor is based on a scalping strategy that uses Moving Average Envelopes Indicator . The Moving Average Envelopes indicator reflects the price overbought or oversold conditions, which help to identify the entry or exit points as well as possible trend break-downs. The moving average envelopes consist of an upper envelope placed above, and a lower envelope placed below. The distance between the moving average envelopes or the width of the bands/channels based on the volatility measu

SDX is our latest and most advanced dashboard for manual trading. The app is based on our proven grid platform and offers unique trading opportunities for both experienced and new traders. This unique combination of innovative tools is designed to simplify the trading process and to give you real advantage. The system is ideal for short term trend following, counter-trend trading and scalping on the Forex market.
Main Features Ability to work simultaneously with 10 pairs from one screen. Abili

The Momentum Channel indicator works according to the daily price index. The indicator is used to analyze the parity price. This analysis is done through channels. channels are used to find trend return points. The indicator has 3 channel lines. these are the lines at 30, 50, and 70 levels. The 70 level is the overbought territory. Price movements in 70 and above indicate that the chart will fall in the near future. Price movements at 30 and below indicate that the chart will rise in near future

TSO Bollinger Bandit Strategy is an indicator based on the Bollinger Bandit Trading Strategy as presented in the book Building Winning Trading Systems with TradeStation by G. Pruitt and J. R. Hill. SCANNER is included . Now with Scanner you can find trading opportunities and setups easily and faster.
Features A complete entry and exit strategy for trending markets. Get email / push notifications when an entry signal occurs. The indicator is not repainting. Can easily be used in an EA. (see For

SFO Trend Racer system is a trend indicator created by the CEO and Founder of " Simple Forex Options ", Tevin Marshall . It serves 6 different functions all in one. It shows the trader the entry signals as well as exit signals, whether it is a take profit or a stop loss. It also uses trend filters and signal confirmations so that the trader is able to make the most logically fit decision. Trend Racer uses various filters and specific settings from a plethora of indicators. The beauty in this ind

Compas - is a fully automatic intraday trading robot, that trades mainly in the Pacific session. The EA Compas is safe and trades one order with a fixed Stop Loss. EA Compas is suitable for investment accounts that require reduced risks. The performance of EA Compas should be evaluated over long distances.
The default settings are for GBPCAD M1
Setting For the operation to be correct, follow the instructions: To download the news list, it is necessary to add http://ec.forexprostools.com to

CCI Action Expert Advisor, CCI (Commodity Channel Index) Stratejisini otomatikleştirmek için tasarlanmış güçlü bir araçtır ve tacirlerin CCI düzeyindeki dokunuşlardan yararlanmalarına olanak tanır. Kullanıcı dostu ayarları ve güçlü risk yönetimi sistemi ile bu EA, CCİ göstergesini ticaret yaklaşımlarına dahil etmek isteyen tüccarlar için güvenilir ve verimli bir çözüm sunar. Bu Uzman Danışmanın en önemli özelliklerinden biri, tacirlerin ticari sermayeleri üzerinde kontrol sahibi olmalarına y

This panel is designed for quick visual search for the price action patterns on several instruments simultaneously. It is possible to add and remove instruments. Clicking the signal button allows you to quickly move to the chart with the identified pattern and timeframe. The panel searches for 8 candlestick patterns: PIN-BAR, EXTERNAL BAR, INSIDE BAR, DOJI, LEVEL, HIGH/LOW OF N BAR, FAKEY, ONE-WAY N BAR. Any of the patterns or the periods can be disabled by clicking its title. It can also search

Schrodinger trading machine is an Expert Advisor (robot) for any financial instrument on MetaTrader 4 platform. Both main input parameters (N and M) are optimized for EURUSD H1 . Of course, you are able to optimize these parameters for any currency pair and timeframe. For example, the main input parameters for GBPUSD H1: N = 5.0 and M = 12 The main input parameters N and M can be any positive numbers. These are input parameters (weight coefficients) of the one layer neural network. N is a double
The Moving Average Convergence Divergence Indicator (MACD) is both a trend–seeking and momentum indicator which uses several exponential moving averages set to closing prices to generate trading signals. We added several types of alerts to aid in your search for better opportunities in the market.
Product Features Email Alert Sound alert Push Notification (Alerts can be sent to your mobile phone) Signs on chart Alert box Possibility to work with both histogram and visual line Alert on zero his
"Balance cost" analysis method Created by Trader AFI_man. The BalanceLines indicator plots balance levels for a given time interval. The balance line divides the market volume into sellers (above the balance level) and buyers (below the balance level). In any movement, if the price is fixes above the balance level, there comes a moment when sellers are unable to hold off buyers, which leads to a growth. Similarly, when the price is fixed below the balance level, there comes a moment when buyers
GUME Simple Entry indicates the buy and sell entry points of all instrument by analyzing the market movement. It is designed to indicate entry points for any currency pair and all trading periods. It is optimized for M5 for scalping and M15 and higher periods for long term trading. It is also optimized for EURUSD, GBPUSD, GBPJPY, EURJPY and XAUUSD. It is designed to display a colored arrow up or down for buy or sell signal respectively for convenience and ease of use.
Indicator Parameters time
This specific indicator is designed to solve one specific problem : In case the connection to the broker's server is lost, remember when the connection was lost, and at what time the connection was resumed. Thus, the user sees the time when there was no connection to the broker's server . An Alert box is displayed on the screen, which records when the connection was lost and resumed. Of course, the indicator will not react to slight losses of packets. For better visualization of the indicator op
MetaTrader Mağaza, geliştiricilerin ticaret uygulamalarını satabilecekleri basit ve kullanışlı bir sitedir.
Ürününüzü yayınlamanıza yardımcı olacağız ve size Mağaza için ürününüzün açıklamasını nasıl hazırlayacağınızı anlatacağız. Mağazadaki tüm uygulamalar şifreleme korumalıdır ve yalnızca alıcının bilgisayarında çalıştırılabilir. İllegal kopyalama yapılamaz.
Ticaret fırsatlarını kaçırıyorsunuz:
- Ücretsiz ticaret uygulamaları
- İşlem kopyalama için 8.000'den fazla sinyal
- Finansal piyasaları keşfetmek için ekonomik haberler
Kayıt
Giriş yap
Gizlilik ve Veri Koruma Politikasını ve MQL5.com Kullanım Şartlarını kabul edersiniz
Hesabınız yoksa, lütfen kaydolun
MQL5.com web sitesine giriş yapmak için çerezlerin kullanımına izin vermelisiniz.
Lütfen tarayıcınızda gerekli ayarı etkinleştirin, aksi takdirde giriş yapamazsınız.