YouTube'dan Mağaza ile ilgili eğitici videoları izleyin
Bir ticaret robotu veya gösterge nasıl satın alınır?
Uzman Danışmanınızı
sanal sunucuda çalıştırın
sanal sunucuda çalıştırın
Satın almadan önce göstergeyi/ticaret robotunu test edin
Mağazada kazanç sağlamak ister misiniz?
Satış için bir ürün nasıl sunulur?
MetaTrader 4 için Uzman Danışmanlar ve göstergeler - 29

I make this indicator to help you for setting effective stoploss and getting more signals from following trends. This indicator helps to tell the trends and sideway, when 2 lines stand above of blue cloud, it means uptrend. When 2 lines stand above red cloud, it means down trend, the other else, it means sideway market. For taking order, you have to wait the arrows. You also need to see the cloud position, if the cloud's res, you have to wait the yellow arrow for selling order. If the cloud's bl
FREE

Product Overview
This tool is discretionary trading aid that executes a one-time entry when the conditions are set.
Action after the newest bar is fixed (opening action)
For example, there is no need to worry about being pruned by the shadow of the same price before that if you set it in the condition of when the closing price was broken.
It is not possible to set complicated conditions, and it is not designed for continuous automatic trading, but since it works after the time period
FREE

SYMBOL POWER based on inputted 5 time frames and Compared to 20 Other Symbols !! Great Indicator YOU DON'T HAVE TO SHIFT ON ALL TIME FRAMES FOR EACH CURRENCY PAIR TO CONCLUDE ITS TREND AND ITS POWER YOU HAVE IT ALL IN ONE TABLE , 20 CURRENCY PAIR WITH 5 TIME FRAMES ALSO , COMPARE BETWEEN CURRENCIES STRENGTH AND ALERTS THE STRONGER /WEAKER PAIR BASED ON 5 TIMEFRAMES CALCULATIONS ALEERTS enable /disable using 5 time frames M5 M30 H1 H4 and D1 ( latest version You SELECT you own 5 timeframes fr
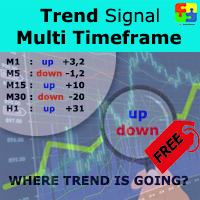
Free version. Only works on EURUSD. Do you want to always know in a quick glance where price is going? Are you tired of looking back and forth between different timeframes to understand that? This indicator might just be what you were looking for. Trend Signal Multitimeframe shows you if the current price is higher or lower than N. candles ago, on the various timeframes. It also displays how many pips higher or lower current price is compared to N. candles ago. Number N. is customizable The dat
FREE

This indicator shows in a subwindow the trend in M1, M5, H1, D1 timeframes based on MA, MACD, Stochastic This way you could see in once in different timeframes what happening. This is my first free indicator. Please follow I will put here some more. Thank you for you attention. . . . . .
lfknglkslksnlgslgnsflgjrpoesv ,msv lkrjpfjésmdg sd.npo4wsmdglknsp4jwpkeégmfs.lkmp Thank you
FREE

The indicator is based on the concept of price channels, which are formed by plotting the highest high and lowest low prices over a specified period of time. The Donchian Channel Indicator consists of three lines: an upper channel line, a lower channel line, and a middle channel line. The upper channel line represents the highest high over a specified period, while the lower channel line represents the lowest low. The middle channel line is the average of the two and can be used as a reference f
FREE

This indicator displays candle prices on the chart, colored in accordance with the data of the FATL digital filter built on closing prices. The indicator has no configurable parameters. Allows you to effectively follow the short-term trend. Usage: After the full formation of a candle colored in the opposite color to the previous candle, place a stop order at the high / low of such a candle. When the price overcomes such a high/low, a position will be opened. With the full formation of a candle p
FREE
Digital filters are (simplified) a way to smooth data. Unlike traditional moving averages, a digital filter will be more effective in most cases. The presented indicator displays in a separate window in the form of a line the data of several (optional) digital filters built at different (optional) prices. The presented indicator is a simplified version of the Digital Filters AM indicator. The indicator does not redraw on fully formed bars. The indicator allows you to effectively follow the trend
FREE

Indicator RS 24 Titanium is a multi-currency and multi-timeframe signal indicator created by the author's algorithm. Designed to quickly assess the trend (the mood of market participants) on all timeframes simultaneously, for a specific financial instrument. RS 24 Titanium scans readings from all timeframes for one financial asset and displays data in the form of a visual table. The indicator can be used with any broker (with 4/5-digit quotes). The received trading signals can and should be used
FREE
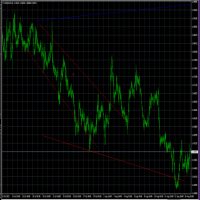
-It deletes all graphical objects on a chart. You choose the chart , then you execute the script on the chart. After the execution, all objects will disappear. Objects can be lines: trend lines, horizontal lines, vertical lines. They can be buttons, texts, labels , rectangles, edit boxes... parts of a panel. It executes fast within a second. You can use as many times as you want.
FREE

Due to policy changes in MQL5.com, we cannot continue our free trial program here. However, you can request to test our EA in live account though here . Limitless EA is a martingale based EA , which provide a lot of configuration to customize your martingale strategy to suit your personal risk profile . Trading Strategy Main characteristic of this EA: Martingale based strategy. Determine very short term trend as the aim is to get small profit on each trade. Open more trades to e
FREE

Indicators are professional data statistics, position orders, historical order analysis->>>>>> <This version is in Chinese -> English version please move> Necessary for traders: tools and indicators Waves automatically calculate indicators, channel trend trading Perfect trend-wave automatic calculation channel calculation , MT4 Perfect trend-wave automatic calculation channel calculation , MT5 Local Trading copying Easy And Fast Copy , MT4 Easy And Fast Copy , MT5 Local Trading copying For DEMO
FREE

The indicator searches for the largest candles with minimum wicks for the last X candles. Sometimes, such candles mark the presence of a strong buyer, who quickly and strongly pushes the price in the right direction. However, most often, these are culmination candles, especially at the end of a prolonged trend when a single large candle knocks out stop losses of the most persistent traders and the price reverses instantly. The indicator allows you to open a position on the very edge of the marke
FREE

Instant Trend Line this indicator has been designed for multi time frame
Buy Call: When the Blue Moving average (MA) line crossed above the Red Moving average (MA) . Sell Call: When the Blue Moving average (MA) line crossed below the Red Moving average (MA) .
Happy and profitable trade for ever!!! this indicator is suitable for all time frame, but our recommended time frame is above 15 min chart. Suitable to all the forex chart
FREE

The current Rise and Fall is judged from the Commodity Channel Index (CCI) of the three cycles and displayed in a panel by color coding.
The second and third of the three cycles are changed according to the correction factor multiplied by the first cycle (minimum cycle).
In addition, each CCI is displayed with ATR (Average True Range) corrected for variation.
When two of the three CCI are complete, Trend_1 is displayed. When all three are complete, Trend_2 is displayed.
// ---
Sq

This classic "old school" MAGIC MACD indicator gives you the cross of the parameters you set. Standart setting is (12,26,9) . The arrows give you a possible change of trend. Be careful and do not use this indicator as a single signal source.
FREE version Please feel free to check out our other REX indicator series. We do have other free indicators.
"OLD BUT GOLD"
FREE
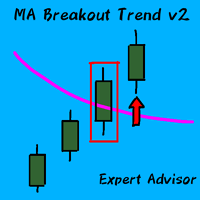
Hello guys! I want to share with you a very simple but effective expert advisor. As we know, simplicity is often the key to success :) NB: Set the quality of the video on YouTube at 720p The expert advisor is based on the breaking of a moving average, with the confirmation of the closed candle, and the possibility of adding a trend parameter that confirms the trend and avoiding false signals. Let's see the parameters:
TRADE PARAMETERS: Candle Shift Signal: this is the main parameter optimize.

Risepanel helps you open positions, close positions and analyze currencies. It works any time frame. For calculations to be correct, your account currency must be USD, EUR or GBP.
Features Market information. Orders and Pending Orders (Stop & Limit). 8 kinds of Pending by trend line. Specifications and Margin Calculation Required by Buy or Sell. Calculate and determine Stop Loss by pip, currency pair price, monetary value and percentage of risk. Calculate and determine the take profit by pip,

BBMA INDI https://www.mql5.com/en/users/earobotkk/seller#products This Indicator marks entry set-up for buy and sell. It will also send alerts when arrow forms, including via push notification to your mobile phone. It is very convenient when you want to be notified of the entry set-up while you are away from your chart. It also calculates maximum pips gained for each 1st set-up. Setting · You could choose two types of alert, pop-up desktop and push notification to your mobile phone. ·

The indicator measures volumes on different charts and instruments. Its main advantage is the ability to compare separate brokers. The less Middle Volume and Tick / Second , the more reliable is the broker. There is a comment in the upper left corner Comment data: Tick/Second — number of ticks per second for a selected instrument Middle Volume — average volumes in the penultimate bar This indicator allows tracking a relative market activity for different timeframes. If the volumes are lower than
FREE

SMOOTH STRENGTH METER INDICATOR (SMOOTH LINE) it draws Currencies TREND Volatility Power / Strength lines : - Detects the 2 highly TRENDED Volatile pairs ( will be the Bold Lines ) - A very Helpful Indicator - It draws smooth lines for up to 20 currencies pairs representing Volatility strength and power - First it indicates the most powerful trended direction pairs : Strongest / Weaker - MAIN FUNCTION :it gives indication of the UP trend most Volatile Line and the DOWN

The Envelopes Trailing Stop is a tool that implements trailing of the stop loss order after the price based on the Envelopes trend indicator. The utility provides all the necessary parameters for customization, which allows to select the optimal configuration for any user. The EA allows to choose the trailing line depending on the type of the trade. For example, buy trades can be trailed based on the lower line of the indicator, and sell trades can be trailed based on the upper line. The Magic p

YOU DON'T HAVE TO SHIFT ON ALL TIME FRAMES FOR EACH CURRENCY PAIR TO CONCLUDE ITS TREND AND ITS POWER YOU HAVE IT ALL IN ONE TABLE , 20 CURRENCY PAIR WITH 5 TIME FRAMES ALSO , COMPARE BETWEEN CURRENCIES STRENGTH AND ALERTS THE STRONGER /WEAKER PAIR BASED ON 5 TIMEFRAMES CALCULATIONS The Power meter currencies table is a very helpful tool to indicate the TREND strength of up to 20 currencies pairs using 5 time frames M5 M30 H1 H4 and D1 ( latest version You SELECT you own 5 timeframes from M1 t

This indicator draws strong price levels (price consolidation levels). The levels are plotted using 2 MA indicators and 1 MACD using a complex algorithm. The algorithm used in the EA is also in personal use.
These levels have 4 variants (colors of the variants can be customized): strong up, weak up, strong down, weak down. In turn, a weak level usually appears and then it can become strong. A strong level can also become weak. Version MT4: https://www.mql5.com/en/market/product/27

Ichimoku Cloud at a Glance (ICG) is an utility shows price vs cloud information for each timeframe at once. It works with any timeframe. Drop it to any chart and you will see where the price is currently at relative to the each timeframe' cloud range. You can switch the timeframe in the middle of the operation as well. There is a box and a letter under each timeframe caption. Box color - Blue : Price is above both Senkouspan A and B.(Above the cloud) - Yellow : Price is at between Senkousp
FREE
This indicator is based on the idea of a popular Trend Trigger Factor indicator (TTF). The indicator determines a price movement direction comparing high and low of the current candle with high and low of a price for a longer period.
The indicator parameters: Long_TTF_Bars - number of candles to calculate the price movement direction for a longer period of time (cannot be less than 2) Short_TTF_Bars - number of candles to calculate the price movement direction for a shorter period of time (can
FREE
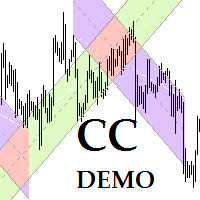
This program is for traders who plot price channels on charts. You just need to specify the width of the channel in the description of the trend line. Enter the "Description" field in the trend line properties and type canal: xxxxx without a space, where xxxxx is the width of the channel in pips. Channel color is set automatically depending on the channel width. The middle line of the channel is also automatically drawn. If the channel width is set to a positive number, the channel is drawn ab
FREE

The Scaled Awesome Oscillator (SAO) represents a refined adaptation of the Awesome Oscillator, aimed at establishing consistent benchmarks for identifying market edges. Unlike the standard Awesome Oscillator, which records the variation in pips across different commodities, the only unchanging reference point is the zero line. This limitation hampers investors and traders from pinpointing specific levels for trend reversals or continuations using the traditional Awesome Indicator, a creation of
FREE

Supporting file (2 of 2) for T3 Cloud MA
Trend indicator derived from T3 moving averages. The cloud is bounded by a fast T3 and slow T3 lines. Buying/Selling opportunities above/below cloud. The fast and slow T3 MA lines can also be used as dynamic support/resistance for more aggressive entries. Use default values for best settings. The number of look back bars is user defined. This indicator can be used in combination with other strategies such as price action. Suitable for all time frames. P
FREE
Fractals Direction ST Patterns MT4 is a modification of Bill Williams' Fractals indicator, which allows you to specify any number of bars for finding a fractal. In the settings, it is also possible to set the number of points for determining the trend direction. The upward direction is determined if the last upper fractal is higher than the penultimate upper fractal. The downward direction is determined if the last lower fractal is lower than the penultimate lower fractal. This simple indicator
FREE
UR Kontrol Paneli
UR Control Panel, sizinle ÜCRETSİZ olarak paylaşmak istediğim bir araçtır. Ticaretimde bana yardımcı olan ve her gün piyasa taramamı artıran etkileşimli bir Panel. Umarım ihtiyaçlarınıza da uygundur!
UR Kontrol Paneli nasıl kullanılır?
Hareket ettirilebilir, yeniden boyutlandırılabilir bir çift paneldir ve şunları içerir: - Bunlardan biri, verilen zaman dilimindeki para biriminin gücünü gösterir. - Diğeri, aynı grafiği kullanarak seçeneklerin semboller ve zaman dilimle
FREE

The Trend Venom EA is a fully automated Expert Advisor that trades based on Moving Average and RSI signals. The EA trades using market orders and uses averaging to safely turn otherwise negative trades positive. This EA works best on EURUSD using the M5 timeframe. A VPS is advisable when trading this system. Check the comments for back test results and optimized settings. Please note: I have made the decision to give this EA away and many more for free with limited support so that I can concentr
FREE

Non-proprietary study of Joe Dinapoli used for trend analysis. The indicator gives trend signals when the fast line penetrates the slow line. These signals remain intact until another penetration occurs. The signal is confirmed at the close of the period. It is applicable for all timeframes. Parameters Fast EMA: period of the fast moving average. Slow EMA: period of the slow moving average. Signal EMA: period of the signal line. ************************************
FREE
Trend Note Indicator Suitable for multi time frame market direction prediction. Blue and red color indicate the buy and sell call respectively. Blue indicator is denote buy call and Red indicator denote the sell call. Happy trade!! this indicator is suitable for all time frame, but our recommended time frame to use 1hour and 4 hours, suitable for any chart.
FREE
Daily Average Retracement Dashboard is an indicator that allows you to monitor multiple currency pairs at one time. This indicator is mainly for strategies that trade price retracement based on Resistance 3/4 or Support 3/4. After applying this indicator to the chart window, it will hide the chart and display the currency pairs in a table form. There are several data shown on the table that will help trader know when to analyze the currency and do trade using retracement. The indicator will only
FREE

This indicator does not process the price chart data and does not provide trading signals. Instead, it is an application to compute and display the frequency response of many conventional indicators. Moving averages like the SMA, LWMA and EMA, and oscillators like the MACD, CCI, Awsome Osc, all have the form of digital filters. Electronic engineers use a special method to characterise the performance of these filters by studying their frequency response. Two important quantities of the frequ
FREE
The indicator colors candlesticks of the price chart in accordance with the data of two CCI indicators from different timeframes. If both CCI indicators are above 0, the indicator paints the candle in the color that signals about price growth, and vice versa. The indicator allows to efficiently follow the trend, track short-term price rollbacks, and also to identify price reversals. The indicator does not redraw.
Settings CCI1_Period ( >1) - period of the fast CCI osc; CCI1_Price - price of th
FREE

HEDGING MASTER line indicator It compares the power/strength lines of two user input symbols and create a SMOOTHED line that indicates the degree of deviation of the 2 symbols Strategy#1- FOLLOW THE INDICATOR THICK LINE when CROSSING O LEVEL DOWN --- TRADE ON INDICATOR THICK LINE (TREND FRIENDLY) !! Strategy#2- TRADE INDICATOR PEAKS (Follow indicator Reversal PEAKS Levels)!! you input - the index of calculation ( 10/20/30....) - the indicator Drawing start point (indicator hi

X-axis lines prevail in grid manner, ruled by Average True Range. There’s an inevitable change in specific periods of time of this matter! The Average True Range (ATR) indicator is not directly based on volume. Instead, it measures volatility in price movements. It’ll stretch, expand, shrink, and evolve with 4 timely choices of grid states! MATR means “multiplying average true range” in which grandeurs the grid pip-distant levels, seeming to grasp a wave of perfectly synched parameters in ac
FREE
Or DBD%. The indicator consists of colored tape that shows trading signals depending on two Bermaui Deviation Oscillator (BD%) and two moving averages. Bermaui Deviation Percent is a volatility index that measures volatility in percent rather than points. The idea of BD% is to make an index depending on Classic Standard Deviation (CSD) that moves between 0 and 100 percent. Important Information
DBD% expert advisor example: https://www.mql5.com/en/blogs/post/731145
If you want to know mor

Trail every trade position twice, automatically, in Average True Range! All manual trades are given a predetermined Risk-Reward closing point, ruled by a calculated motive that'll adjusts to volatility, also known as volume! The ATR, or average true range, is a technical indicator that measures the volatility, also known as " Volume , " of a financial instrument by taking into account the price range over a specific period of time. Predetermination is made in regard to the matter of volatilit
FREE

The parabolic stop and reverse (PSAR) indicator was developed by J. Welles Wilder, Jr. as a tool to find price reversals which can be utilized as stop-loss levels as well as trade triggers. The notable difference about the PSAR indicator is the utilization of time decay. The PSAR indicator forms a parabola composed of small dots that are either above or below the trading price. When the parabola is below the stock price, it acts as a support and trail-stop area, while indicating bullish up t
FREE
A quick indicator with simple settings that does not take up much space in the working window and is displayed as simply as possible. The indicator analyzes the ratio of maximum and minimum prices for selected periods. Visually, the indicator is similar to its first version (Chainsaw AM), but a completely different principle is used for calculation. The indicator allows you to clearly determine the medium/short-term trend and support/resistance levels at points where the trend direction changes.
FREE

Hareketli Ortalamaları Çoklu Zaman Çerçevelerinde Geçmek.
Geleneksel bir trend stratejisi, trendi tahmin etmek için Günlük gibi bir zaman çerçevesi seçmek olsa da, bu uzman danışman, 5M'den Aylık'a kadar TÜM zaman dilimleri aynı trendi gösterdiğinde trend yönünde bir işlem başlatacaktır.
SINGLE_CURRENCY = true, tek bir para biriminde işlemlere izin verir, devre dışı bırakıldığında (FALSE), metatrader'da piyasa izleme penceresinde seçilen para birimlerinin ticaretini yapar.
CON
FREE

As simple to use it as any other moving averages, e.g. SMA , follows the trend and filters out the noise. Minimalist parameter set: Period: number of calculated bars; the larger, the smoother (default: 63, minimum: 4)
MA method: use LWMA or EMA (default: EMA)
Price: applied price (default: Typical)
Shift: shift right for prediction purpose (default: 0)
Although moving averages are fundamental to many technical analysis strategies, you ought to combine it
FREE
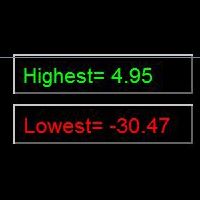
如果产品有任何问题或者您需要在此产品上添加功能,请联系我 Contact/message me if you encounter any issue using the product or need extra feature to add on the base version.
Indicator Floating Highest Lowest provides you an intuitive, and user-friendly method to monitor the floating highest (profit) and lowest (loss) that all your trades together ever arrive. For example, I opened 3 orders, which arrived at $4.71 floating profit when trade following trend. Later when the trend is against me, these 3 orders arrive $30 in los
FREE
The presented indicator is a trend indicator that displays with a colored line the current direction of price movement and the support/resistance zone in the form of a cloud. The indicator also marks points of change in price direction with arrows that appear after the bar is fully formed. The arrows are not redrawn. The rules for using the indicator are simple: We open a position when the price overcomes the high/low of the bar marked with an arrow in the direction opposite to the cloud. Arrow
FREE

The Infinity Expert Advisor is a scalper. When the resistance and support levels are broken, trades are opened in the direction of the price movement. Open positions are managed by several algorithms based on the current market situation (fixed stop loss and take profit, trailing stop, holding positions in case of trend indication, etc.).
Requirements for the broker The EA is sensitive to spread, slippages and execution quality. It is strongly recommended not to use the EA for currencies with

The Stochastic Basket Currency Strenght brings the Stochastic indicator to a new level. Expanding the boundaries of TimeFrames and mono-currency analysis, the SBCS take the movements of each currency that composes the cross and confront them in the whole basket of 7 crosses. The indicator works with any combination of AUD, CAD, CHF, EUR, GBP, JPY, NZD, USD pairs and with full automation takes in account every stochastic value (main line) for the selected Time Frame. After that, the indica
FREE

This is a trend following indicator that identifies optimal entry points in the direction of a trend with an objective stop loss to manage the trade. The indicator allows you to catch trend early and ride it. The Indicator draws resistance line as it detects an Uptrend and draws support line when it detects a Downtrend on the chart. When those levels are broken, that allows you to identify the Trend Direction and Momentum in the direction of prevailing trend which offers optimal entry points in
FREE

Fast T3 MA Trend indicator derived from T3 moving averages. This indicator is part of the T3 Cloud MA indicator and is posted here on its own. Buying/Selling opportunities above/below line. The MA line can also be used as dynamic support/resistance for more aggressive entries. Use default values for best settings. The number of look back bars is user defined. This indicator can be used in combination with other strategies such as price action. Suitable for all time frames.
FREE

Do you use dynamic ranges (like Bollinger Bands or Envelopes) in your trading? A fixed period is usually used for such calculations. But is such approach relevant to the very nature of the market? In fact, the price chart consists of a series of successive processes - trends and flats. In this case, we can talk about the internal development logic inside a single process only. Therefore, the nature of the market is better described by dynamic ranges designed for the processes occurring "here and
FREE
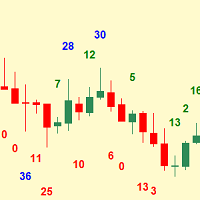
Simplest indicator for bar shadows. Very useful for Kangaroo Tail strategy.
"Shadows" - this is the distance from high and close of the bull bar and low and close of the bear bar. The purpose of the shadow is to show you if the bar is strong or not. Whether it is internal to the trend or is external. It even helps determine if a trend is starting. Input arguments: How many prevoius bars to calculate Value that should be passed to trigger the alarm How many times to repeat the alarm (Put 0 if y
FREE
This indicator allows you to identify a long-term trend and shorter-term price fluctuations. Indicator signals are given only after the full formation of the bar. The indicator can be used to trade any market. The indicator showed the most interesting results on major currency pairs for time periods of one hour or more. Its basic parameters perform well in most situations. At the same time, before starting trading, you should choose the most effective indicator settings for the user's trading st
FREE
Pattern Finder Demo is the free version of Pattern Finder , a MULTICURRENCY indicator that scans the entire market seeking for candlestick patterns in 15 different pairs/currencies all in one chart! This demo has all the functionality of the version on payment except the number of patterns at disposal that are lowered to 4 only (from 62). You can also filter the scanning by following the trend by a function based on exponential moving average.
Indicator parameters Alerts ON/OFF: Alert on scree
FREE

Introductory Pricing for one month
Brute force trader is specially designed to find the best entry point and exit point with the regular tested and proven indicators. The EA will automatically analyse the market and will follow trends with the right entry exit points. Since the timeframe it is using is 30 minutes, the chances that you are stuck into a long trade is very low. Thought it does not use stoploss but it has t
FREE
RSTL dpl AM - (Referense slow trend line - detrended price line) indicator built on the principle of searching for discrepancies between the current real price and the calculated trend value. RSTL - a digital filter that calculates the reference line, the overcoming of which by the current price is considered a change in the long-term trend. Indicator signals: Small red dot - the price continues to fall; Small blue dot - the price continues to rise; Big red dot - the price starts to fall; Big bl
FREE

The indicator helps to identify possible rollbacks and reversals. Shows the direction of the price movement and is painted in the appropriate color. Allows you to conduct trend and counter trend trading It works on all timeframes, on any currency pairs, metals and cryptocurrency Can be used when working with binary options Distinctive features Does not redraw; Simple and clear settings; It works on all timeframes and on all symbols; Suitable for trading currencies, metals, options and cryptocurr
FREE

InpRSIshort =13; // RSI short InpRSIPeriod =34; // RSI long PeriodRs =0; //Price 0C 4HL/2 5HLC/3 mafast =13;//mafast maslow =65;//MAslow
Double line RSI sub graph index. The parameters are adjustable. The RSI lines with two different cycles can be used to observe the trend strength effectively. Meanwhile, a short period cross long period color column image is displayed below. When the cycle (Jin Cha) is on the short cycle, the color of the column map changes from the light green to th
FREE

Trend Panel Limited is an indicator that allows you to know the trend of a pair in a given timeframe using 2 moving averages. You can modify the period of the moving averages. Allows you to select which pairs you want to monitor in the input parameters. You also decide in what time period you want to follow up. In short, TrendPanel gives you the possibility of knowing the trend of a pair in a certain period of time without having to change the chart. Version limitations: You can only select 2 pa
FREE

Lampropeltis is a trend indicator. The algorithm of calculation is based on data from the standard indicators included in the MT4 package and interpretation of patterns formed by these indicators. The settings include a minimum set of parameters: Slow MA - slow MA period; Slow MA method - slow MA smoothing method; Fast MA - fast MA period; Fast MA method - fast MA smoothing method. Change of the signal color to red indicates the possibility of opening a Sell order. Change of the signal color to
FREE
The indicator identifies the strength of the trend based on the points where the WPR indicator exceeds the overbought and oversold levels. The indicator does not redraw. This indicator:
Suitable for all markets; Not redrawn; Intuitive and simple; It can be useful for both beginners and experienced traders; Allows you to identify market entry points where there is a high probability of a significant price movement sufficient for a successful transaction; Settings: Ind_Period (>1) - period of
FREE
The indicator identifies the strength of the trend based on the points where the CCI indicator exceeds the overbought and oversold levels. This indicator: Suitable for all markets; Not redrawn; Intuitive and simple; It can be useful for both beginners and experienced traders; Allows you to identify market entry points where there is a high probability of a significant price movement sufficient for a successful transaction; Settings: Ind_Period (>1) - period of the indicator; Price - price f
FREE
The RSI S-RoC indicator differs from the standard RSI in that it takes into account the price rate of change when calculating values. When the price moves in a trend, the indicator produces good entry signals oncethe price touches its levels. The level values can be configured in the indicator settings. They can also be modified and adjusted directly in the indicator window. You can also set on a chart signal lines. Once they are crossed, the indicator will produce a sound alert or play a user
FREE

This indicator will turn the colors of your candles into a trend oriented colored showing 4 different colors based on two moving averages and the slope of the slow moving average. very powerful indicator for all periods of time showing you the direction of the trend to confirm your trades.
Green: Bullish
Dark Green: Bullish Weak
Light red: Bearish Weak
Red: Bearish
For more info:
https://linktr.ee/trader_1st
FREE
The indicator analyzes the difference between the current price and the standard MA data. The indicator is not redrawn on the formed bars. To confirm the signal of the indicator, it is necessary to wait for the price to overcome the high (for buying) or the low (for selling) of the bar where the indicator changed color. The indicator is easy to use and configure. The indicator is effective as an element of any trend trading strategy. Custom Parameters: MA_Period - MA period; MA_Shift - MA shift;
FREE

HighLow level Indicators Welcome to our page. here we are introduced here HighLow Level indicator which is the most profitable indicators in our trading life. Recommended Time Frame: M1/M5/H1 Suitable for all currency's This indicator is used to identify the lowest low and highest high level in all currency's to know the trading trends. Trade in the same trend to get the most profit
Happy Trading
FREE
This indicator uses digital filters to analyze data. The indicator colors the chart candles in accordance with the current trend.
Digital filters are (simplistically) a way of smoothing data. Unlike traditional moving averages, a digital filter will be more effective in most cases. This indicator allows you to identify the difference between the current price and its expected value calculated by an adaptive digital filter. Moments of divergence are moments of price movement that can be used to
FREE
Trend directional oscillator with additional flat filtering It helps to quickly navigate when changing the direction of price movement and is painted in the appropriate color You can conduct trend and counter trend trade It works on all timeframes, on any currency pairs, metals and cryptocurrency Can be used when working with binary options Distinctive features Not redrawn; Flat filtering - when the histogram is in the yellow zone; Simple and clear settings; It works on all timeframes and on all
FREE

The Adaptive Moving Average (AMA), created by Perry Kaufman, is a moving average variation designed to have low sensitivity to market noise and volatility combined with minimal lag for trend detection. These characteristics make it ideal for identifying the overall market trend, time turning points and filtering price movements. A detailed analysis of the calculations to determine the AMA can be found in MetaTrader 5 Help ( https://www.metatrader5.com/en/terminal/help/indicators/trend_indicators
FREE
MetaTrader Mağaza, ticaret robotları ve teknik göstergeler satmak için en iyi yerdir.
MetaTrader platformu için ilgi çekici bir tasarıma ve iyi bir açıklamaya sahip bir uygulama geliştirmeniz yeterlidir. Milyonlarca MetaTrader kullanıcısına sunmak için size ürününüzü Mağazada nasıl yayınlayacağınızı açıklayacağız.
Ticaret fırsatlarını kaçırıyorsunuz:
- Ücretsiz ticaret uygulamaları
- İşlem kopyalama için 8.000'den fazla sinyal
- Finansal piyasaları keşfetmek için ekonomik haberler
Kayıt
Giriş yap
Gizlilik ve Veri Koruma Politikasını ve MQL5.com Kullanım Şartlarını kabul edersiniz
Hesabınız yoksa, lütfen kaydolun
MQL5.com web sitesine giriş yapmak için çerezlerin kullanımına izin vermelisiniz.
Lütfen tarayıcınızda gerekli ayarı etkinleştirin, aksi takdirde giriş yapamazsınız.