YouTube'dan Mağaza ile ilgili eğitici videoları izleyin
Bir alım-satım robotu veya gösterge nasıl satın alınır?
Uzman Danışmanınızı
sanal sunucuda çalıştırın
sanal sunucuda çalıştırın
Satın almadan önce göstergeyi/alım-satım robotunu test edin
Mağazada kazanç sağlamak ister misiniz?
Satış için bir ürün nasıl sunulur?
MetaTrader 4 için Uzman Danışmanlar ve göstergeler - 171

Representation of the intercept value of the linear regression and the mean absolute deviation symmetrically to the intercept value.
PARAMETERS
• Periods: number of periods to calculate linear regression
• Amplitude: multiplier of the absolute mean deviation to define the bands
• Displacement: displacement on the horizontal axis
• AppliedPrice: price on which the calculations are made
• MainPlot: display of the main plot
• UpperPlot: display of the upper band
• Lowe

Hello This Indicator will draw Green (Up) and Red (Down) small arrows from Multi TimeFrames based in ( MACD ) to help you to take decision to buy or sell or waiting If there 4 green arrows in same vertical line that's mean (Up) and If there 4 Red arrows in same vertical line that's mean (Down) and the options contain (Alert , Mobile and Mail Notifications). Please watch our video for more details https://youtu.be/MVzDbFYPw1M and these is EA for it https://www.mql5.com/en/market/product/53352
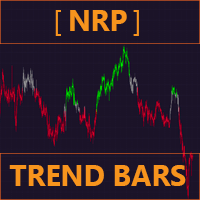
NRP Trend Bars
Your all-in-one Trend direction indicator, with Presets and Customisable options ! Get the most of Trends with NRP (No-repaint indicator) Trend Bars , designed to get the best of Trend Entries , Continuations and Reversals
One of it's function is the detection of the new trend starting , consolidation and possible trend change . It gives you the opportunity either to get in-&-out of the market in time
PRESETS (Sensibility)
LOW : Used for trend entries and confirming

Currency Strength Meters are a great way to identify strong and weak currencies. With this CSM indicator attached to your chart, you will get a clear overlook over the 8 major currencies: USD, EUR, JPY, CAD, CHF, GBP, AUD, and NZD.
Suggested timeframes to scan is: M15 - H1 - H4 - Daily You can however just change timeframe to check in the settings. Bear in mind that scanning very low timeframes such as M1 will require a lot of resources and might make your mt4 terminal slow.
The strength sca

Winner Overbought Oversold
Winner Overbought Oversold indicators are best suited for overbought/oversold analysis. Basically, there are two types of momentum oscillators: bound and unbound. Bound oscillators, such as this, fluctuate within a specific range. The most popular indicators used to identify overbought and oversold conditions are the relative strength index (RSI) and the stochastic oscillator . But you need a second conformation for entry and exit position from forex market. T
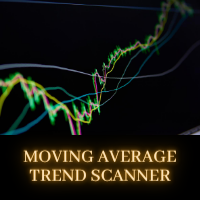
This is a brand new trend scanner for all of us that love to use different kinds of moving averages to define a trending market. This scanner is very useful and saves you a lot of time when you want to look for trending markets. In the scanner, you can choose to either use two different moving averages or three when defining a trend. Some like to use f. ex. the 50 EMA and the 200 EMA. If 50 is below 200 they will consider it a downtrend. Others like to use three moving averages. This can be e.
TrendRange Indicator works on M1, M5, M15, M30, H1 and H4 timeframes. It indicates real market trend, support and resistance levels. In other words, it confirms trade directions. Scalpers especially, Intraday, swing, intermediate and long term traders will especially find this indicator useful. It uses customized show/hide buttons namely: "DRAW", "HILO", and "LEVEL" lines crossings and histograms ("AWOS" for Awesome Oscillator, "BUBE" for Bull Power and Bear Power & "GATO" for Gator Oscilla
MA cross AKT (Traders Club)
機能: MAゴールデンクロスで買いサイン、デットクロスで売りサインを表示します。 MAの期間は入力できます。 MAの種類を選択できます。(SMA、EMA、SMMA、LWMA) 適用する価格を選べます。(CLOSE,OPEN,LOW,HIGH,MEDIAN,TYPICAL,WEIGHTED) サインをアラートで通知します。 サイン発生をE-mailやSNSで通知します。 MAクロスの勝率を表示します。 ローソク足の本数を変更することにより過去何か月かの MAクロスの勝率をすぐに確認することができます。 これは各時間足、各通貨で確認することが出来ます。 判定するローソク足を3か所選ぶことが出来ます。 ディフォルトでは5本目、9本目、14本目となっています。 サインの表示をボタンで表示したり消したりできます。 表示するサインを変更することが出来ます。

Very special indicator of Joe Dinapoli which is a derivative from traditional MACD indicator. It shows the precise price, at which MACD will show line crossing and trend shifting. Also, this level is known one period ahead of time.You can constantly reassess your current position by looking at this studying a variety of timeframes. When you are in a trade, you have a feel for how much time you have for the trade to go your way by looking at the distance between the MACD Predictor line and the

Very special indicator of Joe Dinapoli which is a derivative of a Detrended Oscillator. Through a set of parametric equations, a predicting oscillator is created that forecasts, one period ahead of time, overbought and oversold conditions. The resulting predictor values are expressed as bands on the bar chart, both above and below the market. It may be mistaken as a Bollinger Band but has no resemblance to it whatsoever. The Predictor bands may be used in a variety of ways to aid in entering an

DYJ GlobalTradeGridWarLaguerre, MA göstergesine dayanmaktadır. Herhangi bir döviz çifti ve zaman dilimi için kullanılabilir.
FastMA SlowMA'nın üzerine çıktığında uzun sipariş aç. FastMA SlowMA'nın altına düştüğünde kısa sipariş açın.
Ayrıca, yanlış sinyalleri filtreleyen Stokastik ve Laguerre'yi kullanır.
Şimdi geçmişin fiyat tablosu yerine para biriminin geleceğine oyun teorisi stratejisi uygulayacağız. Bu bir seviye daha yüksektir. Dinamik Piyasa oyun teorisi, Gelişmiş Para Birimi Sağlık Ç

Money Pies.
Общие сведения:
Что бы начать торговать, большой депозит не требуется.
Идеально подходит для быстрого подъёма депозита.
Работает на мультивалютной торговле.
Иммунитет к длительной задержке и величине спреда.
Принцип работы:
После запуска на графике запоминает уровень открытия первого ордера.
Выше уровня открытия первого ордера, выставляет сеть ордеров на Sell.
Ниже уровня открытия первого ордера, выставляет сеть ордеров на Buy.
Если общая прибыль ордеров на покупку и на пр
Ultimum Signal Indicator contains the most powerful buy,sell and exit signals. They can all be be separately turned on/off, so you decide what to display on the chart ! This is my ultimum inidicator that is a no-nonsense, no delay, no repaint indicator ! Signals : Target price levels :
Liquidity Pools (Liquidity voids, major supply/demand zones, and price discrepancies) Liquidity Pools Forecast Projection Market Reversals :
Reversal Blocks Pinbar groups Trend and mastertrend slowdowns (indicatin

The Nasbot Metatrader 4 Forex Robot is an algorithmic expert advisor that opens, exits and manages positions based on the Pivot Point cross overs. The logic that is used to define trade entries on The Nasbot EA is to buy when the Price Action is above the pivot. All timeframes will work on The Nasbot expert advisor but our preference falls on the 1- Hour chart. NOTE: The default settings in the EA should be left as is besides - inp33_Ro_Value Trade settings inp16_VolumeSize - This is the lot

The Robust filter indicator is based on the robust filtering algorithm developed by the author using the multi-period averaged moving median. The algorithm for this averaging is shown in the last screenshot. The indicator calculates and shows: 1. The direction of the trend; 2. Entry and exit points of positions; 3. StopLoss lines calculated from current price probability distributions and selected probability of closing an order by StopLoss before the trend revers

Introduction to Fibonacci Volatility Indicator Volatility indicator can help you to detect any statistical advantage for your trading. Especially, if you are trading with Price Action and Price Patterns, then we recommend to use the Volatility indicator together with your strategy. Especically, Fibonacci Volatility indicator combines the market volatiltiy with Fibonacci Analysis to provide you more advanced volatiltiy indicator. Main Features Fibonacci Volatility in Z score Configuration Mode Fi

Orions , an Expert Advisor, has implemented the best algorithms for trading from scalping and pipsing: filtering deals using the Gann and Elder methods from different time intervals when trading price momentum patterns from 5-minute charts of the instrument. This robot makes a lot of trades every month and filters out each of them using powerful analytical tools, but it is impossible to open so many trades per year and still not get a single losing day. If you do not agree with this, do not buy

The Pushing Trend indicator implements a kind of technical analysis based on the idea that the market is cyclical in nature. The indicator tracks the market trend, ignoring sharp market fluctuations and noise around the average price. It fixes the trend and shows favorable moments of entering the market with arrows. AND
Working with the Pushing Trend indicator is quite simple. Look at the arrows and determine the direction of work. The indicator can be used not only to fix the trend direction

The Trend Priority indicator can be used for both short-term pips and long-term trading. Works on all currency pairs and on all timeframes. When using it is recommended to look at the additional indicator of a filter of possible false signals.
Indicator shows signals for input. Displays both entry points and the trend itself. Shows statistically calculated moments for entering the market by arrows. When using the indicator, you can optimally distribute the risk factor.
Settings: Uses all one

Happiness in Forex Means Winning! What if we made your winnings "Steady Winnings!" This will make you happier! (Forex is risky, you may loose all your capital)
We implemented a safe and reliable strategy, that proved itself since 2010 until today! It passed COVID 19 fluctuations without any issues!
The idea behind the expert to to be a super scalping expert, attacking few pips at a time. This happens while using big lot size, thus insuring handsome profit.
Expert entries are very selective, w

RealProfit Expert works on currency pair USDJPY only! The Expert doesn’t use any additional indicators to open transaction. Trade is based on important levels breakthrough. The Expert has minimum quantity of parameters, for this reason it is ready for work immediately after it has been installed. The absence of additional parameters provides the possibility to use the Expert easily even by beginners. The Expert is suitable for long term investments over 1 year. You should take into consideratio
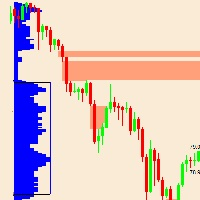
MT5 : https://www.mql5.com/en/market/product/53385
This indicator is based on market profile theory. What exactly is a singles area? Theory: Market Profile Singles : Singles or single prints or gap of the profile are placed in the inside of a profile structure, not at the upper or lower edge. They are represented with single TPOs printed on the Market profile. Singles draw our attention to places where the price moved very fast (impulse movements). They leave low volume nodes with liquidity
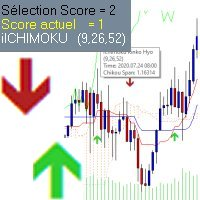
Indicator Ichimoku Arrows
to use with the Ichimoku indicator if you want to visualize. and very easy to use.
Use an arbitrarily chosen scale (to improve) to decide on the display or not of the signals according to their score. . the score takes into account -the positioning of the crossing of Kentan and kijun in relation to the cloud -if the chikou is above or below the course - the cloud trend. -the volatility of the movement. it is possible to select the display of the signals a

Introduction
What should be the Lot Size of our next trade ? is a very common and an important question. We don't want to burn our account by placing higher lots or neither want less profit by placing small lots even when we have capacity to place a reasonable lot size. The Risk Lot Calculator is a simple and efficient small tool that will assist your trading and help you choosing lot size by risking your account balance of your own choice. It will tell you how much lot size will risk your how

Lazer görüşü
Geri Test Et ve Haberlerle Optimize Et :D
Bir Pakette 5 stratejinin birleşimi.
1. Acı ve Kazanç ~ 2019
2. Sesli Scalper ~ 2019
3. Akıllı Forex Sistemi ~ 2022
4. Dalgalar ~ 2021
5. WicksKapalı ~2021
Bekleyen Konum Stratejisi (PPS) ve Gelişmiş Hassas Algoritma.
Lazer - Yerleşik Özel Göstergeler ve Strateji Analizinin Birkaç Kombinasyonunun Yanında Yerleşik Bir "Spike Algoritma Sistemi":
1. Trend Çizgisi Analiz Girişi.
2. Destek & Direnç seviyeleri,
3. Volatilite Analizi.

Our most popular indicator in our fleet of indicators. The POWR Trend Trader is the highest grossing manual strategy for trading on the market today. This indicator is upgraded with more Profit Points and also introduces Re-Entry alerts. The POWR Trend Trader (PTT) is our premier indicator! What this indicator can do for your profits is staggering! HOW TO USE The POWR Trend Trader has a Master Trend Meter at the bottom of the chart. We actually re-coded the main indicator that turns your candle

For sure, this indicator has become very popular amongst traders. Through coding this indicator will give you the most accurate levels possible for your trading analysis. We have also added in the ability for you to receive alerts when the price breaks above or below a Support or Resistance lines! HOW TO USE The red rectangles represent your resistance/supply zone. The green rectangles represent your support/demand zone. BONUS FEATURES We coded this indicator with the ability to switch between
Don’t overlook the power of this indicator. We took the time to find the best algorithm to pull the best momentum lines in the industry. We also coded in the orange stream to give you a quick glance at where the overall trend is heading. This indicator works incredibly well for Stocks, Forex and Crypto! HOW TO USE When the orange stream is heading down, this means you are in a strong downtrend. When the orange stream is heading up, this means you are in a strong uptrend. When the red lines start

For trading, the support and resistance lines for current price are everything. With the ability to adjust sensitivity, this indicator delivers just that! HOW TO USE The blue lines represent the most relevant support and resistance for the current price. You can adjust the sensitivity of the support and resistance lines by adjusting the input value under the indicator settings to show more or less support lines.

Angry Bull Option Binary
This is a Binary Options robot, which contains 7 strategies, you can backtest it to check what the best strategies are Settings Initial Batch Value Dynamic Investment = If activated it will use an automatic lot according to its capital Balance ($) w/ backtest = Starting balance to backtest PorcRiscoInvestment = It will be the value of % for the automatic lot if it is activated Expiration (in minutes) = It will be the expiration time of orders in Binary Options Magic

The indicator scans for stop grabber (special pattern of Joe Dinapoli which gives very high probability buy / sell signals and does not repaint ) signals in multiple timeframes for the all markets filtered and shows the results on Dashboard.
Key Features Dashboard can be used for all markets It can scan for stop grabber pattern on MN1, W1, D1, H4, H1, M30, M15 ,M5, M1 timeframes Parameters UseMarketWatch: Set true to copy all symbols available in market watch MarketWatchCount : Set the number

The Squat is a function of the range of a given price bar and the volume, or TIC volume, that occurs while that range is being created. The basic idea is that high volume and little price movement indicate substantial support or resistance. The idea behind the approach to this indicator is to first look for likely Fibonacci support and resistance and then see if Squat manifests when that point is reached. The indicator determines one of the high probability patterns of DiNapoli. It does not re

EA indicators.
MACD: Detects the market trend. Moving Average: It works as supports for purchases and resistances for sales.
EA currency. You can operate any currency with 5 digits after zero comfortably although I recommend using only
EURUSD
How does it work.
It uses an algorithm based on the probability of the change of variable, this means that we buy-sell continuously, increasing the lots in case of loss. From here we begin to buy probability, so I like to call the task that algorith

Expert system Comets goes through the whole history and all currency pairs with one single setting. The more delay your broker has in the amount of the Internet channel, the higher you need to set stop loss, take profit, and trailing stop so that the server can process them at the required price and the lower the trading frequency will be.
Expert Advisor - works using sharp tick movements. The uniqueness of the Expert Advisor is that it can be run on any hourly period, on any currency pair and

The indicator monitors the MACD trend in multiple timeframes for a specific market. No more shifting in between charts to check the trend direction while trading.
Key Features Indicator can be used for all markets Monitors every timeframe, from M1 to MN Able to move display label on chart by single click
Indicator Usage The dashboard appears to the left and upper part of the chart when attached. The shell encapsulating a timeframe goes red on a down trend, green on an up trend. If the default

The indicator monitors the Dinapoli MACD trend in multiple timeframes for the all markets filtered and shows the results on Dashboard.
Key Features Indicator can be used for all markets Monitors every timeframe, from 1 Min to Monthly
Parameters
UseMarketWatch: Set true to copy all symbols available in market watch MarketWatchCount : Set the number of symbols that you want to copy from the market watch list. CustomSymbols: Enter the custom symbols that you want to be available in dashboard. Ti

The Vkids Trend indicator displays the trend direction with colored bars, works in a simple and visual way. It uses a combination of reliable and simple indicators for price analysis. The graph is presented in the form of blue and red histograms. Red bars indicate a buy signal, blue bars - a sell signal. The graph is not redrawn during operation.
The signals of the Vkids Trend indicator can be interpreted as follows: Buy when the bars are blue and sell when they are red. The advantage of the i

The Dawn Trend indicator is not prone to redrawing or any other type of erroneous display. Sharp price fluctuations, as well as noise around average prices, are ignored.
Perhaps, trend indicators can be called the main ones, since classic trading involves looking for trends. Many classics of trading in financial markets have developed their systems specifically to search for market trends.
This indicator embodies the implementation of a trend indicator. Which fixes a certain direction of chan

The indicator scans for Dinapoli thrust pattern in multiple timeframes for the all markets filtered and shows the results on Dashboard. Key Features Dashboard can be used for all markets It can scan for thrust pattern on MN1, W1, D1, H4, H1, M30, M15 ,M5, M1 timeframes Ability to choose number of bars required above/below displaced moving average to define thrust Parameters
UseMarketWatch: Set true to copy all symbols available in market watch MarketWatchCount : Set the number of symbols that
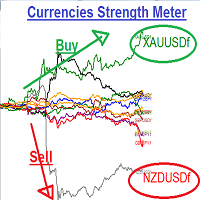
Currencies Strength Meters
:::: It is programmed to work on any M5 Chat windows !! Used to determine the Strongest currency pairs and the Weakest pairs also detect the peak of deviation of currencies strength IT CAN BE USED FOR INDICES AND STOCKS TOO !! Strategy one : It can be used in to BUY Strongest pair and SELL Weakest one Strategy two: It can be used on Daily basis to Hedge BUY Strongest pair with high % (ex: +1%) and BUY Weakest one with % lower(ex: -0.7%) the same with SELL Strategy t

Utility for know the performance of your acoount. From dialog you can filter data in this modes: - You can include or not include the open positions
- You can include or not the closed positions
- You can filter the data by date (from, to)
- You can filter the data by simbols (multi selection)
- You can filter the data by magic number (multi selection) On bottom of table, are show the total of: - Number of data
- Total size
- Total commissions paid
- Total swap paids
- Total profits
- Total net

The trading Expert Advisor's strategy is based on one of the most powerful technical analysis signals - the Pin Bar.
When determining this figure, a trading expert studies the current market situation and, if there is a combination of certain factors, it starts working.
It is recommended to start working with a small trading lot . As you become familiar with the work of an expert, the trading lot can be increased (use money management) to a psychologically acceptable size.
Attention : the fo

The strategy of the Expert Advisor is based on one of the strongest signals of technical analysis - Engulfing .
When determining this figure, a trading expert studies the current market situation and, if there is a combination of certain factors, starts working.
It is recommended to start working with a small trading lot . As you become familiar with the work of an expert, the trading lot can be increased (use money management) to a psychologically acceptable size.
Attention : the format of
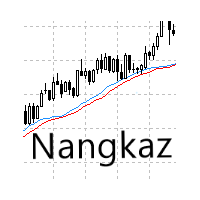
Technical analysis based on indicators Moving Average, ATR, Candle bar and Volume.
From manual trading to auto trading.
Sometime win, sometime loss too..
prefer frame time M1
Conditions of Generation of Signals Buy
1. Close prices of the analyzed bar is above the Slow Moving Average indicator.
2. Fast Moving Average indicator is above the Slow Moving Average indicator.
3. Volume value of the analyzed bar is above X.
4. ATR value of the analyzed bar showing rising.
5. Price close of the analyzed

An adaptive and under fitted trading system like no other The best settings of one symbol also work on a majority of other symbols The majority of settings within the optimization parameters test well Deep Takeover MT4 now comes with a 2nd EA for free : "Agility" EA! See comment section for details Three versions for different types of accounts This MT4 version respects FIFO rules The MT5 netting version : https://www.mql5.com/en/market/product/52725 The MT5 hedge version : https://www.mql

BB RSI Robot is made for any level of users: Beginners can use it as it is, Experts can fully customize it.
Bollinger Bands and RSI based algorithms for autotrading: it follows 3 Bollinger Bands and RSI levels and places orders with all values computed when the algorithm gives a green flag. Order values use algorithms for risk management per trade and pips calculator. Each placed order is closely followed to be modified if more accurate Take Profit value is computed.
BB RSI Robot is fully

Dollar mint indicator is a special workmanship with years of experience in forex.
Dollar mint ea is a fully non repaint indicator optimised with price action data such that once it gives you a signal t . The indicator can be used to trade anything on the mt4 with much ease.
Benefits ;
Fully non repaint Use in any timeframe Use in all the available tradable assets on mt4
Best to use on h4. It generates fully analysed buy and sell signals based on trend and also filters out retracements and

Hello This Indicator will draw Green (Up) and Red (Down) small arrows from Multi TimeFrames based in ( RSI ) to help you to take decision to buy or sell or waiting If there 4 green arrows in same vertical line that's mean (Up) and If there 4 Red arrows in same vertical line that's mean (Down) and the options contain (Alert and Mobile , Mail Notifications). Please watch our video for more details https://youtu.be/MVzDbFYPw1M and these is EA for it https://www.mql5.com/en/market/product/53352

Hello This Indicator will draw Green (Up) and Red (Down) small arrows from Multi TimeFrames based in ( Ichimoku ) to help you to take decision to buy or sell or waiting If there 4 green arrows in same vertical line that's mean (Up) and If there 4 Red arrows in same vertical line that's mean (Down) and the options contain (Alert and Mobile , Mail Notifications). Please watch our video for more details https://youtu.be/MVzDbFYPw1M and these is EA for it https://www.mql5.com/en/market/product/533

In the third screenshot (Daylight Mode) I have marked 7 elements that we are going to explain step by step.
1 Three buttons.
a) Night Mode
b) Daylight Mode
c) Fixed scale / Adjusted scale
2 Four buttons.
a) Draw a buy arrow, buy line and the corresponding Stop Loss based on ATR.
b) Close the previously drawn buy and drows a check mark.
c) Draw a sell arrow, sell line and the corresponding Stop Loss based on ATR.
d) Close the previously drawn sell and drows a ch

Principle of operation The EA's algorithms are based on the method of amplitude-phase modulation of signals of different timeframes. The EA has a block structure and the ability to add an unlimited number of algorithms for open and close.
Main advantages Attention! Before starting, be sure to download the preset files - given at the end of the description.
Advisor Launch checks and notifies about the availability of automated trading it works in the mode of opening minute candles, which a

A unique trading strategy is based on controlling trading volumes at various levels of volatility. The trade expert automatically determines the zones of purchases and sales and the degree of mathematical probability of successful forecasting of each transaction. If there are sufficient conditions and a high degree of probability of profit, the adviser starts work. Hazardous trading methods are not used. Each trade is protected by stop loss. Profit control is carried out by a special strategy f

Smart Trendline Order is an EA to set pending orders using Trendline from your chart. Main Features: 1 . Create Invisible or Visible pending order. Visible pending order means, it will open BuyLimit/SellLimit/BuyStop/SellStop and update the OpenPrice along the Trendline. 2 . Identify BuyLimit/SellLimit/BuyStop/SellStop if you change line direction above or below running price. 3 . Delete previous pending order and open new pending order if you change line direction above or below running price.
Are you tired of drawing Support & Resistance levels for your Quotes? Are you learning how to spot Support & Resistances? No matter what is your case, Auto Support & Resistances will draw those levels for you! AND, it can draw them from other timeframes, right into you current chart, no matter what timeframe you are using...
You can also Agglutinate regions/zones that are too much closer to each other and turning them into one single Support & Resistance Level. All configurable.

Indicator without redrawing Divergent MAX The DivirgentMAX indicator is a modification based on the MACD. The tool detects divergence based on OsMA and sends signals to buy or sell (buy|sell), taking into account the type of discrepancies detected.
Important!!!! In the DivirgentMAX indicator, the optimal entry points are drawn using arrows in the indicator's basement. Divergence is also displayed graphically. In this modification of the MACD, the lag problem characteristic of its predecessor i

Excellent dashboard for market analytics. The panel helps to analyze the values of the RSI indicator and its signals.
With this panel you can: watch the current signal from RSI on all timeframes; watch the current signal from RSI by different symbols; watch the current RSI value; several types of signals for analytics.
Values in a table cell: RIS value.
Signal type: RSI crosses level buy out/level sell out (outside); RSI crosses level buy out/level sell out (inside);
RSI is upper/l

Sprout
Можно начинать с небольшого депозита.
Отличный вариант для разгона депозита.
Для мультивалютной торговли.
Невосприимчивость к большой задержке и величине спреда.
Принцип работы
После запуска на графике запоминает уровень открытия первого ордера.
Выше уровня открытия первого ордера, выставляет сеть ордеров на Sell.
Ниже уровня открытия первого ордера, выставляет сеть ордеров на Buy.
Если общая прибыль ордеров на покупку и на продажу превышает значение параметра Profit, консультан
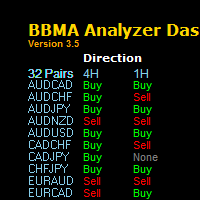
" The one of keys to trading success is a System Technique , MUST HAVE THIS SYSTEM!"
BBMA Analyzer Dashboard
BBMA is a popular technique that uses a combination of 2 indicators in MetaTrader 4 or MT4 which using Bollinger Band and Moving Average Indicator. Summary of BBMA Techniques has the basic elements:
RE-ENTRY
Formed after fall or price increase.
Price will form a Sideway to enable Re-Entry. CSAK (Strong Direction Candle)
The strong direction candle is a close candle direction above

Limitless MT4 is a universal indicator suitable for every beginner and experienced trader.
works on all currency pairs, cryptocurrencies, raw stocks
Limitless MT4 - already configured and does not require additional configuration
And now the main thing
Why Limitless MT4?
1 complete lack of redrawing
2 two years of testing by the best specialists in trading
3 the accuracy of correct signals exceeds 80%
4 performed well in trading during news releases
Trading rules
1 buy signal - the ap

The Expert Advisor identifies the most probable direction of the price based on the divergence of volumes and consolidation of prices in the overbought/oversold areas. Filtering for opening trades is carried out by using a unique formula for calculating the price level - "magnet" (based on the Ichimoku indicator), where the price is highly probable to come within a few bars in the future. The EA contains a minimum of settings, which facilitates its usage. Recommended symbols: EURUSD 15m ; GBPUSD

Rebalance Overlay Technology (Rebolt) enables the trader to visualize the flow of money from one chart to another chart. Rebolt Probability indicates the probability that money has flowed from one chart to another chart for a specified length of time over a number of intervals specified by the user. When Rebolt reads Cyan or Blue these are buying signs good for the length of time specified by the user or until a conflicting signal arises.
When Rebolt reads Violet or Red there are selling signs g

Excellent dashboard for market analytics. The panel helps to analyze the values of the Ichimoku indicator and its signals.
With this panel you can: watch the current signal from Ichimoku on all timeframes; watch the current signal from Ichimoku for different symbols; watch the current Ichimoku value; several types of signals for analytics.
Values in a table cell:
Value of Tenkan-Sen Value of Kijun-Sen Value of Senkou Span A Value of Senkou Span B Value of Chikou Span Span A - Spa

The Expert Advisor identifies the beginning of a wave movement and starts working according to the direction of the new wave. It uses tight stop loss and take profit. Built-in protection against spread widening. Control of profit is performed by the tight trailing stop feature. Lot calculation is based on stop loss. For example, if stop loss is 250 points and MaxRisk = 10%, the lot size will be calculated in such a way that triggering the stop loss would lead to a loss equal to 10% of the deposi

The trading expert "Space Reptile" was developed on the basis of three trading strategies that were tested on PAMM accounts and showed high performance.
Algorithms for determining the phases of a trend direction allow a trading expert to accurately enter the market in the right direction.
The built-in profit and loss control mechanism ensures stable profit superiority over losses.
Each transaction is accompanied by a mandatory stop loss and take profit.
The expert’s strategy does not provid
The Expert Advisor is a trend scalper. The martingale is not used. The strategy is based on defining the volatility level change as compared to a certain time period in the recent past. When a price movement becomes unusually active within a certain time period up to this point, the EA begins its work. A simple Moving Average serves as a movement direction filter. The EA settings allow limiting its operation during spread and slippage expansions. A trading lot is calculated depending on a stop

Planned Channel is a non-repainting channel indicator based on moving averages. The Planned Channel takes into account not simple moving averages, but double-smoothed ones, which, on the one hand, makes it possible to more clearly determine the market movement, and on the other hand, makes the indicator less sensitive. The key difference between the Planned Channel indicator and other channel indicators (for example, from the same Bollinger) is that the indicator displays more valuable signals f

The Reflex indicator is very easy to use, this is the key point. The indicator forms arrows (red and blue by default) and is installed in the usual way on any trading symbol with any time interval.
It is a trend and trading signal indicator based on the principle of combined analysis of calculated pivot points within a channel as well as overbought and oversold levels.
Indicator advantages High accuracy; Work with any trading symbols; Works at any time intervals; Not redrawn. Input parameters

The EA uses a unique non-linear formula for calculating market entry points and a unique algorithm for fixing the result of work.
The trading expert does not use the increase in the volume of transactions to block unprofitable positions.
Mandatory take profit and stop loss levels are used. Support: https://www.mql5.com/en/channels/TrendHunter The adviser controls the spread increase by the broker and skips trading until the spread returns to its "normal" values.
The best results are achieved

Ready to save big? All items are $30 for limited period.
Fast, Reliable, and Any (broker or symbol) to Any (broker or symbol) Trade Copier Solution. The Copied trades will be having your custom comments: Its very common problem in existing copiers that if symbol names are totally different in Master (Provider) and Slave (Receiver) Account then the existing copiers doesnt work. In this copier you will not face such issue and you can copy any symbol name to any symbol name. For Example: Your

Scalper Tick Manager It serves a large number of pairs, the more movement there is in the currency pair, the better it works, recommended pairs. EURUSD, GBPUSD, GBPJPY, USDJPY.
I tried it on other pairs and it works well too, but for now I recommend doing the test on the recommended ones. The EA, It is not king-size gala, It is not an unnecessary high risk system, You can see it for yourself, the DDs are very low, in normal conditions they do not exceed 10%. Recommended Spread Try testing the
MetaTrader mağazası, geliştiricilerin alım-satım uygulamalarını satabilecekleri basit ve kullanışlı bir sitedir.
Ürününüzü yayınlamanıza yardımcı olacağız ve size Mağaza için ürününüzün açıklamasını nasıl hazırlayacağınızı anlatacağız. Mağazadaki tüm uygulamalar şifreleme korumalıdır ve yalnızca alıcının bilgisayarında çalıştırılabilir. İllegal kopyalama yapılamaz.
Alım-satım fırsatlarını kaçırıyorsunuz:
- Ücretsiz alım-satım uygulamaları
- İşlem kopyalama için 8.000'den fazla sinyal
- Finansal piyasaları keşfetmek için ekonomik haberler
Kayıt
Giriş yap
Gizlilik ve Veri Koruma Politikasını ve MQL5.com Kullanım Şartlarını kabul edersiniz
Hesabınız yoksa, lütfen kaydolun
MQL5.com web sitesine giriş yapmak için çerezlerin kullanımına izin vermelisiniz.
Lütfen tarayıcınızda gerekli ayarı etkinleştirin, aksi takdirde giriş yapamazsınız.