YouTube'dan Mağaza ile ilgili eğitici videoları izleyin
Bir alım-satım robotu veya gösterge nasıl satın alınır?
Uzman Danışmanınızı
sanal sunucuda çalıştırın
sanal sunucuda çalıştırın
Satın almadan önce göstergeyi/alım-satım robotunu test edin
Mağazada kazanç sağlamak ister misiniz?
Satış için bir ürün nasıl sunulur?
MetaTrader 4 için Uzman Danışmanlar ve göstergeler - 114

The main objective of the indicator is an accurate forecast of short-term trends. A rising channel is usually broken downwards and replaced with a falling one when confirmed by tick volumes, while a falling one is usually broken upwards and replaced with a rising one again when confirmed by tick volumes. Sometimes, upward and downward channels are replaced with flats. A channel width and duration are defined by the market situation and market phase (bullish or bearish). In our case, tick volumes
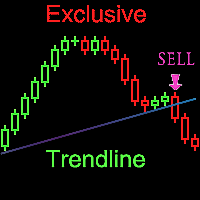
Every experienced trader knows that the trend lines should be paid attention in Forex trading. But plotting trend lines takes time, and there can be many of them on the chart as well... Yikes!!! Do you want to know how to easily and simply automate this process? Then read on. There is a solution - a smart and reliable indicator of trend lines - the Exclusive Trendline . All you need to do is attach the indicator to the chart, and it will draw all possible trend lines for you. You just have to ad

Super sniper is the indicator that you're looking for This indicator has an active signal that also able to send push notification to your mobile MetaTrader 4 (see the screenshot for tutorial), so you won't miss any signal during active market. The signal is very simple, " down arrow " for sell and " up arrow " for buy. There are several options as below _SEND_NOTIF_TO_MOBILE: to enable push notification to your mobile MetaTrader for signal _ALERT_SIGNAL: to enable alert signal _SHOW_EMA_TREND:

WaveTrend Momentum Oscillator is an upgrade to the popular and easy-to-use WaveTrend Oscillator. The WaveTrend Momentum Oscillator adds a momentum component to the original WaveTrend calculation, in order to provide faster and more accurate entry points during trendy market conditions. Do you prefer the original WaveTrend Oscillator? The WaveTrend Momentum Oscillator allows you to switch between momentum and original WT versions. Both provide valuable information depending on the market conditio

Professional Trend Convergence/Divergence Indicator TCD indicator is based on the Convergence/Divergence of Trend and shows you " up trend " (when trend grows) and " down trend " (when trend is falling).
In the middle is an adjustable "stop area" on which you cannot trade.
Briefly, the TCD shows you when to start or stop buy/sell .
TCD indicator can run many instances, for all time frames and includes all 0 lag MAs . (Please see MAi indicator code section)
With TCD your trading becomes more

RSI EA Revolutionize Your Trading with Our Cutting-Edge RSI E Expert Advisor Tired of spending countless hours analyzing charts? Our advanced Expert Advisor, powered by the robust RSI E indicator and equipped with a sophisticated trailing stop loss feature, offers a fully automated solution to your trading needs. Key Features: * Fully Automated Trading : Set it and forget it! Our EA executes trades based on precise signals generated by the RSI E indicator. * Advanced Risk Management : Protect yo

AMD Trend Risk Reward is an indicator which belongs to the group of trend indicators. It provides the possibility to take the correct decisions about timely market entrances or exits. Trend horizontal can cause a lot of headaches to the traders and can be the reason of money loss. By automatic optimizing the settings of our AMD Trend Risk Reward indicator you can avoid most of them and save your money. How to choose the best chart? Press the button [O] on the chart. Indicator automatically optim
Professional 0 Lag MAs Trend Sensor Indicator MAtsi is a trend sensor indicator , where 2 MA-s operates simultaneously .
It is designed to cover a wider range of dynamic trends, where MAi is not so effective.
Included averages are described in MAi indicator code section.
MAtsi indicator can run many instances, for all time frames at once, so you can test and compare results with different settings.
It is very fast and has, like all our indicators, a built-in " slider history testing " techn
The indicator determines and plots price channels or lines, reading information from multiple timeframes (from current, second and third) simultaneously. Color and width of lines for each timeframe can be customized. It is also possible to set different distance between the Highs and Lows for plotting channels or lines.
Parameters History - maximum number of bars to plot channels or lines; Distance - minimum distance from one High (or Low) to another when plotting lines; Shift - shift for seve

Professional 0 Lag Moving Averages Indicator MAi Indicator is a complete of moving averages with no lag .
With MAi you can finally trade in real time with no lag, so your trading becomes more precise, realistic and more effectively.
Please see included averages and the combinations with “Hull” equation below in code section.
MAi indicator can run many instances , for all time frames at once, so you can test and compare results with different settings .
It is very fast and has like all our in

SuperTrend Alerts adds alerts to the widely popular SuperTrend indicator. As the name suggests, SuperTrend is a trending indicator which works best in trendy (not choppy) markets. SuperTrend is extremely popular for intraday and daily trading, and can be used on any timeframe. Place a call when the price closes above the SuperTrend line, and place a put when the price closes below the SuperTrend line. These crossovers are highlighted by non-repainting up/down arrows.
Alerts Email, message and
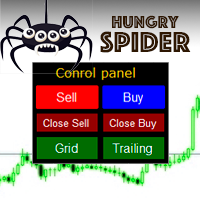
Hungry Spider EA is a convenient trading panel and a useful assistant to manage your trades and to set a grid of orders ( not pending orders ) with a push notification option.
Hungry Spider is a trading panel to help you save time while trading. The EA does not open orders, but it sets a grid. The grid then opens at actual prices without using pending orders. The grid can be turned on and off in a single click. The EA includes a Trailing Stop function, which can also be activated in a single cl

Automate your charting with the All-In-One SRES channel indicator. This is a complete package designed to address 3 questions: (1) when to enter a trade, (2) what is a good exit point, and (3) what is the probabilistic likelihood of success of the trade. Longevity and Flexibility : The All-In-One SRES calculates and charts S upport, R esistance, E xpected range, and a S queeze channel, and is enormously flexible for many trading strategies. Each option is customizable to fit your strategy, and c

Simple and powerful CSM (Currency Strength Meter) Currency strength meter is the indicator you need to identify the current actual trend based on a unique calculation, which is generally used as another fundamental analysis for those who are not capable of reading the fundamental clearly. Currency strength meter will read the current strength of related currency pair (Forex) where generally consist of AUD, NZD, CAD, CHF, JPY, EUR, GBP, and USD for the main major currency.
Feature Easy reading

The EA can trade multiple currencies. Please check our signals ( https://www.mql5.com/en/users/ugur-edin/seller ) for detailed information. No grid or martingale! No manual configuration or adjustment needed! Every trade is protected by stop loss. This Expert Advisor only trades for a short time frame at night, during the ending of the New York session. It uses low volatility moments and enters trades based on indicators. It then manages those trades with dynamic stop losses and take profits als

***** Unlocking the Expertise: EA Source Code for Dedicated Learners
***** Commencing from November 2021 , the "EA + source code" version is at your disposal,
***** allowing those who purchase (not rent) this EA to explore its inner workings.
*****T o acquire the source code, kindly direct your request, along with purchase information by sending messages to me.
***** Upon confirming your purchase, the source code will be extended to you. ***** < Disclaimer >
***** We provide the source cod

The Meat EA is a fully automatic, 24-hour trading system. It trades based on analysis of market movement on the basis of a built-in indicator and the Moving Average trend indicator. The system is optimized for working with the EURUSD currency pair on the M30 timeframe. It is recommended to use an ECN/STP broker with low spread, low commission and fast execution. Signal monitoring Working currency pair/timeframe: EURUSD M30.
Advantages never trades against the market; the higher the risk, the h
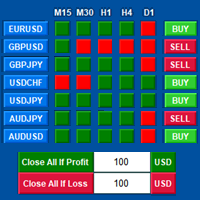
Tools designed for multi-currency trading.
You can customize which currency you want to trade, analyze up to 10 currencies by yourself. Note: Demo version for testing can be found here: https://www.mql5.com/en/market/product/17796
Analysis method. (Refer to screenshot 1) Ultimate dashboard analyzes trend strength from six major time frames: M5, M15, M30, H1, H4, D1 Show the result in graphic format. You can identify which currencies have the best strength, trend.
One click trading panel. (

The indicator draws lines based on the price Highs and Lows, as well as slant trend lines. Break through the trend line, High or Low usually indicates trend change (or continuation). Once the price moves through a line, and the candlestick closes, the indicator draws an appropriate arrow (also, you can enable alerts). This indicator is easy to use, but nevertheless, there are many trading strategies, which are based on a breakthrough of the trend lines. The number of candlesticks used to determi

A ready-made trading system based on automatic construction and maintenance of Fibonacci levels for selling and buying for use on any instrument (symbol) and on any period of the chart. Features Detection of trend direction (14 indicators) Construction of horizontal levels, support and resistance lines, channels Selection of a variant for calculating Fibonacci levels (six different methods) Alert system (on screen, E-Mail, Push notifications) Buttons Color scheme switching button. Arrow buttons.

"Battles between bulls and bears continue to influence price development long after the combat has ended, leaving behind a messy field that observant technicians can use to manage risk and find opportunities. Apply "trend mirror" analysis to examine these volatile areas, looking for past action to impact the current trend when price turns and crosses those boundaries." - Investopedia.com RSI Mirrors and Reflections is a robust technique using multiple RSI periods, mirrors and reflections based o

"Wouldn't we all love to reliably know when a stock is starting to trend, and when it is in flat territory? An indicator that would somehow tell you to ignore the head fakes and shakeouts, and focus only on the move that counts?" The Choppiness Index is a non-directional indicator designed to determine if the market is choppy (trading sideways) or not choppy (trading within a trend in either direction). It is an oscillating indicator between -50 (very trendy) and +50 (very choppy). There are man

Operation Principles The Expert Advisor trades EURUSD and GBPUSD on all timeframes. The robot calculates price movement rate (points per seconds) and defines a trend direction using two closest bars. If the price movement rate reaches the specified value, a market order with the specified TakeProfit, StopLoss and lot volume are opened in the direction of a trend. The configurable TrailingStop is activated after the price reaches the profitable area. The EA opens a single order. No next order is

SH Trend Flow indicator is calculated based on advanced algorithm of several indicators. The algorithm provides highly reliable entry points, and its simple settings allow using it for any symbol and trading style. Signals are generated at the closing of a bar and are not repaint.
Parameters iPeriod - Period of the indicator xSmooth - Lower this value will smooth the indicator PopUpAlert - true/false to show pop up alert EmailAlert - true/false to send email notification
How to use this indi

Commodity Channel Index Message is an indicator for the MetaTrader 4 trading platform. Unlike the original indicator, this three in one version has a system of alerts that inform on market situation changes. It consists of the following signals: when the Main line crosses the levels of extreme zones and 50% level; when the Main line crosses the Trend line in the indicator window; Divergence on the last bar. Values of the middle and extreme levels and divergence zones are customizable.
Paramete

The indicator displays renko bars on a chart and uses them to create ZigZag indicator - trend lines connecting local price movement Highs and Lows. The indicator, in turn, is used to create AB=CD displaying potential price reversal points. Renko is a non-trivial price display method. Instead of displaying each bar within a time interval, only the bars where the price moved a certain number of points are shown. Renko bars do not depend on a time interval, therefore the indicator works on any time
Introduction Super Prediction System is the only indicator that does not show delayed trading signals, but shows them ahead of time! It gives you an opportunity to have the trading signals right in your MT4 sooner than other traders. This indicator does not repaint and never changes signals in the history! For all you can see in the history, the indicator will show exactly the same in real time. The indicator does not wait on the reaction of a new candle, but shows the signal (arrow) immediately

Relative Strength Index with advanced functionality recalculates (converts) the averaging period in accordance with the value of parameter Time Frame for lower chart time intervals (Multi-TimeFrame (MTF)). Unlike the standard indicator, RSI converter includes an alert system that notifies about changes in market situation, it consists of the following signals: Main line crosses levels of extreme zones (30%, 70%) and the level of 50%; The main line crosses one or two trendlines in the indicator w
The Rapid indicator is a ready binary options trading system . The system is designed for trading on a five-minute interval with the 15-minute expiration and with the payout at least 85%, it is designed for traders using web terminals and MetaTrader 4 platform. Available financial instruments: EURUSD, EURCHF, GBPUSD, GBPJPY, USDJPY and XAGUSD. This is a counter-trend system, i.e. it waits for the price reversal of a traded asset. The indicator signals are not redrawn, they appear after the close
Trend Hunter is the indicator for filtering sideway and confirm trend to help your system trading. Indicator can use every currency pairs, every timeframe, and every broker. You can see trend and side way when color to change in candlestick.
Features Candlestick when the color changes to green: Uptrend. Candlestick when the color changes to red: Downtrend. Candlestick when the color changes to Yellow: Sideway.
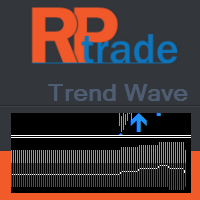
Trend Wave, gelişmiş bir ticaret aracıdır; Destekler ve Dirençlere dayalı eğilim ve karşı ticaret göstergesi.
Trend Wave, herhangi bir zamanda aktif bir ticarete sahip olacak şekilde tasarlanmıştır Trend Wave gecikmiyor Göstergeler yeni bir mumun başında verilir
Trend Dalgası gösterir Gösterge penceresi, genel trendi elde etmek için size gerçek S ve R sayısını gösterir. Beyaz çizgi anlık eğilimi gösterir. Ana grafik penceresinde, son geçerli S ve R'yi göstermek için renkli oklar görüntüle

The indicator is designed for scalping fans, it gives signals of an average of ten pips. The indicator is based on mathematical calculation, it determines the average range of the price channel, which is generally formed at the time of accumulation of positions. Once the price moves beyond its borders, a signal is generated in the form of an arrow. The indicator has a minimum of settings: the period for which you need to calculate, and the frequency of signals (the signal frequency is determined
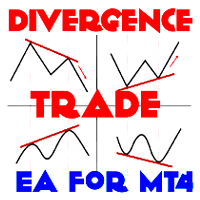
The Expert Advisor calculates the double/triple divergence of volumes, and starts trading. It uses a unique formula of lot calculation, which greatly improves stability of trading. Recommended TF - 1h. Currency pair - EURUSD , but the EA can be used on any trading instruments which are not subject to high volatility.
Settings mode - trading direction can be set manually; close - order close level (details on the screenshot); Step between orders - step between orders in points; Maximum orders -
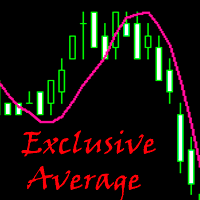
Exclusive Average is a custom trend indicator based on the standard Simple Moving Average with an improved operation logic. Signals for Position Opening: Open Buy when the price crosses the indicator line upwards. Open Sell when the price crosses the indicator line downwards.
Advantages Good signals. The indicator does not repaint. Sending signals to email and mobile devices.
Exclusive Average indicator parameters Indicator_Period - indicator calculation period. SendPush - sending push notif
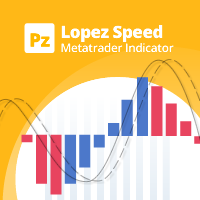
This oscillator calculates different price/time vectors to plot the aggregate market direction and two moving averages, in order to detect if the market is accelerating or decelerating. [ Installation Guide | Update Guide | Troubleshooting | FAQ | All Products ] Easy to use and understand Acts as a top-quality filter for trades It has a unique speed detection algorithm It is non-repainting and non-backpainting It implements alerts of all kinds It can be used as a top-quality filter for trend tra

Market Pressure is a next-generation display. Its simple and intuitive graphics system allows you to receive directions very easy and fast. This indicator can give three different methods of signals: Scalping, Intraday and Multiday. The logic is based on the price action which combined on multiple time frame. It can give very high quality signals. An indispensable tool for those who want to understand the market pressure and the operating trend. The indicator is customizable for both colors for

This Expert Advisor uses three blocks of standard indicators. When all three say the same, then it will kick in and trade. You can change the following settings: EAName – name showing in the comments field when trading RiskEquity – risk % of equity depending on Stop Loss SL – Stop Loss TP – Take Profit TrendEMA – this EMA is looking for trend. If above this level, it will look for a buy. If below, it will look for sell StochasticHi – this is the Stochastic High level. Default is set to 80. Looki
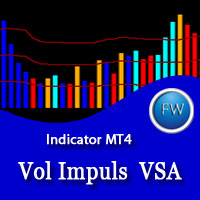
The Volume Impuls VSA indicator paints a histogram of volumes tading into account the bar direction and comparing it with the volume of previous bars. The volume of the rising and falling trend are painted respectively in blue and in red. If the current volume exceeds the volumes of the opposite direction, an impulse is formed. Accordingly, the impulse of the upward and downward trends are painted in blue and orange. Also the indicator displays three levels, based on which you can easily compare

The indicator sends messages to e-mail and mobile terminal when the price approaches the horizontal levels and trend lines that are drawn using the handy panel! The levels and trend lines are deleted and placed to the chart using one click on the panel, and they can be dragged on the chart by mouse! It is possible to set the interval between messages in the settings, the interval is applied to each object separately!
Indicator Settings ===*** Main settings ***=== - below is the list of the mai
This expert advisors trades donchian breakouts according to Bill Williams's definition of "Trading in the Zone". It uses alligator to find strong trends, AC and AO to identify trading zones and MACD to avoid trading exhausted trends. [ Installation Guide | Update Guide | Troubleshooting | FAQ | All Products ] Easy to use and supervise Fully configurable indicator settings Customizable break-even, stop-loss, take-profit and trailing-stop settings Works for ECN/Non-ECN brokers and 2-3-4-5 digit s

Alan Hull's moving average, more sensitive to the current price activity than the normal MA. Reacts to the trend changes faster, displays the price movement more clearly. When the indicator color changes, it sends a push notification to the mobile device, a message to the email and displays a pop-up alert.
Parameters Period - smoothing period, recommended values are from 9 to 64. The greater the period, the smoother the indicator. Method - smoothing method, may range from 0 to 3. Label - text
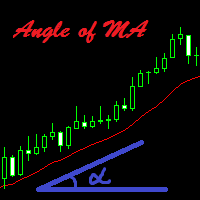
The indicator calculates the inclination angle of the Moving Average and displays the result on the screen. Users can select the start and end points to measure the inclination of the MA. It is also possible to set the angle value, and if the inclination angle exceeds the specified value, the indicator will play a sound alert and display a message on the screen.
Configurations Left_Shift_of_MA=1; - Shift of the MA to calculate the inclination angle (start point) Right_Shift_of_MA=0; - Shift of

Trend Expert Advisor with a strategy based on trading in the price reversal areas. No grid, no martingale, uses a fixed stop loss and take profit. It is designed for 4-5-digit quotes. VPS server is recommended. Timeframes – M5-H1. Recommended minimum deposit – 500 units of the base currency. Recommendations Backtesting and optimization should be performed on quotes with 99.90% quality. With slippage and commission approximated to the real market conditions. Before using on a live account, test t

The indicator displays Renko bars on the chart, uses them to plot the ZigZag - trend lines connecting the local Lows and Highs of the price movement, and highlights them based on the Gartley patterns, showing the potential price reversal points. Renko - specialized display of the price action, in which the graph is displayed not every bar of the time frame, but only under the condition that the price had passed more than the specified number of points. Renko bars are not bound to a time frame, s

The indicator displays Renko bars on the chart and uses them to plot the ZigZag - trend lines connecting the local Lows and Highs of the price movement. Renko - specialized display of the price action, in which the graph is displayed not every bar of the time frame, but only under the condition that the price had passed more than the specified number of points. Renko bars are not bound to a time frame, so the indicator can work on any time frame with the same efficiency. This implementation of t

This indicator displays buy or sell signals according to Bill Williams' definition of the Trading Zone. [ Installation Guide | Update Guide | Troubleshooting | FAQ | All Products ] Easy to use and understand Avoid trading flat markets Deterministic indicator with clear rules The indicator is non-repainting It implements alerts of all kinds It has straightforward trading implications. A blue arrow is a buy signal A red arrow is a sell signal According to Bill Williams trading in the zone helps to

Taranus Light is a reduced version of the universal, semi-automatic EA Taranus, designed to work under the control of a trader. It can work with or without indicators, has several filters for determining the trend direction and can only work with market or pending order. Trailing stop capabilities of the EAd has been expanded by adding functions from UTrailing EA. Taranus Light EA is suitable for both experienced and beginner traders. Set files and a guide to the Taranus Light EA can be found in

Solomon's Chest is fully automated scalper Forex robot which trades on ranging and slightly trending market. The trade entries are based on dynamic zones in all timeframes and with the most recent 30bars of all timeframes. Once opportunity level is determined, it will open trades right away. Each order is protected with hidden calculated Stop Loss level. Take profit level is also calculated. The real profit most of the time is actually taken from the trailing stop and with a breakeven point of 5

Volume Confirm Trend Zone is the indicator for filtering sideways and confirm trend to help your system trading. Indicator can use every currency pairs, every time frame, and every broker. You can see trend zone when color to change in volume indicator.
Features When the color changes to the blue: Buy Zone is a strong trend. When the color changes to the red: Sell Zone is a strong trend.

Smooth MA Trend Cross Alert is indicator signal strategy trading by Smoothed Moving Average (SMMA) crossover. It'll alert signal with an audio or pop up on the chart when 2 periods SMMA cross above/below for Buy/Sell. It easy use. Filter sideways by SMMA's smoothed trend. Helpful for your system trading. You can customize period of SMMA for crossing alert signal. You can ON/OFF audio alert signal on the chart, Notifications alert on mobile, Email message alert when Buy/Sell SMMA cross alert sign

This is an Expert Adviser use for manual trading as a background EA or combine with external EA to open orders. Loss Recovery Trading is one of your options to handle the lose positions instead of using stop loss by setting a zone recovery area and target to exit the turn rounds sequence.
How It Work? If the market goes against your first positions direction at the specific of losing points, the EA will open an opposite direction position with calculated larger lot size and also keep the first

Intraday Levels shows intraday levels grid for intraday trading
Shows a grid for the day levels, gives you a guide to know the trend and to measure intraday trades (stop-loss and take-profit).
Parameters are: Levels Mode: Basic mode: Shows highest, lowest and middle levels. Advanced mode: Shows highest, lowest, middle and intermediate levels. Fibonacci mode: Shows session Fibonacci retracements levels. Momentum mode: Shows delayed Advanced levels to identify momentum. Smooth Period (Momentum
如果产品有任何问题或者您需要在此产品上添加功能,请联系我 Contact/message me if you encounter any issue using the product or need extra feature to add on the base version.
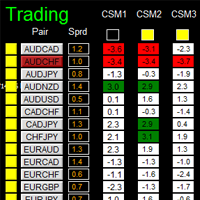
Dashboard Super Currency Strength is an intuitive, and handy graphic tool to help you to: Have 28 pairs under control with one dashboard. Monitor price movement, identify possible trend based on currency strength gap of two currency on 3 timeframe. Provide trading signals based on the CSM (currency Strength Meter) selected. Manage order automatically on

Indicator based trading according to the price analysis of bars, the most popular among traders. The indicators calculated based on larger periods are used for identification of a stable trend on the market, and the ones calculated based on smaller periods are used for entering the market after a correction. The oscillators with overbought and oversold levels have a special place in indicator-based trading. The values of such indicators are subjected to wave structure - the higher waves (chart t
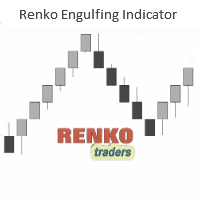
The Renko (and Mean Renko) Engulfing Bar Indicator is a versatile trading indicator that plots Buy/Sell arrows and gives potential trade ideas including buy entry and stop loss levels. The indicator is designed to work on offline renko charts as well as Mean or Median Renko charts. It is recommended to use this indicator on a minimum of 20Pips fixed renko box or more. The indicator does not repaint. It prints the arrows after the bar close. The indicator's buy/sell arrows can be a powerful way t
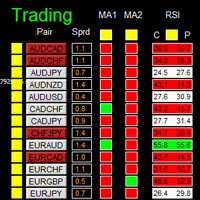
如果产品有任何问题或者您需要在此产品上添加功能,请联系我 Contact/message me if you encounter any issue using the product or need extra feature to add on the base version.
There is Demo version of this panel Dashboard Super MA RSI CCI Demo in my product list, pls try it out to get familiar with all functionalities free . Dashboard Super MA RSI CCI is an intuitive, and handy graphic tool to help you to: Have 28 pairs under control with one dashboard Monitor price movement, identify possible trend based on MA, RSI, and CCI

Prometheus Smart Money is an indicator that combines both price & volume with calculations based on other custom indicators, smart volume and retail volume to create this leading indicator that gives you high probability moves to help you make a decision on what is MOST likely to happen in the market going forward Advantages You can use it in ALL financial markets including binary options on ALL asset classes or instruments. You can use it as a stand alone indicator or as a confirmation tool wit
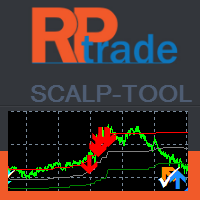
Saç Derisi Aracı çok etkili bir karşı trend göstergesidir.
Herkes tarafından kullanılmak üzere tasarlanmıştır, ticarette yeni başlayanlar bile kullanabilir. Saç Derisi Aracı yeniden boyamaz. Endikasyonlar yakından yakına veya yakından görünür seviyeye verilir. Saç derisi aracı tek başına kullanılabilir, başka bir göstergeye gerek yoktur.
Saç Derisi Aracı gösterir İşlemlerinizi nerede açabilirsiniz. Onları ne zaman kapatmalı. Stop emirleri nereye verilir. Canlı testler sırasında %80'in üze

The indicator displays Renko bars on the chart, plots two moving averages by them and generates buy/sell signals based on the conditions displayed in the screenshots and described below: the buy signal is formed if the fast moving average is above the slow moving average, from 4 to 10 consecutive bullish Renko bars are displayed, followed by no more than 2 bearish and one bullish Renko bars; the sell signal is formed if the fast moving average is below the slow moving average, from 4 to 10 conse
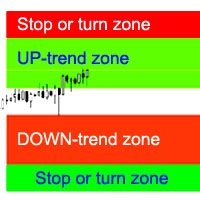
Gösterge, en olası trend durdurma/geri dönüş alanlarını, kendinden emin trend hareket alanlarını hesaplar.
Hesaplama şunları dikkate alır:
fiyat değişim oranı; grafiğin göreli sapma açısı; fiyat hareketlerinin ortalama genliği; "konfor bölgesini" terk eden fiyat; ATR göstergesinin değerleri. Gösterge, fiyat bir durdurma/geri dönüş alanına girdiğinde bir Uyarı oluşturabilir. Ayarlar Tüm uzunluğu çiz? - grafiğin sonuna kadar alanları çizin; YUKARI trendi durdur - bir yükseliş trendinin durma/
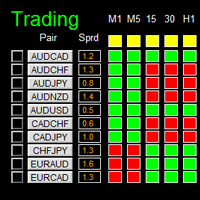
如果产品有任何问题或者您需要在此产品上添加功能,请联系我 Contact/message me if you encounter any issue using the product or need extra feature to add on the base version.
Dashboard Super Candle is an intuitive, and handy graphic tool to help you to: Have 28 pairs under control with one dashboard. Monitor candle direction, identify possible price movement and trend. Provide trading signals based on the candle direction selected by you. Automatically manage order once signal are generated. Have the ability to select which

This indicator is based on Market Profile methodology, which contains the Z-Zone , unlike the latter, allows visualization of multiple time frames on the same graph. This methodology has proven to be very effective for: Reduce the number of windows required to analyze or track a financial asset. Display important resistance areas (ROZ), support (SoZ) and average distribution (PoC) in different periods of time. Define areas to take profits as well locate technical stop loss. Analysis in the devel

The Illusion EA uses the probability theory - after a series of consecutive virtual losses - i.e. right during a flat the EA already starts trading in the trend. In addition, the EA considers the ratio of bullish/bearish candles on the higher timeframes to determine the greatest probability of the price movement direction. Only 1 order can be opened at a time. In case of a loss the following order will be placed with an increased lot (the multiplication coefficient is set in the parameters). The
Tipu Parabolic SAR Dashboard is based on the Tipu Parabolic SAR indicator. Please contact me here at MQL5 if you would like to use this panel for your custom signals. Tipu Parabolic SAR Dashboard is a multi-currency, multi-timeframe panel created to help traders in analyzing the markets quickly using the Parabolic SAR indicator signal. The dashboard panel is designed to help traders quickly change symbols and periods. If you are constantly missing trade opportunities while browsing through the

Enhance your trading precision with our revolutionary product, Trade Time Master Pro. This indicator provides unique insights into the duration of your active trades, offering a comprehensive view of their time in Days, Hours, Minutes, and Seconds. Indicator Features:
Time Display:
Indicator shows first 3 active trades (buy/sell trades) time duration in Days, Hours, Minutes, Seconds. Time duration means how long the order is active in the market, how long the order is running. Indicator shows

Taranus is a multifunctional EA, a universal assistant to a trader, designed to work under the control of a trader. The EA has a large set of tools and can work: by indicators, by trading levels, by trend lines, by martingale strategy, trade on news. It has: several filters to determine the trend, a multi-level risk management system, money management, virtual stop loss, universal trailing stop, can work with any type of orders. Set files and a guide to the Taranus EA can be found in the "Commen
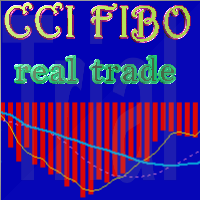
The CCI FIBO trend indicator displays the real sentiment of the market. Does not redraw. The CCI FIBO indicator is based on the processed values of the standard CCI indicator. The indicator is able to display the slowing\reversal of the price during the trend movement (for exiting the position, and with some experience to display the opening in the opposite direction, for example, to use in scalping). It shows spikes in a flat. The idea of the indicator was that there are indicators that are goo
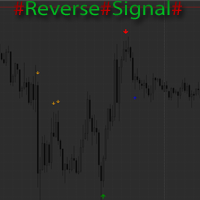
The indicator marks the estimated market reversals in the form of arrows. The indicator is able to detect 3 types of reversals. The primary reversal signal. It is a stronger and more important reversal. Denoted by the largest arrow. Alternative signal - additional signal without additional filters in contrast to the primary. Suitable for scalping on small timeframes. A mixture of the primary and alternate reversals, but with the addition of the trend filter. Also shows good results on small time

Elliott Wave Trend was designed for the scientific wave counting. This tool focuses to get rid of the vagueness of the classic Elliott Wave Counting using the guideline from the template and pattern approach. In doing so, firstly Elliott Wave Trend offers the template for your wave counting. Secondly, it offers Wave Structural Score to assist to identify accurate wave formation. It offers both impulse wave Structural Score and corrective wave Structure Score. Structural Score is the rating to sh
CIS is designed for trading a basket of correlating currencies, as well as single instruments: indicators
VSA indicator which draws arrows (does not redraw). Its signals indicate the price reversal on a calm market or decrease of the rise or fall rate during strong movements. Works fine in the flats. As the indicator uses volumes in its calculations, be careful during evenings and night times, when there are very small volumes. It is recommended to be used only on multiple currencies or at l
MetaTrader mağazası, geliştiricilerin alım-satım uygulamalarını satabilecekleri basit ve kullanışlı bir sitedir.
Ürününüzü yayınlamanıza yardımcı olacağız ve size Mağaza için ürününüzün açıklamasını nasıl hazırlayacağınızı anlatacağız. Mağazadaki tüm uygulamalar şifreleme korumalıdır ve yalnızca alıcının bilgisayarında çalıştırılabilir. İllegal kopyalama yapılamaz.
Alım-satım fırsatlarını kaçırıyorsunuz:
- Ücretsiz alım-satım uygulamaları
- İşlem kopyalama için 8.000'den fazla sinyal
- Finansal piyasaları keşfetmek için ekonomik haberler
Kayıt
Giriş yap
Gizlilik ve Veri Koruma Politikasını ve MQL5.com Kullanım Şartlarını kabul edersiniz
Hesabınız yoksa, lütfen kaydolun
MQL5.com web sitesine giriş yapmak için çerezlerin kullanımına izin vermelisiniz.
Lütfen tarayıcınızda gerekli ayarı etkinleştirin, aksi takdirde giriş yapamazsınız.