YouTube'dan Mağaza ile ilgili eğitici videoları izleyin
Bir alım-satım robotu veya gösterge nasıl satın alınır?
Uzman Danışmanınızı
sanal sunucuda çalıştırın
sanal sunucuda çalıştırın
Satın almadan önce göstergeyi/alım-satım robotunu test edin
Mağazada kazanç sağlamak ister misiniz?
Satış için bir ürün nasıl sunulur?
MetaTrader 4 için Uzman Danışmanlar ve göstergeler - 110

The indicator is designed for binary options. It produces a sound alert, after which you should instantly enter the market. The indicator operates based on signals form RSI and CCI, as well as support and resistance levels. When the chart is in overbought and oversold zones, the indicator finds a level in this zone and notifies you using a sound and a message.
Indicator Parameters dist - the number of points to generate a signal. Suitable values are from 21 to 50. Filtr_SMA - the filter, used
Use this script to export the price history to MATLAB mat files from any chart. Optionally, a CSV file can be created. This script allows easily creating and verifying your trading strategy in MATLAB, for example, statistical arbitrage or pairs trading strategies.
Input parameters startDT: start export from this date and time. Can be '1970.01.01 00:00:00' to start from the first available date and time. endDT: the last date and time in the file. Can be '1970.01.01 00:00:00' to export until the

MIRA is an Expert Advisor built according to the principles of indicator-less short-term trading based on martingale with different protection levels and customization. It provides methods for reducing risks by fixing a part of profit by trailing stop, smoothing out the gaps by means of dynamic locking, automatic recovering from drawdowns, buying out losing positions. A strict risk management system allows setting a limit on the allowed drawdown both as a percentage and in the deposit currency.
This indicator detects IDRN4 and IDNR7 two powerful patterns on 28 pairs on new daily bar. IDNR4 is the acronym for "Inside Day Narrow Range 4" where "Inside Day" is a lower high and higher low than the previous bar and "Narrow Range 4" is a bar with the narrowest range out of the last 4 bars so "Narrow Range 7" out of the last 7 bars. Hence, ID/NR4 and better ID/NR7 are an objective criterion for identifying days of decreased range and volatility. Once we find an ID/NR4 or an ID/NR7 pattern, we

Every successful trader knows what support and resistance spots are working. And always know that these points need to be kept in mind. They always trade according to this point. The support and resistance point indicator operates in two different modes. The first is the standard support and resistance points we know. The second is Fibonacci levels. This indicator automatically calculates and displays the support and resistance points on the screen.
Features You can select the time frame you wa

Real Trend Lines is an indicator that calculates trends using a set of channels and using a set of algorithms. This indicator helps to find trend return points. It generally represents an oscillator. This trend tracking system helps the investor to understand small or large trends and determines the direction according to it.
Trending features Up trend Rule 1 - yellow trend line should be below zero level. Rule 2 - the yellow trend line should be in the green and orange channel. Rule 3 - the tr
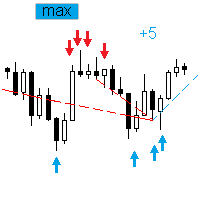
The Expert Advisor trades the signals from an artificial neural network with one hidden layer. Presence of a signal is checked at the closing of the specified period. MAIN PARAMETERS Net option - setting the order grid. When placing a market (not pending, Pending order offset=0 ) order according to a signal, the grid order is set. The following direction are available: follow the trend , against the treand and both directions . The number of placed orders is taken from the ...maximum deals with
ISR Pro is a powerful indicator that works non trending market conditions. This indicator is perfect for scalp trades as well as swing trades. Intraday is another way of saying "within the day." Intraday price movements are particularly important to short-term traders looking to make many trades over the course of a single trading session. Features This indicator does not repaint and never changes levels in the history. For all you can see in the history, the indicator will show exactly the sam

This multi time frame and multi symbol indicator scans for Pin bars, Morning/Evening stars, Engulfings, Tweezers, Three line strikes, Inside bars and Pennants and Triangles. The indicator can also be used in single chart mode. Please read more about this option in the product's blog . Combined with your own rules and techniques, this indicator will allow you to create (or enhance) your own powerful system. Features
Can monitor all symbols visible in your Market Watch window at the same time. App

Range bands works the same way as Bollinger bands except that they are self adapting, with range trading in mind. Unless you are familiar with Bollinger bands, it is a standard deviation indicator that is based around the concept that when price deviates to quickly from the average, it's going to encounter resistance. This is true for all period settings, since standard deviation 2 or 3 is an extreme on any data. This indicator automatically chooses the period that is currently most suitable for

Super signal series mystery arrows is an indicator designed to generate trading signals. This indicator uses a number of different indicators and generates a signal using a number of historical data. Currency pairs: Any Time interval: M5, M15, M30. Suggested M5 Work with at least 20 pairs
Parameters AlertsOn - send alerts. If this feature is activated, it will be activated in other warning properties. AlertsMessage - send a message AlertsSound - sound alert setting AlertsEmail - email ale

Super oscillator indicator is an oscillator designed to calculate trend reversal points. A set of bar calculations and a set of algorithms to calculate trend reversals. Level probing system with high probability trends. All of these features combine to make it easier for investors to find trends.
Suggestions and Features There are two levels on the super oscillator indicator. They are at levels of 0.5 and -0.5. The oscillator bar should be below -0.5 to find the upward trend. And a blue color t

This simple indicator helps defining the most probable trend direction, its duration and intensity, as well as estimate the possible range of price fluctuations. You can see at a glance, at which direction the price is moving, how long the trend lasts and how powerful it is. All this makes the indicator an easy-to-use trend trading system both for novice and experienced traders.
Parameters
Period - averaging period for the indicator calculation. Deviation - indicator deviation. Lag - calculatio

This tool is developed to make your trading risk and profit management easier. It is able to move all of your opened transaction's take profit and stop loss on to one similar price.
How to use Draw a trend line/horizontal line and name it to "tp_" as the take profit line and "sl_" as the stop loss line. The EA will modify all of your orders' and pending orders' take profit and stop loss to the given line. You can drag the gray box to drag the line. You can see the risk in the account currency
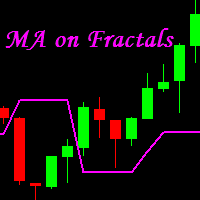
MA on Fractals is a professional trend-following indicator for MetaTrader 4 . It builds a moving average using Bill Williams' fractals. We believe that MA on Fractals is much more efficient than a standard moving average. Its combination with other indicators allows receiving more accurate trading signals. It is most suitable for M15, M30, H1 and H4.
Advantages Unique indicator. Generates minimum false signals. Suitable for beginners and experienced traders. Simple and easy indicator configurat

TOP Xios is a ready-made trading system, which provides the trader with signals for opening and closing deals. The information panel in the right corner of the screen shows the total number of signals, the number of points in profit or loss and the percentage of valid and false signals. Working with this indicator is very simple. As soon as a blue arrow appears, open a buy deal and wait for a red cross to appear, which indicates the necessity to close the deal. When a red arrow appears, open a s

Golden Monowave is monowave indicator, the monowave theory is one of Elliott wave approach and one of most complicate and accurate method. Golden Monowave can shortcut many major steps to identify and describe the monowave. It works on any timeframe and with any trading instrument, including currencies, indices, futures, etc.
Input Parameters initial_Bars - set the initial number of bars to calculate. wave_color - select the color of the wave. label_color - select the color of labels. temp_labe

Super Trend Bars is a trend finding indicator. It tries to find the trends that are most likely to trend. A set of indicators and a set of algorithms. Trend probability changes color when it finds a high trend. The red color represents the declining trend. The lime color represents the upward trend. Super Trend Bar changes color when it finds a trend.
Features This indicator is a trend indicator by itself. It can operate without the need for additional indicators. When you see the first lime co

ChartChanger, terminalinizdeki açık haritaların sayısını azaltmak için harika bir yardımcı araçtır. Üç bölüm vardır: Semboller, Zaman Çerçeveleri ve Şablonlar. Açmak için yalnızca bir grafiğe ihtiyacınız var ve yine de birden fazla grafiğe doğru ilerleyebilirsiniz. Semboller: Bir düğmeye basarak bir sembolden diğerine geçiş yapabilirsiniz ve uygulanan göstergeleriniz bir sonraki grafikte kalacaktır. Semboller için bir otomatik algılama modu vardır veya istediğiniz sembolleri manuel olarak girebi

If you would like to trade reversals and retracements, this indicator is for you. The huge advantage is that the indicator does not have input parameters. So, you will not waste your time and will not struggle to change them for different timeframes and symbols. This indicator is universal. The green triangle represents a possibility to go long. The red triangle represents a possibility to go short. The yellow dash represents a "non-trading" situation. This indicator could be used on M1, M5, M15

Background It only needs a small initial deposit. Suitable for multi-currency trading. Real account monitoring: https://www.mql5.com/en/signals/294440
Operation Principle The EA opens orders based on a built-in indicator. The EA determines the order with the greatest negative profit each tick. Then the determines the total profit of Buy and Sell orders on each currency pair. If the total profit of Buy or Sell orders on each currency pair plus the amount of the order with the greatest negative p

Measures the length of the selected movement in points, shows the duration of the movement, as well as the speed of movement. Outputs the average value of each dimension.
It is designed to calculate the expected target based on typical market movements.
The intended goal will provide information about the ratio of the stop size to the possible profit and will allow you not to open positions with a small expected profit.
It will also help you determine the point at which it is more logical to c
The Expert Advisor identifies extreme overbought and oversold conditions in a market. Opening positions on extreme overbought conditions or extreme oversold conditions allows for getting the highest profit. If the starting position is in a loss then the second or third position has the probability to gain big profit value. The built-in spread filter manages slippages and spread extension. The EA does NOT use hedging, martingale, grid strategies, arbitration, etc. The Expert Advisor works with St

The super oscillator trading system is a trend finding tool. This system consists of a few indicators and a few algorithms. The aim of this indicator is to direct the investor to find healthy trends.
Trade Rules This indicator has two channel lines. These channels are red lines below zero and above zero. There is a line in two places to process. These are blue lines. There is one trend line, the yellow line. Up trend rules Rule 1 - the yellow trend line should close below the red line below the

The PriceAction_Helper indicator automatically recognizes Japanese candlestick patterns on charts. The indicator marks the location of a candle pattern and indicates the most likely price direction based on that pattern.
Who can use the indicator If you are a novice in trading Japanese candlesticks, PriceAction_Helper will help you detect patterns, demonstrate how they work and enable you to memorize candle pattern types and names. If you are an experienced trader familiar with Price Action, th

This long-term trading system works on 10 pairs and M5 timeframe. It uses various trading systems, such as trend trading, countertrend trading and others. This increases the chances of sustained growth and reduces exposure to a single pair or individual operations. The risk is very controlled. The settings are very simple, there is no need to change them. Optimization is not required as well. Realistic management of internal adjustments. Instead of trying to find the exact values that fit the h

This is the RSI-based oscillator. Settings: Price - applied price. Possible values: PRICE_CLOSE - Close price; PRICE_OPEN - Open price; PRICE_HIGH - High price; PRICE_LOW - Low price; PRICE_MEDIAN - Median price, (high+low)/2; PRICE_TYPICAL - typical price, (high+low+close)/3; PRICE_WEIGHTED - weighted Close price, (high+low+close+close)/4. RSI_PERIOD - averaging period for calculating the index. K - dynamics ratio. Mode - averaging method. Possible values: SMA - simple; SMMA - smoothed.

The trend beads indicator is software that does not include trend indicators such as moving average, Bollinger bands. This indicator works entirely with price and bar movements. The purpose of the indicator is to calculate the most likely trends. To assist the user in determining trend trends. The user determines the trend direction with the colors on the screen. You can use this indicator alone as a trend indicator. Or with other indicators suitable for your strategy.
Trade Rules Rising trend

The YFX Symbol Watermark indicator is used to display a watermark on your chart, which makes it easy to see at a glance the symbol information for any chart. The displayed information includes: Symbol Name and Timeframe on the chart Description of the currencies Tag line, which can contain any user-defined information All the information can be displayed on the chart so that it can be easily read. The indicator also has parameters that can be set to customize which information is displayed. Para

The I Return Signal indicator is a product designed for signal trading. This indicator works by using a number of factors such as a set of indicators, recent history data, bar combinations, price movements, custom filtering system and various algorithms. It uses all of these factors at the same time and generates turn signals. The signals are generated by calculating from the highest possible points of the signal. This indicator is easy to use and understandable. Thanks to the warning features,
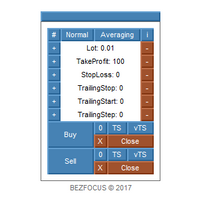
Trading panel for scalping.
Features Two languages (English, Russian). Adjustable panel scale. Two color schemes. Virtual trailing stop. Trailing stop. Averaging.
Parameters Lot - lot size. Lot Button Step - step for changing the lot size using buttons. Take Profit - take profit. Take Profit Button Step - step for changing the take profit using buttons. Stop Loss - stop loss. Stop Loss Button Step - step for changing the stop loss using buttons. Trailing Stop - trailing stop. Trailing Stop But

Salva EA is an advanced and fully automated system, which passes backtesting since 2005. The basis of this strategy is the price chart itself, trading is performed based on the price movement range. Dynamic algorithms and filters are used for taking profit or closing trades. Built-in reworked system for filtering market entries and exits: Checking the trading direction using integrated trend indicators. Checking the channel range for the minimum and maximum values. Checking for the price exceedi

I recommend you to read the product's blog (manual) from start to end so that it is clear from the beginning what the indicator offers. This multi symbol and multi time frame indicator scans for the following candlestick patterns (please see screenshot for explanation of the patterns): Three white soldiers (reversal>continuation pattern) Three black crows (reversal>continuation pattern) Bullish and bearish Three line strike (reversal pattern) The patterns do not appear very often on higher

The indicator allows you to quickly switch from one instrument to another, from one time period to another using the keyboard or buttons on the monitor. Each command can be assigned a hot key from 0-9, a-Z (case-insensitive) and VK_OEM_COMMA ("<" on the keyboard) and VK_OEM_PERIOD (">" on the keyboard). This can help you to operate the maximum number of instruments that are available at your broker, analyze more instruments/periods in less time. This product cannot be tested in the tester , beca

The EA "Opposite" is a full automated trading expert. The EA uses the hedging strategy as follows: He opens a buy and a sell position at one moment and closes one of the positions after reaching the take profit. Then he opens again two orders in two directions, but in one direction the lot size is bigger than in the other one. Thus one has two possibilities: Either one takes the profit in the direction with less lot size or one takes the profit in the direction with bigger lot size. In the last

This Expert Advisor focuses on trading breakouts of fix defined structures during the opening in Europe. Similar patterns lead to similar results. TakeProfit and StopLoss are calculated and set by the robot for each position based on the current volatility. For risk minimization the Stop gets trailed once before reaching the target. therefore there are three different ways a trade can result: TakeProfit, StopLoss & TrailingStop. This fact makes it easy to analyze and calculate all positions of t

It is a simple indicator showing the moments of intersection of two Moving Averages, and it can be an indefensible tool for use in some trading systems. When the MAs intersect, the indicator draws arrows in accordance with the crossover direction and generates and alert.
Indicator parameters Period Fast MA - fast Moving Average period; Period Slow MA - slow Moving Average period; Method MA - Moving Average method; Apply to - price used for MA calculation; Alert - alert; Number of history bars -

The Super Cross Trend indicator is designed for trend and signal trading. This indicator generates trend signals. It uses many algorithms and indicators to generate this signal. It tries to generate a signal from the points with the highest trend potential. This indicator is a complete trading product. This indicator does not need any additional indicators. You can only trade with this indicator. The generated signals are displayed on the graphical screen. Thanks to the alert features you can ge

This EA is the 28-common-pairs Scanner in the Forex Market. It based on the theory of 123 Pattern with a set of SMAs, Heiken Ashi for detecting Trade signals. You can choose any time frame to scan as you like.
123 Pattern Theory Buy Condition: Fast MA is above Slow MA (Uptrend confirmed) while Heiken Ashi pull back and begin to continue going up with the trend. Sell Condition: Fast MA is below Slow MA (Downtrend confirmed) while Heiken Ashi pull back and begin to continue the downtrend. (Attach

This powerful indicator intercepts 21 patterns simultaneously on 28 Pairs and on all timeframes. Just put the indicator on a single chart to see all patterns that appear on all pairs in all timeframes The patterns found are: For Bearish: Bearish Abandoned Baby; Bearish Engulfing; Bearish Harami; Bear Kicker; Dark Cloud Cover; Evening Doji Star; Evening Star; Shooting Star; Three Black Crows; Three Inside Down; Three Outside Down; For Bullish: Bullish Abandoned Baby; Bullish Engulfing; Bullish Ha

This Script Shows your Account & Symbol information which you use on your graphics. These are: Account Information Number Name Currency Server Leverage Stop Out Level Balance Information Balance Equity Margin Free Margin Symbol Information Symbol Lot Size Min.Lot Lot Step Max.Lot Tick Value Tick Size Spread Stop Loss Level Swap Long Swap Short Initial Margin Maint.Margin Required Margin Trade Allowed

SRP (Strong Retracement/Reversal Points) is a powerful and unique support and resistance indicator. It displays the closest important levels which we expect the price retracement/reversal! If all level are broken from one side, it recalculates and draws new support and resistance levels, so the levels might be valid for several days depending on the market!
Key Features You can use it in all time-frames smaller than daily! Displays closest significant support and resistance levels Update the le

The Effort and Result indicator is based on the work of Karthik Marar; a volume spread analysis trader. It compares a price change (Result) to the volume size (Effort) for a certain period. By comparing the effort and result, we can get more information about the future price movement. Both values are normalized and converted to a scale of 0 - 100 % based on a selectable look-back period.
This indicator is also known as the Effort Index.
The law of effort and result The law of effort vs.
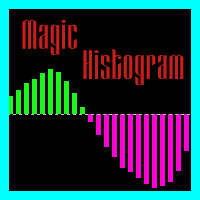
The Magic Histogram indicator is a universal tool, suitable for scalping and medium-term trading. This indicator uses an innovative formula and allows you to determine the direction and strength of the trend. Magic Histogram is not redrawn, so you can evaluate its efficiency using history data. It is most suitable for M5, M15, M30, H1 and H4. Version for the MetaTrader 5 terminal : https://www.mql5.com/en/market/product/58448
Indicator Benefits Excellent indicator signals! Suitable for beginne
This is an reversal detection Robot
https://youtu.be/2wCzTFIGNp4 The Robot was designed by myself and works already on live accounts. This Ea is based on high probability reversals in trends. Higher accuracy in higher time frames Can be used with TP and SL settings with trailing stop as MArtingale The robot works on all Currency Pairs and all Time Frames. The higher the Frame so higher the possibility of the trade accuracy. I wish everyone who purchases the EA maximum sucess and good tradin

Bu, Çoklu Zaman Çerçevesi Raptiye çubuğu uyarı göstergesidir. Yalnızca geçerli zaman diliminde veya 1 dakikadan aya kadar tüm zaman dilimlerinde kullanabilirsiniz.
Tüm zaman dilimlerini seçtiğinizde, grafiğinizin açık olduğu mevcut zaman dilimi ve yukarıdaki zaman dilimleri hakkında uyarı alırsınız.
Seçilen her zaman dilimi için ayrı ayrı Açılır pencere, e-posta ve anında bildirim uyarıları vardır.
Gösterge fiyat tablosuna bir ok yerleştirir. Boğa yönlü/Uzun Pin çubuk için fiyat çizgisinin a

The DoubleEverest Expert Advisor is a pure, distilled idea. This automated EA follows its own unique mathematical algorithm. DoubleEverest : no indicators no martingale, locking, averaging, other risky money management techniques trades every day DoubleEverest catches the price in the European and American sessions. Considers the volatility and dynamics of the market. DoubleEverest places pending orders on the price extremes: of the past and current day, fractals, significant resistance and supp

This is a scalper EA based on ZigZag and Moving Average indicators that used martingale strategy for trading. You have full risk management This EA does many trades per day as its method is clear The EA can work with any brokers: STP/ECN The EA can work with any pairs (recommended GBPUSD) The EA can work with any timeframes
Inputs Risk – choose your risk between high and low Pip set – d istance between two orders Take Profits - m odify take profit as pips Stop loss - m odify stop loss as pips M

This is a panel EA for one-click trading.
Demo version | User manual | Contact me for any questions / ideas for improvement / in case of a bug found
List of main functions
Risk management Calculate the lot size by X dollars(currency of deposit) and stop loss.
Calculate the lot size by percent of equity and stop loss. Calculate lot size by equity percent (free margin percent). Calculate lot size by specified lot for each X dollars(currency of deposit) of balance.
Positions and orders

The indicator operates based on a unique candlestick pattern. When the indicator generates a signal, there is a high probability of price reversal, and we can use it in trading.
Indicator use strategy Market entry should be performed at the closure of the signal candlestick. Stop Loss should be set behind the signal cloud. We will have two take profits, the first one is equal to the stop loss value, 50% of lot amount should be closed at this level, and stop loss should be moved to breakeven. Th

I recommend you to read the product's blog (manual) from start to end so that it is clear from the beginning what the indicactor offers. This multi time frame and multi symbol indicator can identify the following 5 crosses: when a fast moving average crosses a slow moving average line. when price has reached a single moving average (closed above/below or just bounced). when a triple moving average formation has appeared (all 3 MA:s in consecutive alignment). when the MACD main line crosses t

This is an automated Expert Advisor that trades using the MACD and Envelopes indicators. The free version has the following limitations. No panel for opening orders. The trading is limited to the EURUSD currency pair and similar. Orders can only be opened with the minimum lot, no more than 5 orders can be opened in the same direction, to a total of 10 orders. Pause after closing of all orders is 6000 minutes. During the analysis, no more than 50 orders are added to the database and 15 bars are c
FREE

We-Trend MT4 indicator made by the We-Trading team is designed to study supports, resistances and trend filters. We-Trend is the tool that works also as a trend filter on all major trading strategies. We-Trend write for you horizontal lines (supports or resistances) on all timeframes.
UP Trend, Down and FLAT The We-Trend helps to understand the direction of the trend. Red or Green Horizontal lines show supports and resistances Trend comment show the main trend of the current TimeFrame, and othe

This indicator studies the price action as a combination of micro-trends. All micro-trends are analyzed and averaged. Price movement is filtered based on this averaging. IP_High and IP_Low (blue and red dashed lines) show the instantaneous price movement. They display the forecast only for the current price values, taking into account only the number of bars defined by the 'Filter level' parameter. SP_High and SP_Low (blue and red solid lines) smooth the price movements with respect to history.
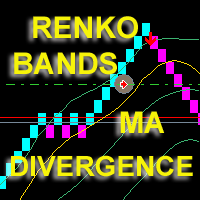
The Expert Advisor displays on a chart renko bars, Bollinger Bands and Moving Average indicators drawn based on Close prices. The EA opens and maintains trades based on divergence. Price peaks are determined when renko bars exit outside the Bollinger bands and move back. A sell trade is opened when the next price peak exists the borders of the upper Bollinger band and is higher than the previous one, and the divergence between the middle Bollinger line and the moving average is less than the poi
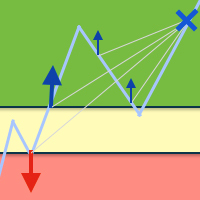
The Expert Advisor helps reduce the account drawdown. To do this, the losing deal is split into multiple small parts, each of these parts is closed separately. The EA can interact with other experts. For example, when a certain drawdown is reached, Open Lock can disable the other expert and start working with its orders. Open lock for MetaTrader 5 is available here
Methods used by the EA Locking to prevent a drawdown increase Averaging orders used to cover the loss Partial closure to reduce the

This indicator allows you to measure the profitability of each specific transaction (the ratio of Stop and Profit). The indicator allows you to adjust the ratio by step size and number of steps. You can build an unlimited number of ratios to compare the risks from different movements.
Note: in MT4, the number of horizontal lines in a single ratio cannot exceed 32.
Building a line : click the " Ratio " button and draw a line (mouse click - the first point of the line, where the mouse is release
Strongest and Weakest Currency Analysis This product shows the strength of the main currencies in FOREX based on average pip gain/loss in different time-frames! Depending on the strength of the currency, the indicator colors changes from blue to red also the orders may also be changed, allowing you to find the strongest and weakest currency at a glance!
Advantages Whatever your trading method and strategy are, it is always important to choose the correct pairs, so this indicator will help you a

Trends Hunter Expert Advisor is designed for medium-term trading. It is not a martingale and it does not depend on an account type (ECN, STP etc.) or spread level. This is a fully automated EA that features a custom algorithm for recognizing the price action and origination of a trend. If the EA identifies the beginning of a trend, one trade is opened. If a trend continues, the EA adds to the position. The number of addings is adjusted by the settings.
Options
Lots - fixed lot size; EMA1/EMA2 p

Mind Wave Trading Simulator is a training/trading utility for MetaTrader 4 that runs in both tester and real trade modes. It extends MetaTrader 4 functionality and makes trading easier in both tester and real trade modes. When used in the MetaTrader 4 tester, it offers traders an opportunity to practice and train their manual trading skills in accelerated speed. No need to wait for hours and days in real time demo trading to evaluate some manual trading strategy.
Features that extend MetaTrader

The script displays info about the share's corporate reports and dividends. The data is downloaded from investing.com : Report date Profit per share (EPS) Revenue Market capitalization Amount of dividends Date of payment of dividends Dividend income The product cannot be tested in the tester (since it is not possible to receive data from the Internet).
Before launching: Add 2 URL https://ru.investing.com/earnings-calendar/Service/getCalendarFilteredData and https://ru.investing.com/di
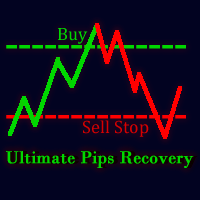
Ultimate Pips Recovery ( UPR ) is a unique, high quality and affordable trading tool, which is easy to use because knowledge of Forex trading is not much required to use this Expert Adviser. UPR does not require a specific time frame because it uses the technique that at every point, market will either go bearish or bullish. It opens a trade(say a buy trade) and immediately opens a sell stop position with a higher calculated lot size whose take profit is the same as stop loss of the previous ope

The RSI.MACD Warden is a powerful indicator for MetaTrader 4 that uses a versatile algorithm to identify RSI, MACD, and Stochastic divergences. This indicator is designed to look back at a set number of bars and draw lines when a normal or hidden divergence is identified. The smaller the lookback period, the faster the indicator will be. The indicator can identify both normal and hidden divergences and is more accurate in identifying normal divergences. We've conducted a great number of tests t

Shark Surfer is a new generation indicator applying a well-established trend-following trading. The product is good both for scalping, as well as medium- and long-term trading. Shark Surfer analyzes a selected symbol and shows the recommended market entry, take profit and stop loss levels. Shark Surfer trades on all symbols and timeframes. It also features email and push notifications concerning the new trading signals. The indicator searches for suitable market entry points on an already formed

An indicator of round levels. A range of important price levels with sound and text alerts, which are generated when the current Bid price of a currency pair is equal to a round number. This indicator visually shows the trader true support and resistance levels, which are used by most of traders and trading robots. The advantage provided by this indicator is that the trader using this indicator on a chart does not need to draw any additional levels. Round price levels represent a certain barrier

The Expert Advisor consists of three popular indicators: MovingAverage; Stochastic; MACD. It is possible to use all three indicators both together, and individually, selecting the necessary combination.
Basic settings of the Expert Advisor Magic - magic number of orders; Volume - trade volume; Slippage - slippage when opening orders; Stop Loss - close order at a certain loss in points; Take Profit - desired profit in points; Trailing Stop - move StopLoss to order's opening price when a positive

Hello, this EA is designed to scalp the market in the direction of the trend. I give you the ability to modify a lot of parameters in order to optimize the EA on different assets and timeframes. As a matter of fact, I noticed that the strategy is relatively adaptable among some Forex pairs and some assets from the daily timeframe to the 5 minutes one. I hope that you will be able to diversify your portfolio thanks to this skill. All backtests are done with a real tick database.
Parameters OBlon
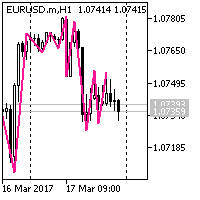
The ZigZag works as follows: On the left part of the chart, it finds a pivot point with the NumderOfBars parameter, which is a bottom. If the price action draws a top with the NumderOfBars parameter after this bottom, then the ZigZag draws a line from the bottom to the top. If the price action makes a new deeper Low, without forming a top, then the ZigZag extends the descending line to the new bottom. If the pivot point with the NumderOfBars parameter on the left side of the chart is a top, the

This utility is designed for testing the signal indicators (arrow or trend based). This utility allows quickly evaluating the efficiency of an indicator. To use this utility correctly, enter the exact name of your indicator in name_indicators. Then set filter 1 or 2, depending on the bar, where the order should be opened. Next, set the number of the buffer for buying and selling, set take profit and stop loss. The indicator is ready to be tested. This utility can be used in live trading as well.
MetaTrader mağazası, geçmiş verilerini kullanarak test ve optimizasyon için alım-satım robotunun ücretsiz demosunu indirebileceğiniz tek mağazadır.
Uygulamaya genel bakışı ve diğer müşterilerin incelemelerini okuyun, doğrudan terminalinize indirin ve satın almadan önce alım-satım robotunu test edin. Yalnızca MetaTrader mağazasında bir uygulamayı tamamen ücretsiz olarak test edebilirsiniz.
Alım-satım fırsatlarını kaçırıyorsunuz:
- Ücretsiz alım-satım uygulamaları
- İşlem kopyalama için 8.000'den fazla sinyal
- Finansal piyasaları keşfetmek için ekonomik haberler
Kayıt
Giriş yap
Gizlilik ve Veri Koruma Politikasını ve MQL5.com Kullanım Şartlarını kabul edersiniz
Hesabınız yoksa, lütfen kaydolun
MQL5.com web sitesine giriş yapmak için çerezlerin kullanımına izin vermelisiniz.
Lütfen tarayıcınızda gerekli ayarı etkinleştirin, aksi takdirde giriş yapamazsınız.