YouTube'dan Mağaza ile ilgili eğitici videoları izleyin
Bir alım-satım robotu veya gösterge nasıl satın alınır?
Uzman Danışmanınızı
sanal sunucuda çalıştırın
sanal sunucuda çalıştırın
Satın almadan önce göstergeyi/alım-satım robotunu test edin
Mağazada kazanç sağlamak ister misiniz?
Satış için bir ürün nasıl sunulur?
MetaTrader 4 için yeni Uzman Danışmanlar ve göstergeler - 81
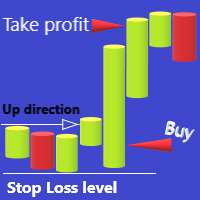
The Expert Advisor is designed for Forex trading as part of intraday trading. The adviser determines the main movement of the day up or down and opens positions according to the specified parameters. In the settings, you can set the average range of the day (you can see it using the ATR D1 indicator), lot, time and position opening level, as well as the take profit level. This Expert Advisor will greatly facilitate your trading if you open positions that are traded during the trading day. Expert

Global Trend Lines Zo'nalarını Gösteren Gösterge, işlem stratejinizi iyileştirmek için kullanılan birkaç özelliğe sahiptir. Bu gösterge, grafikte alım bölgesini ve satış bölgelerini belirlemenize yardımcı olur. Bu göstergenin temel özellikleri şunlardır:
1. Trend seviyelerini belirleme: Bu gösterge, trend seviyelerini belirlemek için kullanılan algoritmalara sahiptir. Bu, trendin yönünü ve gücünü belirlemenize yardımcı olur.
2. Alım ve satım bölgelerini belirleme: Gösterge, grafikte alım ve s

The initial price is 150 USD, the future price is 250 USD
Smart Neuro Trade Robot - The EA does not use the usual strategies for trading. The EA traps the price, gradually adding it up from orders opened using a safe and profitable strategy. He does not use dangerous strategies like martingale and its varieties. In whatever direction the market moves, the adviser will in any case close a series of orders in plus, because he will open deals in both directions and when he gets a profit he
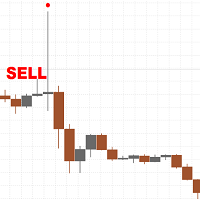
There are only a limited number of copies left, priced at 39 USD . After that, the price will be raised to 100 USD. The classic and most powerful price action pattern is called the pin bar. This pattern works well after the release of fundamental news on M15, M30 and H1 timeframes, but can also be used on other timeframes such as M5 or D1. By default, the settings are set for the H1 timeframe, but you can always adjust for other timeframes. Description of settings: % Pin Bar Size Volatility
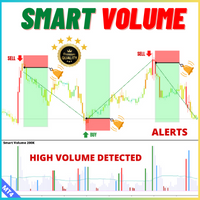
Description: For a comprehensive understanding of our indicators, we invite you to explore the entire Q&A section within this MQL5 blog post here . Technical indicators are crucial tools for analyzing market trends. Smart Volume, can help traders understand price movements and market strength. This indicator utilizes tick volume and price action to identify market trends and reversals. The Smart Volume indicator displays volume bars in blue, yellow, green, red, and white, each signifying dis
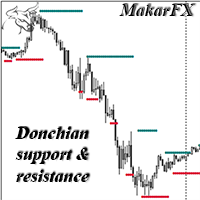
Support and resistance level indicator based on the Donchian channel. The most famous example of trading through the Donchian channel is an experiment with a group of turtles, who earned one hundred and twenty-five million dollars in five years. This indicator can be used as a standalone tool, as well as an additional confirmation. There is MTF, NRP. There are color and thickness settings.

Welcome to Propsense, the best solution for new and veteran traders with a simple FREE strategy! This indicator is a unique and affordable trading tool built on the teachings of a former bank trader. With this tool, you will be able to see inefficient points with ease. As well as this, traders will have an interactive display panel which will show your running and closed P/L in pips AND currency units. It also allows you to set your desired daily target/loss limit! IMPORTANT INFORMATION
Maximi
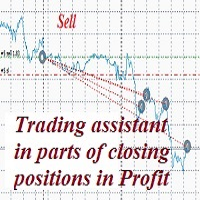
A trader's assistant that closes positions in parts with a simple trail to take the optimal profit size when the price of the symbol moves towards the position (s). Initially, the stop loss is moved to breakeven + (the so-called breakeven greed level) - this is when the price closes the stop-loss position during the reverse movement and as a result some profit will still be received. Further, while maintaining the movement in the direction of the position, it is closed in parts on price rollback
MoningLowrRisk Angel We trade as gentle as an angel. First entry only from 8:00 AM to 10:00 AM. Please put the difference between server time and Tokyo time in the time difference parameter. (XM,GEMFOREX>7,exness>9, winter time) 15,000 yen 0.01 lot high risk recommended. 30,000 yen 0.01 lot middle risk. 100,000 yen 0.01 lot low risk. You can try from a small amount, and since you can put up a large percentage of your money, the profit is quite large in spite of the low risk.
The trading advisor trades with money management elements, both using the martingale system and using the anti-martingale system, at the user's choice. You can choose the type of money management system in external variables. (Usage options with money management according to Martin or AntiMartin) Opens starting positions on the RSI indicator, after exiting the position on the take profit, increases the lot by the AntiMartin coefficient, again we enter the market on the RSI indicator. With Marti

This is a dashboard indicator that displays the Average Level of each selected currency pairs that filters and gives us a signal for overbought (>=90%) or if price at extreme peak above 90, and/or oversold (<=10%) or if price at extreme peak below 10.
The calculation is using Relative Strength Index default periods (2 & 9) applied to three different higher time frames H4,D1,&W1.
This won't change or altered even if you change symbol or switch to lower time frames or even in monthly and year
TPS DynamicFX Pro EA: Revolutionizing Forex Trading with AI Precision Unlock the future of forex trading with the TPS DynamicFX Pro EA, a groundbreaking expert advisor meticulously designed to navigate the complexities of the financial markets with unmatched accuracy and efficiency. Harnessing the power of advanced artificial intelligence, this EA is the ultimate tool for both novice traders seeking consistent profits and seasoned professionals aiming to enhance their trading strategies. Minimum
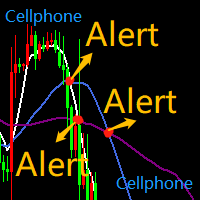
SMA5_SMA10_SMA55三均线系统,均线相互交叉,发送通知到手机 MT4 APP, 同时电脑桌面客户端也会发出警报通知。 注意:这个EA不会帮你下单交易,只会在均线交叉,即关键位置转向的时候给你发出警告,特别是手机通知,方便没时间盯盘的交易员放心出门,同时不会错过关键位置的转向,收到通知,打开手机APP就能处理头寸。是否变动头寸仓位,依然是要由自己判断。 均线的交叉往往意味着趋势的转向和启动,震荡的关键位置,请结合自我经验,以及趋势位置形态,多方位判断操作。 比如: MA5从下往上穿插MA10,则会向手机MT4 APP发出通知,提示多头有启动迹象,若有空单在手提示减仓。 MA5从上往下穿插MA10,则会向手机MT4 APP发出通知,提示空头有启动迹象,若有多单在手提示减仓。 -- MA10从下往上穿插MA55,则会向手机MT4 APP发出通知,提示多头启动,若有空单在手必须清仓,并且开多头。 MA10从上往下穿插MA55,则会向手机MT4 APP发出通知,提示空头启动,若有多单在手必须清仓,并且开空头。 -- MA5穿插MA55同理 -- 预祝:交易之路长虹! SMA5_SMA

TPS GBP & EUR Scalper Pro EA: Unleash the Power of Precision Scalping
Experience the cutting-edge of scalping technology with the TPS GBP & EUR Scalper Pro EA. This expert advisor is meticulously designed to capitalize on micro market movements in the GBP and EUR currency pairs, offering you unparalleled precision and profitability in your trading.
Ultra-Fast Execution: The TPS GBP & EUR Scalper Pro EA operates with lightning speed, executing trades in the blink of an eye. Take advantage of r

he expert works on the RSI levels on the previous candle With some digital way to enter the deal On the five minute frame Work on currency pairs only Do not use TakeProfit or Stop Loss How the expert works It is placed on the three currency pairs GBPUSD GBPJPY GBP AUD Same settings without changing anything When he works, he will work on only one currency of them until it closes on a profit Profit is only seven points Please watch the video Explains how the expert works. Max Spread = 0.3 Broker

TPS Gold Scalper Pro EA - Your Ultimate Scalping Solution Introducing the TPS Gold Scalper Pro EA, your advanced and powerful tool for successful scalping in the forex market. Designed to capitalize on short-term price fluctuations, TPS Gold Scalper Pro brings precision and efficiency to your trading strategy. Whether you're an experienced trader or just starting out, this expert advisor can help you achieve consistent profits through its innovative features and intelligent algorithms. Minimum

Hidden Gap by MMD Hidden Gap by MMD is a unique indicator that detects hidden gaps between three consecutive candles. This observation isn't my own, but in the MMD methodology, it has its application alongside other original indicators. You can apply this indicator to the chart multiple times and set the interval from which you want to see the hidden gaps. You can show or hide these gaps as needed. For example, you can view the chart at an M5 interval and see hidden gaps from an M15 chart, etc.
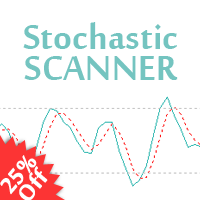
25% off. Original price: $40 Stochastic Scanner is a multi symbol multi timeframe Stochastic dashboard that monitors the indicator for price entering and exiting overbought and oversold in up to 28 symbols and 9 timeframes.
Download Demo here (Scans only M1 and M5) Settings description here MT5 version here
Stochastic Scanner features: Signals price entering and exiting the overbought and oversold zones. Monitors up to 28 customizable instruments and 9 timeframes at the same time. You ca

Tailored for traders with smaller accounts, this EA offers an opportunity to witness prudent profits while maintaining a cautious and controlled trading strategy. Chart Timeframe: 5-Minute
Market: EUR/USD
Trading Days: Monday to Friday Key Features: Profitable and Responsible: The "Dollar Trader" EA brings you the best of both worlds – profitability and risk management. Its algorithm strikes a fine balance between seizing opportunities and protecting your investment, ensuring that you can experi

Торговый робот предназначен для торговли криптовалютой по уровням Фибоначчи на рынке Форекс. Безопасность в торговле: постоянный стоплосс, тейкпрофит, защита от повышенного спреда, а лгоритм не использует опасные методы торговли - мартингейл, сетку и усреднение . Достоинством советника является торговля Мани Менеджмент (система управления капиталом) автоматический расчет лота на основе размера вашего депозита, автоматическая установка и перемещение уровней Фибоначчи. Установка отложенных ордеров

Простой и удобный индикатор, указывающий зоны стандартных индикаторов в различных таймфреймах, при необходимости можете в настройках изменить параметры RSI- Relative strength index. Стрелка вверх- если сигнальная линия ниже уровня 300, стрелка вниз- если сигнальная линия выше уровня 70 STOCH- Stochastic. Стрелка вверх- если сигнальная линия ниже уровня 20, стрелка вниз- если сигнальная линия выше уровня 80 ENVELOPE - Envelopes. Стрелка вверх- если свеча открылась ниже красной линии индика

This indicator shows when user set sessions are active and returns various tools + metrics using the closing price within active sessions as an input. Users have the option to change up to 4 session times.
The indicator will increasingly lack accuracy when the chart timeframe is higher than 1 hour.
Settings
Sessions
Enable Session: Allows to enable or disable all associated elements with a specific user set session.
Session Time: Opening and closing times of the user set session in the
Introducing the TPS Pair Hedging EA – Your Ultimate Solution for Precise Pair Trading Strategies! Are you seeking to navigate the intricate world of forex pair trading with finesse and efficiency? Look no further than the TPS Pair Hedging EA, your advanced trading companion designed to excel in dynamic market conditions. The TPS Pair Hedging EA empowers traders with a cutting-edge algorithm that seamlessly identifies and capitalizes on correlated movements within currency pairs. Through intellig

Anubis Skunk USES THE TREND WAVE INDICATOR AND IT CAN IDENTIFY THE BEGINNING AND THE END OF A NEW WAVE TREND MOVEMENT.
AS AN OSCILLATOR, THE INDICATOR IDENTIFIES THE OVERBOUGHT AND OVERSOLD ZONES.
IT WORKS GREAT TO CATCH THE SHORT TERM PRICE REVERSALS AND USES A MARTINGALE STRATEGY TO CLOSE ALL TRADES IN PROFIT.
USE DEFAULT SETTINGS ON H1 OR HIGHER TIME FRAME ON ANY PAIR FOR MORE ACCURATE TRADES
WHY THIS EA :
Smart entries calculated by 5 great strategies The EA can be run on even a $20000

Automatically detect bullish or bearish order blocks to optimize your trade entries with our powerful indicator. Ideal for traders following ICT (The Inner Circle Trader). Works with any asset type, including cryptocurrencies, stocks, and forex. Displays order blocks on multiple timeframes, from M2 to W1. Alerts you when an order block is detected, migrated, or a higher timeframe order block is created/migrated. Perfect for both scalping and swing trading in Smart Money Concepts. Enhanced by st

Gold Standard USES THE TREND WAVE INDICATOR AND IT CAN IDENTIFY THE BEGINNING AND THE END OF A NEW WAVE TREND MOVEMENT.
AS AN OSCILLATOR, THE INDICATOR IDENTIFIES THE OVERBOUGHT AND OVERSOLD ZONES.
IT WORKS GREAT TO CATCH THE SHORT TERM PRICE REVERSALS AND USES A MARTINGALE STRATEGY TO CLOSE ALL TRADES IN PROFIT.
USE DEFAULT SETTINGS ON H1 OR HIGHER TIME FRAME ON ANY PAIR FOR MORE ACCURATE TRADES
WHY THIS EA :
Smart entries calculated by 5 great strategies The EA can be run on even a $200

Goldmine Ventures USES THE TREND WAVE INDICATOR AND IT CAN IDENTIFY THE BEGINNING AND THE END OF A NEW WAVE TREND MOVEMENT.
AS AN OSCILLATOR, THE INDICATOR IDENTIFIES THE OVERBOUGHT AND OVERSOLD ZONES.
IT WORKS GREAT TO CATCH THE SHORT TERM PRICE REVERSALS AND USES A MARTINGALE STRATEGY TO CLOSE ALL TRADES IN PROFIT.
USE DEFAULT SETTINGS ON M15 OR HIGHER TIME FRAME ON ANY PAIR FOR MORE ACCURATE TRADES
WHY THIS EA :
Smart entries calculated by 5 great strategies The EA can be run on even a

ROYAL DUTCH SKUNK USES THE TREND WAVE INDICATOR AND IT CAN IDENTIFY THE BEGINNING AND THE END OF A NEW WAVE TREND MOVEMENT. AS AN OSCILLATOR, THE INDICATOR IDENTIFIES THE OVERBOUGHT AND OVERSOLD ZONES. IT WORKS GREAT TO CATCH THE SHORT TERM PRICE REVERSALS AND USES A MARTINGALE STRATEGY TO CLOSE ALL TRADES IN PROFIT. USE DEFAULT SETTINGS ON H1 OR HIGHER TIME FRAME ON ANY PAIR FOR MORE ACCURATE TRADES WHY THIS EA : Smart entries calculated by 6 great strategies The EA can be run on even a $20000

The Donchian Scanner Signals Indicator with is a powerful tool designed for traders operating in the financial market using the Metatrader 4 platform. This indicator combines the popular Donchian Channels strategy with advanced signalization and real-time alert features, providing a clear view of potential entry and exit points in a financial asset. Key Features: Donchian Channels Visualization: The indicator graphically displays Donchian Channels on the price chart. These channels are formed us

Fully Automated EA Running Jakarta At Night
Jakarta At Night is the dynamic grid system .
Supported currency pairs: All Forex Pair
Recommended Timeframe: M15 [Low Risk] or M30 [High Risk]
Live Performance Features: One Chart Setup: you only need one chart to trade all symbols
Multiple currency pairs support or single pair only
Requirements
The EA is NOT sensitive to spread and slippage. But I advise using a good ECN broker
The EA should run on a VPS continuously , I advise to using a low late

Introducing Black Spark - Your Path to Informed Investing. Investment decisions can often feel overwhelming for investors. However, with Black Spark, you can seize control and make well-informed choices. Our cutting-edge system is designed to provide you with up-to-the-minute information by analyzing vast amounts of real-time market data. Through advanced algorithms, we identify patterns and trends, delivering personalized recommendations that align with your unique investment preferences. Our a

Hey traders, it's easy for you to find when to buy or sell signals. Can be used for all forex pairs including gold. How to use this indicator on the M30 or H1 timeframe, for a buy signal, wait until an up arrow appears and for a sell signal, wait for a down arrow, place a stop loss 5-10 points below the arrow. Better trading time on the London and New York sessions and avoid trading when there is news. Happy Trading

This is a dashboard indicator that displays the auto-calculated risk lot, with the given risk percentage & risk points (Stop Loss) and others. The main function of this indicator is to help you calculate your exact scalping risk lots and swing risk lots. Also it displays the active trades of each pair you've executed with the following: type of trade, lot size, symbol, & equity(+/-). Also displays the bar counter set in every 5-minute bar timer. (whichever time frame you're active, the bar time

**Binary Smart System: En İyi İşlem Yardımcınız**
Binary Smart System sadece bir gösterge değil, piyasaların çeşitli alanlarında hassaslıkla işaretler üreten sofistike bir işlem aracıdır. Keskin algoritmaların ve geniş bir teknik gösterge koleksiyonunun birleşiminden oluşan bu sistem, işlem başarınızı en üst düzeye çıkarmak için tasarlanmıştır.
**Gösterge Bileşenleri:**
1. **Hareketli Ortalama Yüzdesi (HAY):** Bu bileşen, birden fazla hareketli ortalamanın ağırlıklı ortalamasını hesaplar ve

Tam STO göstergesi (üç STO göstergesinin tüm sürümlerini içerir: Premium, Gold, Silver) - STABLE TRADE OPTION, otomatik ikili opsiyon ticareti için tasarlanmıştır. DİKKATLİCE OKUYUN!!!!!
ÖNEMLİ Bir terminalde farklı sürelere sahip iki şablon oluşturun: 18:01, 18:02 için 1 ila 15 dakika arasında süreleri olan bir şablon ve 22:00 için 10 ila 20 dakika arasında süreleri olan bir şablon. Kazanma oranı: Son 5 yılda %71
Para yönetimi: Mevduattan %0,3
Göstergenin bu sürümü yalnızca Gümüş ve Altı

Grafiklerinize manuel olarak Fibonacci seviyeleri çizmekten sıkıldınız mı? Ticaretinizdeki temel destek ve direnç seviyelerini belirlemenin uygun ve etkili bir yolunu mu arıyorsunuz? Başka yerde arama! Otomatik fibonacci seviyeleri yapan nihai MetaTrader 4 göstergesi olan DrawFib Pro ile tanışın grafikleriniz üzerinde çizim yapar ve bu seviyeler aşıldığında zamanında uyarılar sağlar. DrawFib Pro ile ticaret stratejilerinizi geliştirebilir, zamandan tasarruf edebilir ve daha bilinçli
FREE
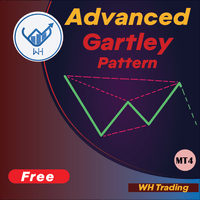
Gelişmiş Gartley Modeli tanıma göstergesine hoş geldiniz Bu gösterge, fiyat yapısının HH ve LL'sine ve Fibonacci Düzeylerine dayalı gartley desenini tespit eder ve belirli fib seviyeleri karşılandığında, gösterge grafiği grafikte gösterir. MT5 Sürümü: WH Advanced Gartley Pattern MT5
**Bu Gösterge, kombinasyonun bir parçasıdır WH Ultimate Harmonic Patterns MT4 Tüm model tanımayı içeren .** Özellikler : Gartley paternini yüksek ile tespit etmek için Gelişmiş Algoritma Doğruluk Çok
FREE
"TPS Gold Scalper EA - High-Risk Edition: Seize Gold Trading Opportunities with Aggressive Precision Minimum Equity :- 1000 $ Trading Timeframes :- H1 Recommended pair :- XAUUSD
Experience the next level of gold trading with the TPS Gold Scalper EA - High-Risk Edition. Designed for traders who thrive on high-risk, high-reward strategies, this advanced trading robot is your ticket to harnessing rapid price movements in the gold market.
Aggressive Scalping Algorithm: The TPS Gold Scalper EA is
FREE
giriiş Pozitif takas oranlarına odaklanan uzman Forex Martingale Multi Swap. Bu uzman, negatif masraflardan kaçınmak için sadece pozitif takas yönünde işlem yapar ve bu da, emrin gecelik takas faiz ücretlerine maruz kalması durumunda bunların her zaman pozitif olacağı ve bundan ekstra kazanç elde edeceğiniz anlamına gelir. Uzman, çoklu ticaret tipindedir ve tek bir diyagramdan aynı anda 28'e kadar Forex majör/minör sembolünü işler, bu da onu çok verimli ve okunması kolay hale getirir. Göreceli

Golden Cross EA is an automated trading solution designed to capitalize on the 'Golden Cross' pattern, a powerful bullish signal generated when a short-term moving average crosses above a longer-term moving average. This expert advisor identifies and acts upon this favorable market condition, executing buy trades to potentially capture upward price momentum. The EA features customizable lot size, stop loss, and optional trailing stop functionality, enhancing trading flexibility and risk manageme
FREE

Ilan Gold H1 is an enhanced version of the famous Ilan robot designed for the XAUUSD currency pair. This robot is highly optimized for trading gold. The recommended timeframe is H1. The robot actively opens trades throughout the day and closes open orders either using Take Profit or by averaging the overall profit of the grid orders. It uses signals from multiple technical indicators for market entry. Advantages of the robot: Optimized for XAUUSD. Compatible with all brokers offering XAUUSD with
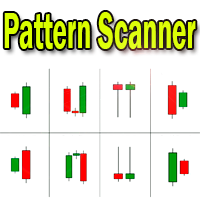
Candlestick pattern indicator - display found candlestick patterns on the chart. MT5-version: https://www.mql5.com/en/market/product/103134 Bearish patterns: Bearish Pattern Designations Pattern name SS
Shooting Star STR(S) Evening Star DJ(E) Evening Doji Star DC Dark Cloud Veil BEP Bearish Engulfing Bullish patterns: Designation of bullish patterns Pattern name HMR
Hammer pattern
STR(M) Morning Star DJ(M) Morning Doji Star PRL Piercing Line BEP Bullish

Renko, Heiken Ashi, Ticks Bar, Range Bar. Easy switching, easy setup, all in one window. Place the Custom Chart indicator and view Renko, Heiken Ashi, Tick bar, Range bar charts in real time at real chart. Position the offline chart window so that the indicator control panel is visible. Switch the chart mode by click of a button. Connect to the output chart any indicator, expert advisor without any restrictions. No, it doesn't work in the tester. Yes, you can use an

Description: First of all Its worth emphasizing here that the Trend Breakout Catcher is Non-Repainting, Non-Redrawing and Non-Lagging Indicator, Which makes it ideal from both manual and robot trading. The Trend Breakout Catcher Indicator employs a sophisticated algorithm designed to predict trends early and generate timely Buy and Sell signals at the onset of a breakout. Utilizing a smart calculation based on numerous elements, the indicator forms a robust and redundant system to detec

US30 Revolt a Technical indicator that is 100% non-repaint and appears on the current candlestick works on all timeframes (recommended M15,M30,H1) The indicator is made for US30 but it can be used on other pairs as well When a blue arrow appears look for buying opportunities When a orange arrow appears look for selling opportunities Please watch the YouTube video on how to properly set up and use the indicator
FREE

Easy Scalp is a classical indicator-based scalping EA, which can be easily optimized for every currency pair. The EA always places fixed stop loss and take profit and doesn’t use averaging. 2 copies are left for $69. The next price is $89. Monitoring: https://www.mql5.com/en/signals/2026299 Advantages Doesn’t use dangerous strategies Can work with small deposit Doesn’t sensitive to spread Fast optimization Fixed stop loss Requirements Minimal deposit : 10$ Account type: any, ECN is preferred Cur

EA Pivot SR is a free version of a fully automatic Expert Advisor for MT4. There are no sewn-in deals, as is the case with most fraudulent advisors. Transactions in the tester and in real trading will correspond exactly to 99.99%.
The strategy of the Expert Advisor is based on trading from levels, which is the most acceptable solution than focusing on indicators that are usually late and give signals several bars late.
Support and resistance levels are calculated using the Pivot Point s
FREE

Hello Dear Trader, Today Im Telling You About The "Golden Scalp System V1 " Metatrader4 Golden Scalp System
Scalper with EMA This is a Scalper strategy based on ( Exponential moving average) EMA . Time frame: H1 Pair: EUR/USD, GBP/USD,AUD/USD XAU/USD
Platform Mt4 Indicators for Scalper with Ema: 300 EMA (Exponential Moving Average) ; 500 EMA (Expontial Moving Average); Stochastic (5,3,3) Long Entry
1) 300 EMA > 500 EMA .
2) Find significant levels of support.
3) Wait for the c

The next price of the adviser will be 159 $ EA Pivot SR is a fully automatic Expert Advisor for MT4. There are no sewn-in deals, as is the case with most fraudulent advisors. Transactions in the tester and in real trading will correspond exactly to 99.99%.
The strategy of the Expert Advisor is based on trading from levels, which is the most acceptable solution than focusing on indicators that are usually late and give signals several bars late.
Support and resistance levels are calculated us

The ICT Silver Bullet indicator is inspired from the lectures of "The Inner Circle Trader" (ICT) and highlights the Silver Bullet (SB) window which is a specific 1-hour interval where a Fair Value Gap (FVG) pattern can be formed. A detail document about ICT Silver Bullet here . There are 3 different Silver Bullet windows (New York local time):
The London Open Silver Bullet (3 AM — 4 AM ~ 03:00 — 04:00)
The AM Session Silver Bullet (10 AM — 11 AM ~ 10:00 — 11:00)
The PM Session Silver Bullet (2

Introducing TPS Bengal Tiger EA: Unleash the Fierce Power of the Market
Roar into the world of forex trading with the TPS Bengal Tiger EA, your ultimate companion for conquering the financial markets. Just like the majestic Bengal Tiger, this expert advisor is designed to prowl the trading landscape with precision and strength.
Ferocious Performance: TPS Bengal Tiger EA combines cutting-edge algorithms with a predator's instinct, swiftly navigating the volatile forex terrain to seize profit o

This EA Optimize for EURUSD with Time frame 1 Hrs. Indicator and System trend 1. Used 2 EMA for confirm Trend 2. Used Price action cross above for entry 3.Open another when same Item1,2 4.Have closed all 5.Used fix lot and second order can adjust Average open 1-3 Order /Month DD independent for Lot start and Lot X I will training and review How to work EA 1 hrs. for your understanding. This EA make for manual trade if you understand staggery you Can trade by you manual trade.

Индикатор рассчитывает волатильность относительно свечи заданной в настройках, в заданном диапазоне. period -диапазон для расчета максимум минимум. point - номер свечи от которой будет рассчёт (нуль текущая цена). По всем вопросам можно обратиться на сайте через форму обратной связи или в комментариях в ютюб. Также на сайте есть другие работы ссылка в индикаторе на вкладке общее .
FREE

Hi, let me explain about this EA. This EA is used to trade news with very high news strength. I have attached a brief video of how the EA works. This EA will start opening orders by Enter the time for the EA to start and can choose the first order for the EA to open the order, then the EA will calculate the lot and open the order, this EA is used to calculate the total distance from the ATR indicator. such as Stoploss, Trailingstop, etc.
* This EA is compared to playing the lottery in principle

CCI Robot is a trading robot that mainly uses the CCI indicator to trade signals, including Money management and placing orders with Oversold, Overbought, Level Trading, and Grid distance. And can trade with Money Management with Martingale recovery loss to profitable or Fix each lot size depending on each trading style. for flexibility in Money management.
The Trading algorithms. 1. Trade according to CCI signal. 2. Open order two ways that trading both BUY and SELL. 3. Open orders with d

PowerXXX measures the power of the current candlestick and displays it in numerical format and colors. The indicator can cover multiple timeframes and can be placed on the main chart or on the charts of the underlying indicators. The number of timeframes is selectable, as well as the color levels according to the power expressed. In the latest version, the power can be expressed as a function of the opening of the candle itself or as a function of the opening of the total candles before. There
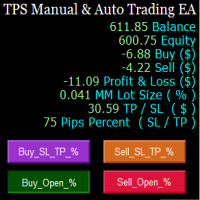
"TPS Manual & Auto Trading EA: Your Ultimate Trading Partner
This is Plug on Play to enjoy Manual Trading Management ,
Mobile Trading :- install on vps after Use this ea work with mobile .
Take your trading experience to the next level with the TPS Manual & Auto Trading EA – the perfect blend of human expertise and automated precision.
Seamless Transition: Seamlessly switch between manual and automated trading modes to match your preferred trading style and market conditions. Retain contro

This is an advanced index algorithm, it provides a very accurate top-bottom signal, it will not frequently appear the wrong signal during the trend, this index does not have any redrawing, drift, or lag behavior. When this signal appears on the chart, it means that the market is about to reverse, or that a period of trend market is over, and then the market will be transformed into a consolidation market, and this indicator does not need to adjust the parameters. It applies to any currency pai
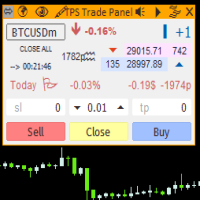
"TPS Trade Panel: Your Gateway to Effortless Trading
Introducing the TPS Trade Panel – the ultimate tool to streamline and enhance your trading experience across financial markets. Whether you're a novice or a seasoned trader, this feature-rich panel empowers you to execute trades swiftly and make informed decisions with ease.
Efficient Order Execution: Execute trades across multiple financial instruments without the need to navigate through complex menus. With a few clicks, you can open, clo
FREE

The ten moving average expert advisor is an idea worth trying. Instead of trading in one unified contract, I tried to divide it into ten parts, each part linked to a moving average, starting from moving average 10 to 100. You can change the settings of the movers according to your desire Be sure that in the sideways direction, not all of your deals will be losing. Rather, a number of deals will be profitable and others will be losers, and perhaps a tie, and this is good. The big surprise is tha

This indicator is very advanced. I dare say that there is no second indicator in the world that describes false breakthroughs so accurately. When the market hits a certain level three times in a row, the market will first break through this level and then return to the inside of the horizontal line. At this time, our indicator will send a signal to alarm that this is a standard fake breakthrough, the index has not been redrawn, the signal has not been delayed, and everything is true and reliable

Strength of 8 popular currencies (EUR, GBP, USD, CAD, AUD, NZD, CHF, JPY) is calculated from 28 pairs of Forex market following a Moving Average with custom period and method. You can use it by adding 2 indicators to the chart of Forex pair based on the pair currencies and use it as a confirmation on your strategies.
Currencies: EUR, GBP, USD, CAD, AUD, NZD, CHF, JPY
Inputs: Currency: 1 of the 8 currencies MA Period: Period of Moving Average MA Method: Method of Moving Average (SMA, EMA, SMMA

A simple but useful indicator for controlling volatility in intraday trading.
The indicator plots the average volatility (ATR) levels for the specified number of days on the current chart.
On the current trading day, the levels are dynamic and move depending on the minimum and maximum prices of the current day in "real time" mode.
In the input parameters we specify:
- the number of days to calculate and draw the ATR levels
- color of the ATP level lines
- the thickness of the ATR level li
FREE

TrendFinder VolumeI are Colored candlesticks showing the trend based on Volume and Slope of Trend
This indicator will give you the color change on the next bar on the confirmation candle and will never repaint Lime Green = Possible Buy (Volume up), Teal Green = Bullish Weak (Volume Decreasing), Red = Possible Sell (Volume up) , Orange = Bearish Weak (Volume Decreasing)
TrendFinder Volume is optimize to trade on any market and to be used trending and None trending markets. For best results use
FREE

Gold Island is an Expert Advisor that make your trading very smooth and safe. Following features has been added to the EA. Feature : Risk management in percent of total balance Take profit points Martingale methods Close trade in average profit Low drawdown Parameters: Take profit = Points to take profit & close trades Trade distance= From how far away the 2nd, 3rd trade to be opened. Starting lots= Trade size to be open at starting. Multiplier value= How frequently trade size should be incre
FREE
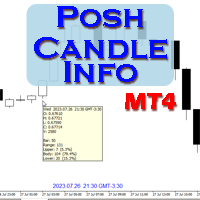
Show candle info with: Time in selected timezone Bar number Candle range points Upper wick points and percentage Body points and percentage Lower wick points and percentage Mark large/small candle body with customizable line. Settings group: Broker and local timezone. Lookback bars for candle marking. Large candle body Small candle body Date and time info with auto position or custom the x and y coordinate.
FREE
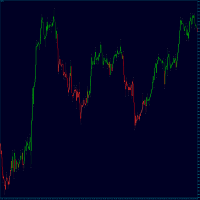
TrendFinder RSI are Colored candlesticks showing the trend based on The Relative Strength Index (RSI) This indicator will give you the color change on the next bar on the confirmation candle and will never repaint TrendFinder RSI is optimize to trade on any market and to be used trending and None trending markets. For best results use this indicator as an extra tools after you have completed your regular analysis and use it for alerts based on such analysis.
FREE

The Visual Result Calculator Indicator is a powerful tool designed to enhance your trading experience on the MetaTrader platform. This intuitive and user-friendly indicator allows you to visualize potential profits or losses on a trading chart, helping you make better-informed decisions and manage your trades with precision. The Indicator displays a dynamic line on the trading chart, representing the potential profit or loss of a trade based on the start and end of the line. Simply click and
FREE

BM Plug&Play Easy to use, convenient and efficient! No input from you required, no messing with settings or optimization processes , just attached on chart and let it do its magic.
Recommended Time Frame: Day (This expert advisor works on all timeframes, but it’s build with the daily one in mind); Account balance: it doesn't matter, but I recommend at least 1000 EUR or 1500 USD; Tested and optimized currency pairs: EURUSD; EURCHF; EURJPY; EURAUD; EURCAD; EURNZD; USDCHF; USDCAD; USDJPY; G

Introducing "Cable Champ" - Your GBPUSD Swing Trading Expert Advisor for MT4!
BACKGROUND:
Step into the rich historical significance of the GBPUSD currency pair, affectionately known as "Cable." Dating back to the early 20th century, the name originated from exchange rates transmitted via a transatlantic cable between London and New York. Today, GBPUSD remains a global powerhouse, linking the British Pound (GBP) and the US Dollar (USD) as one of the most actively traded pairs in the forex mar
MetaTrader mağazası, geliştiricilerin alım-satım uygulamalarını satabilecekleri basit ve kullanışlı bir sitedir.
Ürününüzü yayınlamanıza yardımcı olacağız ve size Mağaza için ürününüzün açıklamasını nasıl hazırlayacağınızı anlatacağız. Mağazadaki tüm uygulamalar şifreleme korumalıdır ve yalnızca alıcının bilgisayarında çalıştırılabilir. İllegal kopyalama yapılamaz.
Alım-satım fırsatlarını kaçırıyorsunuz:
- Ücretsiz alım-satım uygulamaları
- İşlem kopyalama için 8.000'den fazla sinyal
- Finansal piyasaları keşfetmek için ekonomik haberler
Kayıt
Giriş yap
Gizlilik ve Veri Koruma Politikasını ve MQL5.com Kullanım Şartlarını kabul edersiniz
Hesabınız yoksa, lütfen kaydolun
MQL5.com web sitesine giriş yapmak için çerezlerin kullanımına izin vermelisiniz.
Lütfen tarayıcınızda gerekli ayarı etkinleştirin, aksi takdirde giriş yapamazsınız.