YouTube'dan Mağaza ile ilgili eğitici videoları izleyin
Bir alım-satım robotu veya gösterge nasıl satın alınır?
Uzman Danışmanınızı
sanal sunucuda çalıştırın
sanal sunucuda çalıştırın
Satın almadan önce göstergeyi/alım-satım robotunu test edin
Mağazada kazanç sağlamak ister misiniz?
Satış için bir ürün nasıl sunulur?
MetaTrader 4 için yeni Uzman Danışmanlar ve göstergeler - 266
Attention! Friends, since there have been many scammers on the Internet recently selling indicators called ForexGump, we decided to warn you that only on our page is the LICENSE AUTHOR'S VERSION of the INDICATOR sold! We do not sell this indicator on other sites at a price lower than this! All indicators are sold cheaper - fakes! And even more often sold demo versions that stop working in a week! Therefore, in order not to risk your money, buy this indicator only on this site! Forex Gump Scalpin

The CSM System is currently fully automated with all the special features and functions, controlled and regularly monitored. Its evolution, parameters and the individual algorithms are professionally evaluated and optimized by experienced development group of programmers who are developing new updated versions of system. Unlike the other systems, we focused to create the system where the backtesting successful results matching the real life situation. Our core lies in identification of these bi

DYJTRENDWAVE features an advanced algorithm that detects new trends and current trend continuations for use as an entry strategy. DYJTRENDWAVE's volatility is based on the power of buyers and sellers, it grabs total body size of candles and identifies the battle between buyers and sellers as a percentage of the total volume, like Sellers: (-)100% and Buyers: (+)100%. This information can be used for any entry and exit strategy. For bullish/Long Pin bar it is below the price line, for bearish/Sho
This scanner is a tool used to support trading with the Ichimoku method. Its basic features are: 10 trading setups implemented in accordance with the Ichimoku technique, the possibility of simultaneous scanning, all financial instruments available on the platform, the possibility of simultaneous scanning, in all timeframes available on the platform, two trading modes available: Manual and AutoTrading, the ability to open in Manual mode from the level of the chart, the ability to determine the si

Spread And Swap Dashboard is a nice tool that lets us know all the minimum and maximum spreads of the instruments that we trade. In addition to the spread information we also find the Bid & Ask values that always are very useful. We also considered it important to include positive and negative swap values so that we can better evaluate possible strategies of Carry Trade. The tool proves useful in times of high volatility to record all the values of spreads and have a better understanding of the

Folding rule of 4 trend lines The indicator has been created based on the "Folding rule" trading strategy. It shows four pairs of inclined resistance and support lines. These lines are plotted based on the nearest High and Low of the ZigZag technical indicator with four given input parameters. The indicator draws dots above and below the price extremums that have been used for plotting the trend lines. The indicator of trend lines facilitates the plotting of trend lines, channels and technical p

The Extreme Breakout EA is a fully automated multi currency Expert Advisor that trades time based breakouts and has various options to improve performance. The Extreme Breakout EA trades using pending orders and has the option to enter using market orders if required. View More Products - https://www.mql5.com/en/users/robots4forex/seller#!category=1
Monitoring Signals - https://www.mql5.com/en/signals/author/robots4forex?orderby=gain Designed for USDJPY. Features Fully automated Not sensitive t

Market Profile helps the trader to identify the behavior if major market players and define zones of their interest. The key feature is the clear graphical display of the range of price action, in which 70% of the trades were performed. Understanding of the location of volume accumulation areas can help traders increase the probability of success. The tool can be used as an independent system as well as in combination with other indicators and trading systems. this indicator is designed to suit

Supporta is a trading indicator that automatically identifies support and resistance levels and their strengths from price movements and draws them on price charts. The instrument supports both the MetaTrader 4 and MetaTrader 5 terminals and can be used on any financial instrument and any timeframe. The MetaTrader 5 version is available on the market as Supporta MT5 . For full documentation and quick start, please refer to the official guidebook which is available for download in the comments se
This product combines Stochastic Oscillator and RSI. Usage is as follows. This indicator works with M1 and M5 timeframes. This indicator uses Stochastic oscillator and RSI. The picture shows Stochastic x1 (Red) and RSI x2. You can open a short position when each Stochastic, RSI (Blue) and RSI (Yellow) become more than 95, 70, and 70, or a long position at values less than 5, 30, and 30, respectively.
Range Bar Chart — opens range bar charts for MetaTrader 4. The utility allows you to create charts of range bars on which all candlesticks are the same size and may have shadows. Data on the range bar chart are distributed by the bar size, rather than by the time. Each bar represents the price movement instead of time period. It works simple – the bar is not drawn as long as the price does not move. You can add indicators, EAs and scripts to the resulting chart. You get the completely operationa
The Wave Scalper EA is fully automated scalping system that uses price action to identify good scalping trades and executes them with an invisible trailing stop loss. It also includes a money management feature which calculates lot size based on account size and risk with an option to set a maximum draw down at which the EA will stop trading. This is a long term strategy combined with money management which works well on most pairs, but predominantly GBPUSD, USDCAD, EURUSD, AUDUSD & USDJPY. Plea
FREE

Telegram ChartSnap is an utility tool to bridge your MetaTrader 4 activities to your Telegram chat/group/channel. It will screen shot your MetaTrader 4 chart and send it to your dedicated Telegram chat/group/channel through a Telegram bot. The whole process will keep repeating based on a time cycle that predetermined by the user. It is a convenient tool for those who like to get access to their favorite system/dashboard that only available at MetaTrader Desktop. Beside that, trader can easily s
FREE

This indicator is different from the conventional indicator by an additional set of parameters. The ADX line changes color depending on the location of the +DI and -DI lines relative to each other.
Indicator Inputs Period — indicator calculation period; Method — select the averaging method: simple, exponential, smoothed, linear-weighted; Apply to — select the applied price: Close, Open; High; Low; Median; Typical; Average Weighted; By default, the directional lines are colored in the following

Telegram ChartSnap is an utility tool to bridge your MetaTrader 4 activities to your Telegram chat/group/channel. It will screen shot your MetaTrader 4 chart and send it to your dedicated Telegram chat/group/channel through a Telegram bot. The whole process will keep repeating based on a time cycle that predetermined by the user. It is a convenient tool for those who like to get access to their favorite system/dashboard that only available at MetaTrader Desktop. Beside that, trader can easily s

This is an extension of the Average True Range indicator with the breakdown of price gain, loss, and standard deviation; with the price break down into price gain and loss, this can now be used as an oscillator with standard deviation as the queue to time the entry and exit.
Settings ATR Period - Typically set at 12. ExtStdDev Period - This the period for the Standard Deviation and it typically follows the ATR Period.
How to use Buy / Sell Direction - If the green (gain) is higher than the los

True channel indicator builds the linear regression channel. The channel consists of the support/resistance line rays, as well as the averaging trend line.
Extra info displayed by the indicator support/resistance price for the current bar channel width channel slope current price position relative to the channel in %
Options Bars for calculation - number of bars for building the channel Price for calculation - price used for the channel borders construction (Close, High/Low and Open).
This EA has been developed for DAX (DE.30) M5 and is based on breakout of the Linear Regression channel. It uses Stop pending orders with ATR Stop Loss and Take Profit. In this strategy we are limiting signals from 8:30 am to 9:30 pm. At 9:30 pm we are closing trading every day. Adjust this time to your broker time. Preset values are for UTC+1 only. For every candle the pending orders are modified to adapt the market behavior. Everything is already set up for DAX M5. Strategy is suitable only fo
Fibo Martingale System is martingale grid Expert Advisor, that is specially tailored for EURJPY. It trades long and short positions in the same time using its lot size progression on every grid level. The timeframe is not important, it does not trade on bar close. The most important think to respect is - for 0,01 starting lot you need an account of 25 000 $ at least - using smaller account is at your own risk. The default settings are ready to go, you do not need to change anything. By default t

Endeavor EA does not use indicators. It trades the strategy based on trading by hours and the breakout of support and resistance levels. Logic of the EA: it trades during the active phases of the Asian, European and American sessions and allows you to capture almost all the daily trend. It analyzes the history and places pending orders to follow the market direction in case of a breakout. The EA provides the options to close orders by profit or by time. When the price moves in the favorable dire

This is an automatic 24-hour trading system based on the algorithm of collective behavior of adaptive automata (a kind of algorithms of self-learning of artificial intelligence) that does not require manual intervention and does not use any indicators or well-known trading methods. The principle of the EA is to remember and analyze each step. A step is a price movement for a certain number (BaseStep) of points up or down. The depth of memory (how many steps to remember and analyze) is determined

Ants Lite ATR allows you to enter and manage your trades based on the market volatility, giving you safer entries and better exits. Based on the work by Daryl Guppy.
Features Ability to define the bar the Long and Short calculation starts from. Can be used to generate both entry or exit signals. Customizable ATR period and multiplier. GMMA is a tried and tested indicator with a long pedigree. Volatility based entry and exit signal rather than time based.
How To Use Simply drag the indicator fr

NN8D Points is one of the indicators included into NN8D ( N ikolsky's N esting D oll) trading system. NN8D Points is an indicator containing multiple tools for analyzing Forex market: candle analysis and area system. Rather than simply averaging by Open, Close, High and Low prices, NN8D Points performs a complex analysis of the current and previous bars by various parameters: bar color; bar body size; bar wicks; bar core (average value between Open and Close, as well as between Lows and Highs);

This indicator alerts for potential buy and sell using exponential moving average. The indicator supports push notifications, terminal alerts, and sound alerts. I am an active developer who studies Forex and will continue to update this indicator with new features. It is customizable for one minute, five minute, fifteen minute, thirty minute, one hour, four hour, daily, weekly, and monthly timeframes.
Recommendations Indicator Settings : Use default settings. If scalping set M1 and M5 to true a

This is a fully automatic Expert Advisor. It can trade any market, any timeframe and any currency pair. The EA uses simple indicators like SMA, RSI and CCI, and a smart martingale system, that does not open systematical new positions, but waits for a new signal for each new order, wich is limiting drawdown compared to other martingale systems. It uses a combination of seven strategies you can select in the parameters to fit your needs. The strategy tester in MetaTrader 4 can give you the setup y

Interactive assistant for manual trading on a real account. The robot monitors the phenomenon of market asymmetry, which occurs after the manual entry time has been set. It uses the price movement in any direction relative to the entry point. Provides implementation of many different trading strategies. Manual intervention in the process of deal management is allowed.
Trading strategies You can use any strategy for manual trading based on tracking of the price deviation from the market entry po

- We all want to have the lowest spread and never high, with this utility we can have more information and a clearer idea of when the spread is acceptable or not. The Panel InfoSpread is a utility expert advisor and shows information on different spread options in one or more symbols, can be actual spread, average, minimum, maximum and tick counter. Read and show the symbols that are in the Market Watch window. Also you can put a maximum limit of average spread in every symbol for know when

NC Night EA is an ultra-short-term EA system based on moving average during the night swing market, supporting single currency or multi-currency operations. Short-term operation when oscillating at night. According to the average movement of the swing period, judge the timing of entry. Set the stop loss range by yourself and the risk is more controllable The risk level can be flexibly set. Of course, risk and profit are often proportional too.
Parameters MoneyManagementType: Fund management mod
The panel works as a filter, finding patterns based on the Volume Spread Analysis technique. Search is carried out for selected trading instruments and all available timeframes. It is possible to add and remove instruments. Clicking the signal button allows you to quickly move to the chart with the identified pattern and timeframe. It can also search in history (by previous bars) with the buttons "<<" and ">>". The panel can be scrolled using the "UP" and "DOWN" keys.
Input parameters Basic Set

This indicator displays Bollinger Bands signals for multiple symbols and multiple time frames. The signals are created as a simple ratios which represent the distance between the current price and the moving average measured in standard deviations. This way we create a very versatile and easy to use indicator which helps us to identify not only the strongest trends but also the most overbought and oversold conditions.
Features Accurate signals in real time for multiple time frames and multiple

Rental/Lifetime Package Options and Privileges'
Rent Monthly Six Months Yearly/Lifetime Weis Wave with Speed with Alert+Speed Index x x x Manual x x x Quick Set up Video x x x Blog x x x Lifetime Updates x x x Setup and Training Material
x x Rectangle Break Alert Tool x Discord Access Channel "The SI traders"
x How to trade info visit: http://www.tradethevolumewaves.com ** If you purchase please contact me to setup your : Two hour webinar and training Room and complete m

This indicator is designed to detect the best of all candlestick reversal patterns: Three Line Strike . According to the bestselling author and candlestick guru Thomas Bullkowski, this pattern has a winning percentage between 65% and 84% . This FREE Version of the Scanner scans only EURUSD and GBPUSD. The full version of the scanner can be found here: Three Line Strike Scanner 30 Instruments This indicator scans for you up to 30 instruments (forex, indices or commodities) on up to 8 timeframes.
FREE
The Complex Chaos EA is an automated system that uses a pair of exponential moving averages to detect the market direction and opens trades on candle open. If the market moves against a trade it will at a set distance open another trade in the same direction to move the take profit of the group of open positions closer to the current price and make the group of trades winners overall once the price reverses. If a change in direction is detected then all trades are closed and it starts trading in
FREE
This indicator serves to depict the beginning of the trend (these are the green and red points of the graph). It is called simple because there are very few setup parameters, but it is essentially a set of rules - it is used a combination of WATR and a set of MAs. By combining their readings, it determines the direction of the trend.
How to use When there are green points on Main line of indicator, the trend direction is UP and you can BUY. When there are red points on Main line of indicator, t

The Prospector Scalper EA is a fully automated Expert Advisor that scalps during high volatility periods using a hybrid lot multiplication algorithm. The EA trades using market orders and hides its decision making from the broker. This EA will work on any pair but works best on EURUSD and USDJPY on the M5 timeframe. A VPS is advisable when trading this system. Check the comments for back test results and optimized settings. Please note: I have made the decision to give this EA away and many more
FREE

The Rapid Reaper EA is a fully automated hybrid averaging EA that trades in sequences of lot increase and multiplication on both sides of the book. The system trades using market orders with take profits set across trade groups. This EA will work on any pair but works best on GBPUSD and USDCAD on the M5 timeframe. A VPS is advisable when trading with this EA. Check the comments for back test results and optimized settings. Please note: I have made the decision to give this EA away and many more
FREE

This Expert Advisor trades flat breakouts. The EA plots a channel between important levels, or at a specified distance from the current price. As soon as the price start moving, the robot starts working. The recommended timeframe is H1 or above, currency pair - any. You can set the EA operation time in the settings. The EA is recommended for working during string market volatility or during news releases. This will allow you to avoid drawdown and will have a good effect on trading. Channel Power
The Expert Advisor algorithm determines on daily charts those candlestick patterns, which set the intraday trading direction. The trading EA determines how long the price is moving in overbought/oversold zones and starts working in the direction of the expected trend movement. Each position is accompanied with a tight stop loss and take profit. Only one active position can be open in the market. The EA was developed and tested using 99% quality quotes. The Expert Advisor has a built-in news filt

The indicator shows the upper, middle and lower price limits for a certain period of time. Also, two Moving Averages (MAs) are displayed.
Parameters
CTType : corridor basis. _Hour : hours, _Day : days, _Bars : bars CTPrice : price type, by bars. OpenClose : Open/Close prices, HighLow : High/Low prices CTShift : corridor shift CTNum : how much to consider for building a corridor, min 2 CTPeriodFast : Fast period, min 2 CTShiftFast : Fast MA shift CTMethodFast : Fast averaging method CTPeriodSlow

Indicator of tick volumes with the ability to monitor sudden and significant changes in the prices of bars relative to the specified coefficient - Change Factor. The color of the indicator's histogram characterizes the changes in volume of a bar relative to the previous session. By default, the indicator bars are colored in the following colors: Green - a slight increase in volume, not exceeding the Change Factor; Red - a slight decrease in volume, not exceeding the Change Factor; Purple - signi
Indicator of tick volumes with the ability to monitor sudden and significant changes in the prices of bars relative to the specified coefficient - Change Factor - to the average value of volumes for a certain period of time - Period Signal. The color of the indicator's histogram characterizes the changes in volume of a bar relative to the previous session and the signal line.
Indicator Inputs Period Signal - period of the signal line; Change Factor – volume change factor. By default, the indica

ForexAurum Fibonacci indicator is a useful tool for traders who are using Fibonacci combined with the ZigZag indicators. It uses the real-time calculation of the levels for all the timeframes and displays the results for you. In addition, you can setup RSI, ADX and Stochastic indicators to confirm entries.
How to use it Just drag and drop the indicator on an 1 minute chart of any symbol. Then you can switch to a higher timeframe at anytime after the initialization.
Recommendation Always drag a

Voles Indicator Operation Principles It is based on the standard indicators of the MetaTrader 4 terminal. It shows the market entry points.
How to trade When a bar is complete and an arrow is shown, place a BuyStop order at the High of the bar is the arrow is green, or a SellStop order at the Low of the bar if the arrow is red. StopLoss should be set at the level of the last downwards fractal below the entry point at a green arrow or at the level of the last upwards fractal above the entry poi

NN8D Volume is one of the indicators included to NN8D trading system ( N ikolsky's N esting D oll). NN8D Volume displays a trend direction sorting out the market noise and keeping trades even during main trend corrections. Buy checklist: Bulls on the current bar and preferably on the previous one. NN8D Volume line should go up moving away from Bulls points, showing a bullish trend and increase in volatility. Current bar - Buy (an open price is below a close one). Sell checklist: Bears on the cur

The indicator automatically calculates the levels of pivot points and draws the lines on the chart. The lines that are drawn: Pivot line, R1 line, R2 line, R3 line, S1 line, S2 line, S3 line. Below each line, the value for your level is displayed. The point of pivot is calculated using the traditional method. The colors of the lines and font are configurable, as is a font size of the text. The indicator can only be used in periods equal to or less than D1.
Parameters Font color - text color. Fo

The indicator helps you trade following the VSA (Volume Spread Analysis) and PRICE ACTION methods, as well as study these methods from a perspective. The indicator searches for VSA and PRICE ACTION patterns considering the current trend. It is possible to view the patterns of the higher timeframe on the current timeframe chart. The custom mode allows you to find your patterns based on VSA method. Also, there is a volume histogram that automatically configures the width and visual horizontal leve

This tool adds alerts to your Fibo Retracement and Fibo Expansion objects on the chart. It also features a handy menu to change Fibo settings easily and quickly! Note: This is a demo version operating only on USDCHF . The full version purchase link: https://www.mql5.com/en/market/product/6760
Features Alert for Fibo Retracement and Fibo Expansion levels. Sound, Mobile and Email alert. Up to 20 Fibo Levels. Continuous sound alert every few seconds till a user clicks on the chart to turn it OFF.
FREE

The tool is used to calculate the size of the position that can be opened with the previously assumed risk. The risk can be defined as: percentage value of the account (%), nominal value, expressed in the account currency. The size of position is determined by the distance of the planned SL (red line).
Input Parameters Lost_in_Money - if true, the value of the acceptable loss is determined by the parameter "Acceptable_loss", else acceptable loss is determined by the parameter "Acceptable_Risk_P

This indicator shows ratios between extremes on the chart. You can specify your own ratios (e.g. Fibonacci).
Parameters Most important Density - how much in details to search ratios in extremes. Bigger number means less details, smaller number means more details. Base unit is 1 bar on the chart. History - how far to go in history while searching. When you set -1, the indicator processes all bars from history. Base unit is 1 bar on the chart. Range - how far search ratios from given extreme. Bas
FREE

Blahtech Moving Average indicator is a multitimeframe version of the standard Moving Average indicator. It is also enhanced with customisable alerts, period breaks and other configuration options. The 50 day and 200 day moving averages are widely followed by investors and traders, with breaks above and below the MA lines considered to be signals of interest. Links [ Install | Update | Training | All Products ]
Feature Highlights Up to three timeframes Configurable calculation variabl
FREE

The Analytic Trade indicator is a complete trading system. It consists of 4 parts: The first part is the arrows showing the most optimal points for opening and closing orders. The up arrow is a buy signal, the down arrow is a sell one. The second part is the information panel in the upper right corner. The current price is shown in a larger font, above it are: the daily High, distance from the current price to the daily High, and the difference between the High and Low (in points). Below it are:

Reliable SMA reversal signals. No repainting. Simple settings. Suitable for binary options. Made for maximum traders' convenience. The indicator performs a complex analysis of a price movement relative to SMA and displays the array which is to be most probably followed by a price impulse and SMA reversal. Internal sorting mechanisms sort out definitely late, unreliable or inefficient entries.
Options
SMA_PERIOD - considered SMA period should be no less than 24, the default is 44 SMA_APPLIED - S

This is a scalping Expert Advisor. The EA strategy applies the range of price deviation from the average high/low values for a specified period. It has a minimum number of adjustable parameters. The EA applies stop loss, take profit, breakeven and trailing stop levels invisible for brokers. The robot is ideal for a trader as an addition to a manual strategy or in conjunction with another EA. The EA distinguishes its trades by a magic number. Only one market order at a time can be opened on a sin
Price action is among the most popular trading concepts. Candlestick patterns are essential tools for every price action trader. A candlestick pattern is a one or sometimes multi-bar price action pattern shown graphically on a candlestick chart that price action traders use to predict.
Input Parameters On Alert - true/false (displays a message in a separate window). Patterns Reverse - true/false (allow displaying the backward candle patterns). Max Bar - numbers of bars.
Parameters in chart Can

Scalper uses the model of a quantum set of algorithms and can work on any financial instruments. Due to the optimal number of parameters necessary for optimization, you can create unique trading strategies based on quantum models. Signals: https://www.mql5.com/en/signals/author/old_padre New sets are in the "Comments" section comments #504-509. Time settings #33 and 245. Key Advantages The EA does not use Martingale; All orders are opened with a strictly fixed Stop Loss;
The minimum starting d

Genio Scalp is an Expert Advisor that follows the trend. It uses some simple setting. This EA analyzes the trend using the Moving Average indicator on multiple timeframes, combined with mathematical functions. If the main trend on the market is "buy" and the trigger signal also recommends to "buy", then the EA will execute the "buy transaction". And vice versa. Furthermore, this EA can also use Autolot calculation. By default, as protection, the Stop Loss is set in a tight points. This EA is rec

ForexGumpUltra is a new and more advanced indicator of the ForexGump series. This indicator easily determines the price direction on any currency pair and any timeframe. The indicator draws its signals on the zero bar and does not redraw them (see the video). In the 34th second of the video it can be seen that this indicator uses new filters to determine the changes in price movement direction without delay, despite the market noise present at the moment (see the video on the 34th second). Once
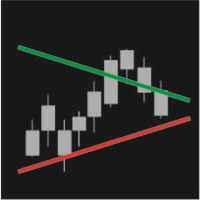
IntradayTrack displays daily support and resistance lines based on the average symbol volatility for a certain period. You can tilt the line to a certain angle both at the beginning and the end of a trading period.
Parameters Track period - the period of drawing lines (day, week, month) Avg price range – number of days the average volatility is considered for
Start value (Avg %) – distance between the lines at the beginning of a trading day in % of the average volatility for a selected period E

Trend-Scanner is an indicator for MetaTrader 4 that allows you to view 3 types of trends and signals on the charts. Trend-Scanner searches for 3 types of trading signals on all the underlying assets listed in the settings (and can be customized by the trader). If there are conditions that allow you to identify reliable trends then a pop-up alert will be displayed, a sound notification and a push notification will be sent. Trend-Scanner constantly searches for signals deriving from patterns devel

PriceChannel is designed for trend detection without the effect of accidental price leaps. It uses Price Series and a few moving averages for noise reduction. It works on multiple timeframes, even M1. To increase effectiveness, it is recommended to use 3 instances of PriceChannel with different parameters on one chart (see screenshots). You can use the following settings (for M1 charts): PriceChannel(10,2,30) Gold colour. PriceChannel(10,5,30) Blue colour. PriceChannel(21,8,13) Gray colour. Exa
The principle of this indicator is very simple: detecting the trend with Moving Average, then monitoring the return point of graph by using the crossing of Stochastic Oscillator and finally predicting BUY and SELL signal with arrows, alerts and notifications. The parameters are fixed and automatically calculated on each time frame. Example:
If you install indicator on EURUSD, timeframe M5: the indicator will detect the main trend with the Moving Average on this timeframe (for example the Moving

" MONALISA (acronym of MON itor A nd LIS t A ll) Stochastic" is an indicator based on the Stochastic Oscillator on all timeframes of any Currency Cross Pair. The indicator shows all Timeframes (from M1 to MN1) and colors in GREEN or RED that Timeframe that results in BUY or SELL based on the Stochastic Oscillator. This indicator is useful because it allows you to have a complete view of all Timeframes at the same time.
Features Easy flexible settings: Detection of the Stochastic signal for all
" MONALISA (acronym of MON itor A nd LIS t A ll) MACD" is an indicator based on the MACD Oscillator on all timeframes of any Currency Cross Pair. The indicator shows all Timeframes (from M1 to MN1) and colors in GREEN or RED that Timeframe that results in BUY or SELL based on the MACD Oscillator. This indicator is useful because it allows you to have a complete view of all Timeframes at the same time.
Features Easy flexible settings: Detection of the MACD signal for all timeframes No setting le

Value History is a very convenient indicator that returns the movement information both in terms of pips or points and in percentage terms. This indicator is useful for making historical analyzes and verifying previous movements in order to look for recurrences of volatility. Percentage values are returned based on the closing price of the previous movement while the point value can also be calculated on the minimum and maximum of the previous movement. Personally, I use this indicator to evalua
" MONALISA (acronym of MON itor A nd LIS t A ll) Bollinger Bands" is an indicator based on the Bollinger Bands indicator on all timeframes of any Currency Cross Pair. The indicator shows all Timeframes (from M1 to MN1) and colors in GREEN or RED that Timeframe that results in BUY or SELL based on the Bollinger Bands indicator. In addition, this indicator measures the " POWER " of the Trend that is highlighted on the middle line of the Bollinger Bands (SMA line) and in the table of Timeframes wit

Trends Hunter Expert Advisor is designed for medium-term trading. It is not a martingale and it does not depend on an account type (ECN, STP etc.) or spread level. This is a fully automated EA that features a custom algorithm for recognizing the price action and origination of a trend. If the EA identifies the beginning of a trend, one trade is opened. If a trend continues, the EA adds to the position. The number of addings is adjusted by the settings.
Options
Lots - fixed lot size; EMA1/EMA2 p

T Dog is a fully automatic trading robot which is the result of more than 10 years of the market study and programming expert advisors. You could run on all Forex, Indexes and Commodities. It uses a multiple indicators to determine the market entry with an advanced exit-algorithms. T Dog build-in News filter which able to stop trading during the news releases. It also possible to enable the trailing stop to secure your profits. No Grid No Martingale No Hedging No Arbitrage It is advised to use a

This is a multi-strategy EA. In the night scalping mode, the filters filter a trend-free range market environment and trades are placed in the opposite direction at the edges of the range. With an additional main trend filter in the trend-following mode, you can also trade pull-backs during longer trends on same houers or days. A detailed description of SpotLight EA can be found in the SpotLightBlog and a live monitoring here: If you have any question about the product, please contact me.

Are You Tired Of Getting Hunted By Spikes And Whipsaws?
Don't become a victim of the market's erratic moves.. Do Something About It!
Instantly make smarter decisions with Impulse Pro's precise balance of filters and accurate statistics.
Timing Is Everything In Trading
To learn more, please visit www.mql5.com/en/blogs/post/718212 Anticipate the next big move before it unfolds in 3 Simple Steps!
Advantages You Get
Early impulse detection algorithm.
Flexible combination to different trading s

Asia Balance is a multi-currency night trading robot, which only trades during the calm market period. The monitoring of the demo account is available now. Monitoring : www.mql5.com/en/signals/425078 (started on 2018.05.07) The Expert Advisor determines the range of the night corridor of the price movement and enters a trade when a signal emerges. A fixed StopLoss is used. TakeProfit is floating , it is set at the opposite border of the volatility channel. The EA has a built-in algorithm for ear
MetaTrader mağazası, geliştiricilerin alım-satım uygulamalarını satabilecekleri basit ve kullanışlı bir sitedir.
Ürününüzü yayınlamanıza yardımcı olacağız ve size Mağaza için ürününüzün açıklamasını nasıl hazırlayacağınızı anlatacağız. Mağazadaki tüm uygulamalar şifreleme korumalıdır ve yalnızca alıcının bilgisayarında çalıştırılabilir. İllegal kopyalama yapılamaz.
Alım-satım fırsatlarını kaçırıyorsunuz:
- Ücretsiz alım-satım uygulamaları
- İşlem kopyalama için 8.000'den fazla sinyal
- Finansal piyasaları keşfetmek için ekonomik haberler
Kayıt
Giriş yap
Gizlilik ve Veri Koruma Politikasını ve MQL5.com Kullanım Şartlarını kabul edersiniz
Hesabınız yoksa, lütfen kaydolun
MQL5.com web sitesine giriş yapmak için çerezlerin kullanımına izin vermelisiniz.
Lütfen tarayıcınızda gerekli ayarı etkinleştirin, aksi takdirde giriş yapamazsınız.