YouTube'dan Mağaza ile ilgili eğitici videoları izleyin
Bir alım-satım robotu veya gösterge nasıl satın alınır?
Uzman Danışmanınızı
sanal sunucuda çalıştırın
sanal sunucuda çalıştırın
Satın almadan önce göstergeyi/alım-satım robotunu test edin
Mağazada kazanç sağlamak ister misiniz?
Satış için bir ürün nasıl sunulur?
MetaTrader 4 için yeni Uzman Danışmanlar ve göstergeler - 244

An automated Expert Advisor that uses Price action techniques.
It is developed and tested repeatedly.
It is the only EA in the market that has passed 29 years of backtesting from 1990 to 2019.
Recommendation:
EURUSD
1hr timeframe
Use the settings found on the comment page.
You can play around with the settings like the deposits and lots. Do not change the take profit and stoploss settings.

Yeni Nesil Otomatik Arz ve Talep Bölgeleri. Her Grafikte Çalışan Yeni ve Yenilikçi Algoritma. Tüm Bölgeler Piyasanın Fiyat Hareketine Göre Dinamik Olarak Oluşturulmaktadır.
İKİ TÜR UYARI --> 1) FİYAT BİR BÖLGEYE ÇIKTIĞINDA 2) YENİ BİR BÖLGE OLUŞTURDUĞUNDA
Bir tane daha işe yaramaz gösterge almazsın. Kanıtlanmış Sonuçlarla eksiksiz bir Ticaret Stratejisi elde edersiniz.
Yeni özellikler:
Fiyat Arz/Talep Bölgesine ulaştığında uyarılar
Yeni bir Arz/Talep Bölgesi oluşturulduğunda

The Identify Trend indicator, using fairly simple but robust filtering methods (based on the moving median – algorithm XM ) and more complex algorithms (XC, XF, XS, four types of non-lagging moving averages SMAWL, EMAWL, SSMAWL, LWMAWL ) developed by the author , allows determined (1) the beginning of a true trend movement very precisely and, most importantly, with a small delay, and (2) identifying the flat. Such an indicator can be used for trading scalper strategies as well
FREE
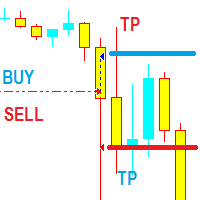
Robot, kilit fiyat seviyelerinde limit ve stop emirleri verir ve kar hedefine ulaşıldığında emirleri veya emir sepetini kapatır. İlk açılan emir ile kar hedefine ulaşılmazsa, birikim gücünü kullanır, biriktirir. kar hedefine ulaşılana kadar siparişler.
Kar Faktörü lot büyüklüğü kullanılarak hesaplanır, 0.01 lot için Kar Faktörü 1 olarak ayarlanırsa kar 1$, 0.1 lot için 10$, 1 lot için 100$ vb. Kar Faktörü ve Zarar Faktörü lot ile ilişkilidir. boy .
EA ayrıca, gece yarısında artan

This indicator Plots Open, High, Low and Close levels of previous month, on current month's lower time frames. These levels act as good support and resistance levels. Most of the time price oscillates within the levels. wait for price to reach these levels and act accordingly.
Pay special attention to confluence of levels. According to my observation if Close (White) level is in confluence with any other levels, High probability of break out or bounce back. Scroll back to previous months and ob
FREE

Exit Area Ultimate, grafikte günlük Ortalama Gerçek Aralık (ATR) ve Ortalama Günlük Oran (ADR) seviyelerini göstererek alım satım kararlarını geliştirmek için tasarlanmış teknik bir göstergedir. Bu seviyeleri anlayarak, tüccarlar bir varlığın gün boyunca ortalama hareketini kolayca değerlendirebilir. Bu çok yönlü gösterge, günlük tüccarlar için birden çok amaca hizmet eder, sipariş vermeye yardımcı olur, gün içi eğilimleri belirler, takip eden zarar durdurma seviyelerini belirler ve gü
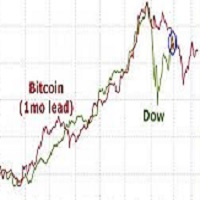
Correlation EA is a robot based on a strategy of correlation between two financial assets.
Two Assets are correlated when they follow the same directions in the medium and long term.
The robot takes two opposing orders of the same size in dollars on both assets and automatically closes the two orders after x dollars of profits defined by the users
Look for two assets that have a correlation of + 90% and a close average volatil.
Is not possible to bactest this strategy on metatrader 4 Tester
P
FREE
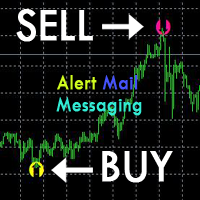
[ZhiBiZZD_MT4] The indicator is suitable for all cycles and is suitable for all market varieties.
[ZhiBiZZD_MT4] The downward arrow is the signal of (Sell).
[ZhiBiZZD_MT4] The upward arrow is the signal of (Buy).
[ZhiBiZZD_MT4] can be set in the parameters (Alert, Send mail, Send notification), set to (true) to send instant signals to the alarm window, email, instant messaging.
Parameter setting description:
[alert_NO_OFF]: This is the alarm switch, set to true, if the arrow appears, it wil
The indicator shows on the selected range tick volumes in the form of a horizontal histogram Highlights the maximum and most significant price levels near which correction and price reversals are most likely Allows you to conduct trend and counter trend trading using support and resistance levels It works on all timeframes, on any currency pairs, metals and cryptocurrency Can be used when working with binary options Distinctive features Shows the most significant levels of support and resistanc

Stochastic Candles Indicator It will convert the stochastic indicator from separate window to the chart window by drawing oversold-overbought coloring candles. Red is overbought and blue is oversold by default.And you can change the color later on the external indicator setting.This is Multi timeframe indicator that means it can show appearance result from another timeframe.E.g: If you set timeframe H1 then it will draw candles from Timeframe H1 whatever timeframe you attach on. It will be us

The Trade by levels indicator is designed to automatically determine the formation of a model for entering the market on the chart of the selected instrument.
Definitions: ⦁ BFl is the bar that formed the level. ⦁ BCL1 and BCL2 bars, confirming the level.
The graphical model: ⦁ levels high\low the bars BFL and BCL1 must match the accuracy to the point ⦁ there can be any number of bars between BFL and BCL1. ⦁ between BCL1 and BCL2 intermediate bars
FREE

NightSniper - полностью автоматический советник. Особенности -Советник торгует по нескольким валютным парам из одного графика -Советник использует оптимальные параметры для каждой валютной пары и не требует оптимизации -Советник использует минимальное количество входных параметров доступных для понимания -Советник не входит в сделки при завышенных спредах(Max_Spread=4 - не доступно для изменения, указано для 4-ех значных котировок, для 5-ти знака пересчитывается автоматически) -Советник всем

ENSAC is a fully automated Expert Advisor, built on a scalping strategy that involves closing a deal while achieving a small, but sufficient profitability indicator, which allows the user to minimize the leakage of funds from opening losing trades. The Expert Advisor is multi-functional and does not require a specific type of account for normal operation. The mechanism of the Expert Advisor is designed so that, before opening a transaction, instant implicit filtering is carried out thanks to the

This trend Advisor is based on Alexander elder's multi-timeframe strategy. Automatic Advisor "Elvis79" royally strict, reliable and chic. It is optimized for the USDZAR currency pair. With the author's settings is set to the timeframe H4. At the same time, the EA trades at the level of the daily timeframe, that is, it holds the trade for several days.
The EA uses a sophisticated trading system "Giant". His whole concept is directed against the risky and irresponsible policies. Before trading on
FREE

Определение текущей тенденции - одна из самых важных задач трейдера независимо от стиля торговли. Индикатор Speed Trend поможет с достаточно высокой вероятностью это сделать. В расчетах индикатора используется авторская методика. Speed Trend подходит для любой валютной пары, любого таймфрейма, и не меняет свои показания. Индикатор очень просто в настройке, что является хорошим преимуществом для исследований.
Параметры
Основные настройки ( Main Settings ): IndicatorPeriod - период для рас

A fully autonomous trading expert works on the principle of calculating counter divergences of averaged price values simultaneously on two timeframes. An additional filter for opening trading positions is the Bollinger Bands indicator.
Each position has a stop loss and take profit.
Used trailing stop.
For the full and stable operation of this trading expert, you must have a stable VPS.
Recommended trading tools - 5m: EURUSD, GBPUSD, USDJPY, USDCAD. Settings: Comment to orders - Comment to

As a result of our four-year research, we were able to make such a perfect robot. We weren't thinking about selling it, but we wanted everybody to take advantage of it. You will see the difference in quality between the experiment. This Robot was made for US30 only. We do not recommend that you use it in other currencies. Transactions are much more successful in the rising market.
Expert Configration : SymbolUS30 = Your CFD Symbol Name Period : H1 BB Stop Low : 2 BB Stop High : 4 BB Stop Per :
Порядок работы
В советнике использован блок анализа ценового движения аналогичный блоку советника T-Rex. Советник не открывает следующий ордер, пока не закроется предыдущий.
Советник не имеет блок модификации и не позволяет выставлять уровни TakeProfit и StopLoss, вместо этого выставляются уровни прибыли и убытка в денежном выражении. Это позволяет обойти минимальные уровни, установленные брокером.
Параметры Set_Lots – объем лота открываем ого ордера. CloseProfit – прибыль по позиции, при

There is the first expert enters a sale deal The second expert enters the purchase Each expert works on pending deals multiples With each expert closing his trades at a 10 point profit Better to watch the video before working the experiment. Parameters: OP_symbol_1 : Open positions BUY or open positions SELL. Lot1: Manual Lot Size. Auto_Lot: Set to true to automatically calculate optimal Lot Size based on risk preferences, set to false if you want to use manual lot size. Max_Risk: Max Risk as p
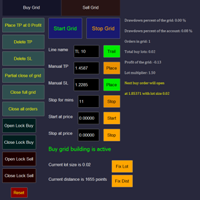
Overall Grid Assistant trading panel is a fully-featured tool for building grids of orders and semi-automatic management of them. The panel has flexible settings of lot multiplier and distance between orders and also a lot of functions protecting the deposit from big losses. The panel has separate independent tabs for grids of buy and sell orders.
Grids build for losing trades opened manually or by another EA which can be chosen by magic number, comment or ticket.
There is a possibility to decre

The work of the expert is based on identifying zones of price consolidation in the presence of multiple multidirectional divergences. As the price leaves the narrow price range, the adviser starts working. The SAR indicator acts as an additional filter for making decisions about the direction of the transaction.
It is recommended to use the adviser with the following trading tools - 5m: EURUSD, GBPUSD, USDCAD. Standard settings are recommended for EURUSD and USDCAD . For GBPUSD , set the TRUE -
Follow live performance: Aggressive settings: https://www.mql5.com/en/signals/564559 Revolutionary hybrid grid: more than 13 years backtest with starting balance as low as 100 dollars - VERY IMPORTANT TO BACKTEST DEMO: please read backtest instruction or ask via PM. Description: The HIBgRID is a Hybrid Grid EA based on the mean-reverting characteristics of the pair GBP/CAD during low volatility and low volume period. The EA utilizes the mathematical principles of a Ornstein–Uhlenbeck process t

vIntelligent algorithm of the indicator TrendWX with accuracy generates input signals and output levels. Strategy for trading on trend, filtering and all the necessary functions built into one tool! The principle of the indicator is to automatically determine the current state of the market, analyze historical data, based on historical data, and display to the trader instructions for further actions. The system itself shows in the form of arrows when to buy and when to sell.

The automatic trading system ReactorScalpig is made in order to completely exclude the trader from routine transactions to make transactions. Advisor independently monitors the market.
With each arrival of a new quote, the trading expert analyzes the market situation for compliance with one of the embedded trading systems.
If the adviser's algorithm determines the probability of making a profit on a transaction of more than 80%, the adviser opens a position.
Each position has a take profit an

This tool works on MT4. The connection to the IQ option box program is established. With this software, IQ Optiona opens orders in selected time periods. The IQ option box program is required. First, the connection to the IQ option box is established. Then you can trade by sending a trading order by adding MT4.
IQ O BOX Free Connection Software Download Link. https://drive.google.com/open?id=1xW6ynCwtdbGL4_GFzXU7penZAvTwYaWP
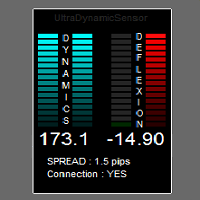
The purpose of the indicator is to measure the dynamics of price movement, capturing sudden acceleration,
and examination of the direction in which the price is moving.
Indicator due to its nature, is dedicated to TimeFrame M1, but it can be freely used on higher TF'ach.
Calculation and display will be identical to the M1.
Indicator all calculations done on ticks, ie single price movements.
Are not taken into account the conditions candle (the color of the candle, the candle shape, values : ope

Automatic intraday trading Demo it by using provided optimized (.set) files for testing in Strategy Tester! Set it and forget it type of operation No high-risk martingale, averaging, grid or hedge strategies Easy signal to open / opposite signal to close and a new signal and so on Easy signal + opposite signal for trade open/close strategy (like you would do manually but automated) Hybrid strategy ok meaning open by EA, close manually (set TP=0) Works on Demo and Real money accounts (screens

THIS ADVISOR REALLY WORKS !!! I present to you my own adviser, designed to work on the instrument TSLA (shares of companie Tesla). The work of the adviser is based on hedging positions. Purely mathematical model of averaging positions. Advisor can be configured to work on buy or sell, as well as buy and sell at the same time. This is a multi-currency Expert Advisor, so it can be used simultaneously on a different stocks at the same time, and the work on each stocks can be set separately. It is p

Equili brium 4 cent
Equilibrium4cent was designed to run on cent accounts. If you have at least 10, 000 $ you can run in to a standard account I run this EA in cent account or micro. (840% in 3 years better that Bank :) just see the video ). Software designed on the basis of mass theory. My favorite pairs to run it is EURCAD, EURAUD and EURGBP. You can run it on other pairs, like EURUSD, GBPUSD and etc... For Grid trading you need Money! The ideia is to make more Money that in the Bank. Risk

NeveScalping is a Scalping Trading and Intraday Trading. NeverScalping uses predictions and predictions using artificial intelligence algorithms. In this way, the professional higher law has lost its luck.
EURUSD does a practical, historically important job. Download the demo yourself. My tests were 90 days of accuracy, actual spread, extra slip and high visibility date of actual ticks.
The recommendations are as follows
optimized for the EUR / USD's D1 chart. There are no other compone
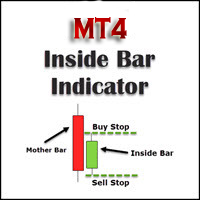
This inside bar indicator MT4 is suitable if you are doing inside bar trading. So what this MT4 inside bar indicator does is identifies inside bars for you as they form on your charts. Inside bar is a famous trading pattern in which the bar carry higher low and lower high compared with the previous bar, also known as mother bar. With, a lesser time frame like the 1 hour chart, daily inside bar chart will sometimes appears to be similar to a triangle pattern.
Inputs AlertOn - enable alerts Emai
FREE

The latest Binary Options arrow indicator in the Garuda Signals product line. Binary options signal based on multiple time frame cross over analysis. Gets confirmation from the most consistent signals known to man; Ichimoku, SMA, Bollinger Bands; and also uses the 1 Hour time frame as trend confirmation , so you don't have to open up multiple chart and waste time. - Can be used for all time frames up to 1 hour, but is most POWERFUL for 1 and 5 min options. - Place your Call/PUT based on the Arro
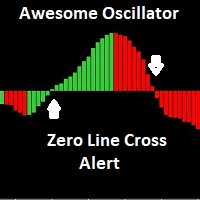
The Awesome Oscillator (AO) is an indicator used to measure market momentum. AO calculates the difference between a 34 Period and 5 Period Simple Moving Average. The Simple Moving Averages that are used are not calculated using closing price but rather each bar's midpoints. This indicator has email and pushup "mobile" features Alert, for any suggestions, please don't hesitate, thanks
FREE
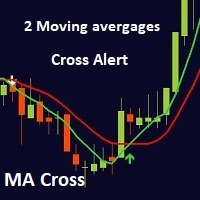
This indicator is a full 2 moving averages cross Alert ( email and push notification "mobile"), 2 MA with full control of MA method and applied price for each moving average "slow and fast", -simple, exponential, smoothed, linear weighted. -close, open, high, low, median price, typical price, weighted price. you can modify periods as well for both MA. For any suggestions don't hesitate, thanks

Signals and Alerts for Accelerator/Decelerator indicator based on these MQL5 posts: Accelerator Oscillator and Signals of the Indicator Accelerator Oscillator . Note : this tool is based on the code of Accelerator indicator developed by MetaQuotes Software Corp.
Features The signals are triggered at closing of last bar/opening of a new bar; Any kind of alerts can be enabled: Dialog Box, Email message, SMS notifications for smartphones and tablets, and Sound alerts; Customizable arrows. By d
FREE
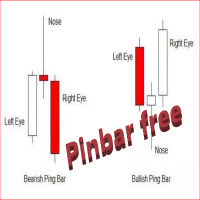
The Free Pin Bar MT4 indicator identifies Pin Bars It will even give you sound or email alerts if want them. If you download it and like it please leave a review! It would be wonderful
Pin Bars are purely based on price action as reflected by the candle formations created by Forex price movements. input Parameters are maximum allowed body/length ratio for the Nose bar. Nose body should be position in top (bottom for bearish pattern) part of the Nose bar. tells the indicator that the Left Ey
FREE

Attention : The TigerGBP Power EA can not be tested in the MT4 strategy tester !!! Trend is the KEY !
TigerGBPPower EA robot is a fully automated robot for Forex trade. TigerGBPPower EA is a combination numerous special trend strategy ,that It provides the possibility the best entries of the trade . TigerGBPPower EA robot is designed for medium and long term trading ,the robot will help you deal with and manage emotions ,and you don't need worry about news release any more !! The trend is

ATTENTION : The Tiger Eur Power EA can not be tested in the MT4 strategy tester !!!
TigerEurPower EA robot is a fully automated robot for Forex trade. TigerEurPower EA is a combination numerous special trend strategy ,that It provides the possibility the best entries of the trade . TigerEurPower EA robot is designed for medium and long term trading ,the robot will help you deal with and manage emotions ,and you don't need worry about news release any more !! The trend is the key ,the

The assistant sets Stop Loss and Take Profit for all open positions. Settings for the symbol, position type, Stop Loss and Take Profit are set in an external file.
The ability to express one's thoughts is no less important than the thoughts themselves, for most people have a hearing to be saddened, and only a few have a mind that can judge what has been said.
If presidents cannot do this with their wives, they do so with their countries.

MULTI CURRENCY SCALPING SYSTEM - DEFAULT FOR EURCHF
YOU CAN OPTIMIZE THIS EA WITH EVERY SINGLE PAIR - REMEMBER ABOUT CHOOSING GOOD WORK HOURS FOR EACH PAIR !!!
HappyProgress is a fully automatic Expert Advisor. This expert advisor is based on channel reverse price. Robot is trading after closing EUR session and before closing USD session. The Robot was tested and optimized from 2004 to Today with 100% data from ICMARKETS MT5

There are a lot of support tools in the Forex trading market, such as ea - robot., to help the transaction become automated and can be traded 24 hours a day, and there are also lots of points. The quote is called an "indicator", such as: sar parabolic, cci, macd., bollinger band ... combining all the junk issues will give a "signal" and we call it "trading signal". But,null, and perhaps many market participants have not defined what the trend is, and what is the wave, to have more effective "str

KT Asian Breakout carefully analyzes the range-bound market during the Asian session and then fires a long or short trade after doing some preassessment based on its inbuilt technical analysis module.
The executed orders are closed within a day before the completion of the next day session. The inbuilt technical analysis module checks for the session range and compares it with the last 20 days price movement. If it finds any erratic price movement within the session, the orders are not executed

Daily Movement( Called Power) is effects to morning time of Japan Markets , Using this effects with Intelligence Averaging system ,This EA " Power Scalping " is made. M15 EURUSD ,EURCHF,USDCHF Recommended. For News Filter ,Please add at MT4 Tools/Options/ExpertAdvisors URL: http://ec.forexprostools.com/
Parameters If you want to use JPY accounts, Please multiplied by 110 to Amount for Initial Lots like 150*110= 16500.

适用于低点差平台(10点以内)或者ECN平台,短线交易EURUSD使用周期为:1M和5M。参数默认。 如果点差过高可能会产生亏损。标准账户测试请把点差改为10以后回测,请仔细阅读后测试
MinLots = 0.01;------最小手数 MaxLots = 100.0;-----最大手数 Risk = 50.0; -----最大风险 FixedLots = 0.1;------固定手数 UseMM = TRUE;-------是否启用按资金控制手数,请选 用TRUE
StartHour = 0;----------开始时间,小时 StartMinute = 0;--------开始时间,分钟 EndHour = 23;-----------结束时间,小时 EndMinute = 59;---------结束时间,分钟
I speak in Hungarian. Magyarul beszélek benne. Első felvétel. https://www.youtube.com/watch?v=h7UbTWiM-Lw Második felvétel. https://www.youtube.com/watch?v=y54q4Rasf2A&t=1s Harmadik felvétel. https://www.youtube.com/watch?v=13zYjsoe6ZQ Negyedik felvétel. https://www.youtube.com/watch?v=NGiB1AnxxfU Nice Day Signalos! If the Muving Average closes the candle over the candle. Buy takes. If the Muving Average closes the candle under the candle. Sell takes. MA trend. It can be set for him. Positive MA
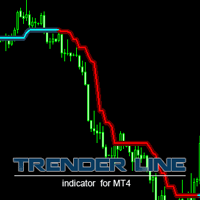
This is a trend-tracking indicator that determines the change in trend through changes in color. It can capture the big trend market and assist trend traders to enter and hold positions. A small rebound in the market will be filtered until the end of the trend. In the turbulent market, the horizontal line in the indicator can also be used as a support or pressure reference. More EA&Indicators click here https://www.mql5.com/en/users/chenshaofei/seller parameter Period - indicator period (large s

What is Double Top and Bottom Double top and bottom patterns are chart patterns that occur when the underlying investment moves in a similar pattern to the letter "W" (double bottom) or "M" (double top). Double top and bottom analysis is used in technical analysis to explain movements in a security or other investment, and can be used as part of a trading strategy to exploit recurring patterns. You can find MT5 version hier
Indicator shows you 2 Level target and stop loss level. Stoploss level

Day By Day
Требования к использованию советника: Для работы даного советника никакие требования не предусмотрены! Советник представляет собой систему, которая работает по сигналам индикатора RSI. Работает советник по времени терминала с 10:00 по 10:20, это значит что в это время он пытается войти в рынок, если по истечении этого времени войти не удается - ждет следующего дня. Рекомендуемая валюта: EURUSD, USDJPY;
Таймфрейм : H1; Мониторинг: https://www.mql5.com/ru/signals/557506 Оптимальные на

Robot experto diseñado para valorar las tendencias del mercado especialmente y apropiado para operar sobre el índice Dow Jones. Realiza operaciones de forma automática siguiendo la tendencia del mercado en las últimas horas. Adecuado para todo tipo de usuarios interesados en un robot sencillo de gestionar, muy intuitivo y apto para personas no expertas.
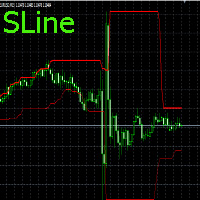
Входные параметры отсутствуют.По индикатору просто определять направление движения цены.Если линии сходятся,то используем ордера на пробой,если расходятся используем SELL,BUY,SELLLIMIT,BUYLIMIT.Работает на любых периодах.С любыми парами.Для нахождения минимального и максимального расстояния между линиями,нужно использовать инструмент"перекрестие".Для пары EURUSD на периоде М15,можно применять значения :для схождения <80 п.п.,а максимальное >500-800 п.п. Удачи в торговле!!! There are no input

Представляю Вашему вниманию советник Solaris, который торгует по принципу выставления разнонаправленых отложеных ордеров. Подробную информацию о системе торговли Вы можете увидеть на скриншоте ниже (скриншот 1).
Рекомендации: Для данного советника не предусмотрено никаких особых рекомендаций, единственное, как и для большинства советников, желательно использовать инструменты с наименьшим спредом! Параметры работы советника можно использовать по умолчанию. Время работы выбрано период наибольшей
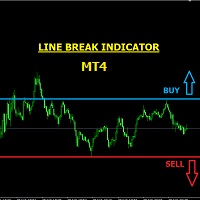
LINE BREAK INDICATOR This is a semi-automatic indicator that shows buy and sell arrows when your trendline (or horizontal line) is broken. You must first draw your lines, it will alert you of breaks through email, pop-ups, etc. It is important that you use just two main lines to avoid confusion, because the indicator signals BUY when the upper trendline or upper horizontal line is broken, and it signals SELL when the lower trendline or lower horizontal line is broken. It can be used for any curr

DAY BREAK INDICATOR
NB: THIS INDICATOR SHOWS MUCH DETAILS AND CORRECT SIGNALS ONLY ON THE CURRENT DAY'S CHART. PAST CHARTS AND STRATEGY TESTER DOESN'T SHOW MUCH POTENTIAL. It is an indicator for the current day's market purposely. This is an arbitrary Asian support and resistance breakout indicator for the current day only. Signals are no more valid for the next day ONLY FOR SCALPING AND INTRADAY TRADING. It signals in the direction of only the intraday trend. It should never be used for swing

The Expert Advisor opens trades based on the Bollinger Bands signals and RSI. But it's not simple. The EA has been developed and optimized for
Currency: USD/JPY Timeframe: M15 Indicator parameters Sell Entry Bands - Default value is 2.1. Sell Exit Bands - Default value is 2.3. Buy Entry Bands - Default value is 2.3. Buy Exit Bands - Default value is 2.9.
RSI Sell Exit Point - Default value is 10.
RSI only Sell Exit Point - Default value is 70.
RSI only Buy Exit point - Default value is 10.
Se
Profit consistently from the wavy nature of the market Grid trading is an efficient mechanical trading strategy which has no reliance on direction, profits from volatility and uses the intrinsic wavy nature of the market. It uses fixed price levels to enter and exit trades in one or both directions. Such trades, generally spaced at 20-200 pip intervals, create a trading grid. [ User Guide | Installation Guide | Update Guide | Troubleshooting | FAQ | All Products ]
Advantages
Easy to set up a

A simple risk management tool that closes all open orders if equity drops by a specified percentage. This tool is useful if you are running multiple EAs and multiple charts and pairs in order to control your risk. All orders will close accordingly. Once it hits specified percentage drawdown the closing of all orders cannot be stopped. The EA will reset once all orders are closed, until account equity drops again relative to account balance. Use at your own risk. This is only for MT4. There is on
FREE

Emtia Kanalı Endeksi (CCI) göstergesinin çok para birimi ve çok zaman çerçeveli modifikasyonu. Parametrelerde istediğiniz para birimini ve zaman dilimlerini belirtebilirsiniz. Ayrıca panel aşırı alım ve aşırı satım seviyelerini geçerken bildirim gönderebilir. Noktalı bir hücreye tıkladığınızda bu sembol ve nokta açılacaktır. Bu MTF Tarayıcıdır.
Kontrol panelini grafikten gizlemenin anahtarı varsayılan olarak "D"dir.
Parametreler CCI Period — ortalama dönem. CCI Applied price — fiyat türü. C
Fx Technical Analysis Sharing System, Experts make technical analysis and you can see the analysis. Analyses are updated during the day. One-click analysis with MetaTrader is displayed on the screen. If there are pending orders for these analyses, you will open the transaction with a single click. It is quite easy and easy to use. Related analysis , period and information is saved as template to your computer. You can then download and view it from the files folder. It is quite educational and a
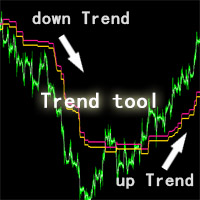
This ZhiBiQuShi tool is suitable for all varieties and is suitable for more than 5 minutes. It is a good tool for judging trends!
The price is a downward trend below the two lines, and the price is an upward trend above the two lines.
DESCRIPTION OF SETTINGS till_breakeven_rate : Determines how closely the channel will follow the price till the trade breaks even. RECOMMEND 1 space1 : Determines the width of the channel from the beginning of a trade till profi
FREE
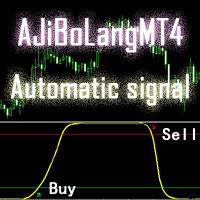
This AJiBoLang indicator is suitable for all cycles of the signal, very suitable for short-term signals
Just look at the arrows on the chart and make a single order. The green arrow is the Buy single and the red arrow is the Sell single.
After making the Buy order, if the yellow line goes up to the upper level and travels a certain distance, then you can sell the Buy order.
After making the Sell single, if the yellow line goes to the lower level and travels a certain distance, then the Sell o

This is a unique MACD indicator that is more accurate and easy to use than traditional MACD. It is suitable for any chart cycle and is suitable for any market variety.
The red column is the (Buy) band signal, and the blue column is the (Sell) band signal.
The yellow and green lines are trend lines, and the two lines never cross.
Buy: In the blue column, look at the green line up through the middle 0 axis.
Sell: In the red column, look at the yellow line down the middle 0 axis.
The MACD's de

Indicator for determining adjustments and price reversals It gives signals for inputs and shows the general direction of the price movement. Allows you to conduct trend and counter trend trading It works on all timeframes, on any currency pairs, metals and cryptocurrency Can be used when working with binary options Distinctive features Does not redraw; Thanks to simple settings, you can quickly adapt to any trading instrument; It works on all timeframes and on all symbols; Suitable for trading c
*Non-Repainting Indicator Message Me Immediately After Purchase For VIP Installation Help and Free Strategy Bruce's Price Predictor is an indicator that shows precise price reversals. A great arsenal to add to any chart. Bruce's Price Predictor points price reversals with high degree of accuracy and it is great for scalping on the 1min time frame, Or swing trading on the 1hr time frame. Buy and sell arrows are shown on the chart as for entry signals. They do not repaint but confirmation ent

S ignal : https://www.mql5.com/zh/signals/506069 Get your IC Markets Rebeat Discount Account: Click here . Through this link,you will get 3$/Lot.If you apply for it yourself,it is 3.5$/Lot. Are you ready? Do you ever see an EA who cannot stop gaining? Are you boring to find a good EA? Now I offer an full automatic EA,just install it in seconds,money will keep coming...
-------------------------------------------------------------------------------------------------------------------
A self-learning advisor can adjust to changing market algorithms with minimal latency.
With built-in analytical systems, the expert monitors the effectiveness of trading decisions.
In case of decreasing productivity of work, the adviser produces a new self-study based on the new market phase. Recommended trading tools - 5m: EURUSD, GBPUSD, EURJPY, USDCAD, USDJPY. Settings:
Comment to orders - Comment on trading positions; MaxRisk - Risk level for the calculation of the trading lot; Lot will be

Mystic Arrow - уникальный авторский индикатор, отображающий сигналы в направлении основной тенденции, и против нее. Благодаря разнообразию настроек и фильтров индикатор можно настроить под свой стиль торговли. Mystic Arrow подходит для любого таймфрейма, валютной пары. Сигналы индикатора не пропадают ни при каких условиях. Отличительной особенностью является возможность настроить сигналы индикатора отдельно для тенденции и против нее. Имеет в качестве отключаемого фильтра показания ценового кан

ATTENTION : The Tiger Security EA can not be tested in the MT4 strategy tester !!!
TigerSecurity EA robot is a fully automated robot for Forex trade. TigerSecurity EA is a combination numerous special trend strategy ,that It provides the possibility the best entries of the trade . TigerSecurity EA robot is designed for medium and long term trading ,the robot will help you deal with and manage emotions ,and you don't need worry about news release any more !! The trend is the key ,the Tige
The RSI S-RoC indicator differs from the standard RSI in that it takes into account the price rate of change when calculating values. When the price moves in a trend, the indicator produces good entry signals oncethe price touches its levels. The level values can be configured in the indicator settings. They can also be modified and adjusted directly in the indicator window. You can also set on a chart signal lines. Once they are crossed, the indicator will produce a sound alert or play a user
FREE

The EA has a very simple setup , but effective . Uses only pending orders , which improves the accuracy of position entry . The principle of operation is to capture the slightest movement of the market during a trend , while ignoring the flat periods . Fully automated program for trading in the FOREX market. At the core of the algorithm is simply following the price movement ( trend ). Profit and limit potential losses by using placing Take Profit and Stop Loss . The function "Trailing Stop" all
The Expert Advisor uses 3 different trading strategies at the same time to determine market entry points. It is recommended to install the Expert Advisor simultaneously on the recommended trading instruments (currency pairs) with the default settings. Due to the simultaneous operation, the drawdown of various trading instruments is leveled by the profit of others, which ensures a smooth growth of the deposit. Recommended trading tools - 15m: GBPUSD, AUDUSD, USDCAD, EURUSD, EURGBP, EURCHF, EURJPY
MetaTrader mağazası, geçmiş verilerini kullanarak test ve optimizasyon için alım-satım robotunun ücretsiz demosunu indirebileceğiniz tek mağazadır.
Uygulamaya genel bakışı ve diğer müşterilerin incelemelerini okuyun, doğrudan terminalinize indirin ve satın almadan önce alım-satım robotunu test edin. Yalnızca MetaTrader mağazasında bir uygulamayı tamamen ücretsiz olarak test edebilirsiniz.
Alım-satım fırsatlarını kaçırıyorsunuz:
- Ücretsiz alım-satım uygulamaları
- İşlem kopyalama için 8.000'den fazla sinyal
- Finansal piyasaları keşfetmek için ekonomik haberler
Kayıt
Giriş yap
Gizlilik ve Veri Koruma Politikasını ve MQL5.com Kullanım Şartlarını kabul edersiniz
Hesabınız yoksa, lütfen kaydolun
MQL5.com web sitesine giriş yapmak için çerezlerin kullanımına izin vermelisiniz.
Lütfen tarayıcınızda gerekli ayarı etkinleştirin, aksi takdirde giriş yapamazsınız.