YouTube'dan Mağaza ile ilgili eğitici videoları izleyin
Bir ticaret robotu veya gösterge nasıl satın alınır?
Uzman Danışmanınızı
sanal sunucuda çalıştırın
sanal sunucuda çalıştırın
Satın almadan önce göstergeyi/ticaret robotunu test edin
Mağazada kazanç sağlamak ister misiniz?
Satış için bir ürün nasıl sunulur?
MetaTrader 4 için ücretsiz Uzman Danışmanlar ve göstergeler - 7

The trading strategy bases on MACD signal and confluence of trends on multiple time frames. It supports martingale, smart trade and many options so that you can setup their own trading strategy from the basic one. Look for new idea, improve trading performance by yourself without limitation.
Outstanding Features Martingale trading : turn on/off martingale strategy. When you find out a parameter set which has a small value of maximum continuous loss, you can consider to turn on martingale mode
FREE

About Waddah Multimeter (free): This product is based on the WAExplosion Indicator. It helps identify explosive market trends and potential trading opportunities. Waddah Multi-meter (Multi-timeframe) Check out the detailed product post here for scanner and multimeter both: https://www.mql5.com/en/blogs/post/758020
Please note that scanner is paid and multimeter is free.
Features: Waddah Trend Direction Trend Strength (above/below explosion line or deadzone) Trend Explosion Alert Alignment al
FREE

Rsi indicator and Stochastic Combined into one indicator , the Supreme StochRsi doesnt repaint / Back-paint / delay. can be used as overbought oversold strategy , or trend following on 50 level cross. if you like this indicator please check my Supreme Trendhisto: here , and my Supreme Diamond indicator : here ========================================================================= Parameters : Stochastic K and D value , Stochastic period Rsi Period Rsi price ====================================
FREE

The Expert Advisor of the Forex Fraus is designed for scalping the EURUSD (for five-digit quotes) and adapted for the accounts with fast execution of orders.
Operation Principle When a signal is received, the orders are opened by accumulation using tick data; The robot does not apply indicators and other analytical systems. The signals are calculated using H1 and M1 chart processing results; The EA has three operation modes; Normal : uses the filter for trend trading; Turbo : uses the filter t
FREE

Full automatic trading platform incorporating the best settings of BinaryMiner and Root-Diamond
Built-in configurations.
1. Automatic calculation of abyom from the deposit.
2.Opening only one position from the settlement level in Long or Short
3.Security for going to No Loss in cases of Contra trend
4 binary indicators filter the market and identify a nearby wave in the market movement.
All incorporating configurations guarantee long-term income
// --------- Configurable parameter
FREE

ON Trade Marubozu Mum Modeli Göstergesi Marubozu mum modeli, piyasa duyarlılığını ve potansiyel trend dönüşlerini değerli bilgilerle sunabilen güçlü ve açık bir mum modelidir. Bu model, uçlarından birinde çok küçük veya hiç gölge (fitil) bulunmayan ve baskın trendin yönünde uzanan uzun bir gövdeye sahip bir mumla karakterizedir. Bu model, alıcılar ve satıcılar arasında güçlü bir dengesizliği temsil eder ve piyasada momentumun güçlü bir şekilde tek taraflı olduğunu gösterir. Özellikler ve Faydala
FREE

The indicator draws lines the the price highs and lows. Break through the high or low usually indicates trend change (or continuation). Once the price moves through a line, and the candlestick closes, the indicator draws an appropriate arrow (also, you can enable alerts). A deal should be conducted in the breakthrough direction immediately or after a slight rollback. It is best to trade following the trend on a larger timeframe. This indicator is easy to use, but nevertheless, there are many tra
FREE

Expert Advisor (EA), MA Following
commonly known as a trading bot. It implements a grid trading strategy with the following characteristics: Moving Average and Standard Deviation : The EA uses a Moving Average (MA) as the core of its trading strategy, combined with Standard Deviation (SD) for trade entry and exit decisions. There are four types of MAs available: Simple, Exponential, Smoothed, and Linear Weighted. Users can select the MA type and set its period, as well as the period and fact
FREE

Sniper danışmanı, asıl görevi «Kasa» kuralını kullanarak tüccarın stratejisine ilişkin işlemleri açmanın yanı sıra işe yaramayan «Kasa» kuralıyla bağlantılı olarak kullanılan hızaşırtma pozisyonunu kullanan yarı otomatik bir uzmandır.
Uzman, piyasayı keskin nişancı stratejisine göre analiz etmediğini, ancak para yönetimine popüler bir yaklaşımın uygulanması için sıradan bir asistan olduğunu belirtmek gerekir.
Ayrıca, danışmanın mümkün olan her şeyle ve herhangi bir zaman çerçevesinde kesinl
FREE

Ea Stepper is a fully automated expert advisor for the mt4 platform,which can be used for short/medium/and long term strategies. The strategy is to find periods of very low volatility to place entries in the direction of daily trend. If trend direction changes and an open trade is in loss, a scaled lot trade will be opened in the opposite direction. It includes money management features such as an auto lot feature and stop loss by equity percentage to control risk.
SUGGESTED CONDITIONS:
ECN
FREE

Modified oscillator MACD. A classic indicator that combines a trend indicator with an oscillator to detect entry points. Has a multi-timeframe panel and 3 types of notifications
Benefits:
Works on all instruments and timeseries Trend indicator with oscillator for inputs Multi-period panel on all timeframes Pluggable arrows when signals appear Three types of notifications: push, email, alert
MT5 version -> HERE / Our news -> HERE
How the indicator works:
AW Classic MACD - Indicato
FREE

The Currency Strength Lines (CSL) indicator is a very useful tool for both beginners and experienced traders. It is able to calculate the strength of single currencies and show them on a chart, so that you can see the trend and spot trading opportunities.
How does it work? The CSL Indicator will run calculations on all the 28 pairs, resulting in the overall strength across the market of individual currencies at any given moment. You can use this data to spot currencies that are strong, getting
FREE

Fikir Tüccarı (EURUSD M30)
Idea Trader tam otomatik, profesyonel bir ticaret robotudur. Döviz piyasası EURUSD M30 için özel olarak tasarlanmıştır.
Bu EA'nın parametreleri yapılandırması gerekmez. EURUSD M30 üzerinde çalışmaya hazır. Sadece lot seçimine karar vermeniz gerekiyor.
Bu EA, trendi tespit eden, piyasa gürültüsünü filtreleyen akıllı bir algoritmaya sahiptir. Uzman, trend yönünde emirler oluşturur.
Girdi ve çıktı emirleri, herhangi bir MT4 platformunda bulunabilen dört gösterg
FREE

VR Ticks, ölçeklendirmeye dayalı stratejiler için özel bir göstergedir. Bu gösterge sayesinde tüccar, onay grafiğini doğrudan finansal aracın ana grafiğinde görebilir. Onay grafiği, piyasaya bir pozisyon girmenize veya piyasadaki bir pozisyonu mümkün olduğunca doğru bir şekilde kapatmanıza olanak tanır. VR Ticks, kene verilerini yöne bağlı olarak renk değiştiren çizgiler biçiminde çizer; bu, kenelerle ilgili durumu görsel olarak anlamanıza ve değerlendirmenize olanak tanır. Onay grafiklerinin av
FREE

Advantages: Based on classic indicators - ATR, Moving Average Determines the trend / flat in the market by coloring the histogram with the appropriate color Arrows indicate confirmed signals It is an excellent filter for channel strategies (by extremes)
Settings:
Наименование Описание настройки Period of Flat Detector Number of bars / candles for analysis Period of EMA Period of EMA (Moving Average) Period of ATR Period of ATR (current timeframe) Coefficient of deviation Coefficient of devia
FREE
The IT Moving RSI EA is a cutting-edge tool designed to empower traders with deep insights into market trends and price movements. This expert advisor is a powerful ally for both novice and experienced traders, offering the ability to make well-informed decisions by harnessing the combined power of moving averages and the Relative Strength Index (RSI). Whether you are starting your trading journey or are a seasoned trader, this EA is a must-have addition to your trading arsenal. Join our telegr
FREE

Intraday Setup Indicator uses Bollinger Bands as a main indicator to find a good setup filtered with candle stick pattern such as engulfing and pin bar. This is great tool for those who trade with Bollinger bands for entry or use it as a filter for trend. It is suggested to use a higher time frame when using this tool. There are many input setting for user to conveniently find a good probability setup.
FREE

Principles of construction of the indicator. The Absolute Bands (AB) indicator is reminiscent of the Bollinger Bands indicator with its appearance and functions, but only more effective for trading due to the significantly smaller number of false signals issued to them. This effectiveness of the Absolute Bands indicator is due to its robust nature. In the Bollinger Bands indicator, on both sides of the moving average - Ma, there are lines spaced from Ma by the standa
FREE
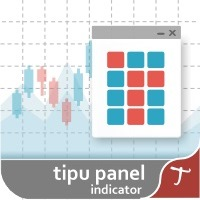
Tipu Panel series is set of innovative indicators created to consolidate indicators in form of a panel. As a trader, indicators can easily create a cluster on the chart and distract you from the bigger picture. It can also be overwhelming and visually exhausting. Tipu Panel simplifies this by displaying each indicator in a beautifully boxed panel. You can customize the panel to display indicator signals for multiple time frames and also to quickly switch time frames. There are two types of indic
FREE

Robot CFO1.2EA is an innovative financial management system designed to optimize portfolio performance through the integration of contrarian, hedging, and grid techniques. Leveraging cutting-edge artificial intelligence algorithms, it provides sophisticated risk management and investment strategies tailored to meet the unique needs of your financial portfolio.
Robot CFO1.2EA employs a contrarian investment approach, capitalizing on market inefficiencies and deviations from the norm. It identif
FREE
Easily track and trade with the trend using this indicator. Uses a circle and line to indicate the trend direction. Excellent for channels. Features alert function.
Parameter TrendPeriod can be changed to your preference. How to use: Simply attach to any chart. Blue circle plus blue line cross below price = Buy. Red circle plus red line cross above price = Sell. Best results when taking higher time frames into consideration before entering a trade. (Hint: Wait for the radar/circle to appear on
FREE

Ska ZigZag Line indicator determines the overbought and oversold regions within a trend. The indicator determines the overbought region by the candlestick high and the oversold region by the candlestick low in a form of a line. To utilize the full strategy i recommend using "Ska ZigZag Line" together with "Ska ZigZag BuySell". NOTE: This indicator is a line based indicator. HOW TO USE: Sell Signal; Place a sell trade when the Ska ZigZag BuySell indicator arrow appear on top of the Ska ZigZag Lin
FREE

RSI Signal Scanner The primary trend of the stock or asset is an important tool in making sure the indicator's readings are properly understood. For example, some of the technical analysts, have promoted the idea that an oversold reading on the RSI in an uptrend is likely much higher than 30%, and an overbought reading on the RSI during a downtrend is much lower than the 70% level. This indicator notifies you of RSI important levels breakouts (30% and 70%) by searching among the symbols and chec
FREE

Bu gösterge Kıvanç ÖZBİLGİÇ'in Matriks Veri Terminal'inde yapmış olduğu PMAX Göstergesinin MQL4 diline çevrilmiş halidir. Trend takip göstergesi olup oldukça başarılı bir göstergedir. Kullanımı ömür boyu ücretsiz ve sınırsız olacaktır. Bu göstergenin MQL5 dilinde yazılmış halinbe ulaşmak için profilime basabilirsiniz. Sizde MQL4 ve MQL5 diline ait yazılım taleplerinizi İpek Bilgisayar'a faturalı bir şekilde yaptırabilirsiniz. İpek Bilgisayar'a www.ipekbilgisayar.org adresinden ulaşabilirsini
FREE
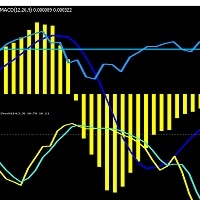
Use Stochastic with oversold and overbought to find trading opportunities. Use RSI to identify strength of trend anf confirm the trend matches the stochastic overbought and oversold. Trade on MACD cross matching the trend identified by Stochastic and RSI. Set stop loss at a recent swing high or swing low. Set take profit as a ratio of stop loss. Exits are on take profit and stop loss only, there is no exit signal.
FREE
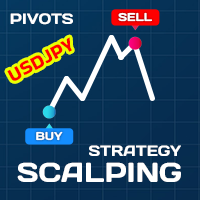
Download the USDJPY free version here.
Scalping Strategy
BUY SELL
Having a strategy in the market is one of the main conditions for trading. The presence of various and complicated indicators and tools sometimes makes trading difficult, and the user gets confused after trying various methods and gets stuck in a loss cycle, the result of which is usually clear. This indicator is a simple strategy based on the detection of pivots and short-term trends, which helps you to easily trade i
FREE
28 symbols, multi-time frame powerful Dashboard for the full market view Customizable Buy/Sell alerts, push alerts, email alerts, and visual on-screen alerts. Marked buy/sell signals Two color trend histogram. The commodity channel index (CCI) is an oscillator originally introduced by Donald Lambert in 1980. CCI measures current price level relative to an average price level over a given period of time. CCI is high when prices are above the average price, and low when the prices are below the a
FREE

WARNING: Product is out of support! MT5 version is highly recommended due to superior back-tester. It has much better reviews than the MT4 version, due to that fact.
Free version of the grid strategy! Identical strategy to the full version, the only limitation is the number of positions. Its goal is to harvest most out of trending market (on automatic mode) taking advantage of corrections in trends. It can be also used by experienced traders on manual trading. This kind of system is being use
FREE
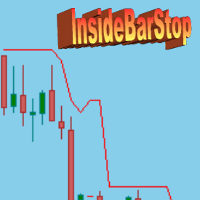
This indicator can be used to show and evaluate the trailing stop algorithm "Trailing Stop with Inside Bars" that was proposed by the famous German trader and author Michael Voigt ("Das grosse Buch der Markttechnik") to capture robust gains when trading strong price moves. The trailing stop price is shown as a red line. You can start the trailing stop anywhere on your chart (bars or candles) by setting the "initialBarDateTime" input parameter to the open time of an arbitrary candle You can speci
FREE

This indicator uses digital filters to analyze data. The indicator colors the chart candles in accordance with the current trend.
Digital filters are (simplistically) a way of smoothing data. Unlike traditional moving averages, a digital filter will be more effective in most cases. This indicator allows you to identify the difference between the current price and its expected value calculated by an adaptive digital filter. Moments of divergence are moments of price movement that can be used to
FREE

This indicator uses Bollinger Bands lines to detect markets trend. It's a very useful tool for manual trading. Furthermore it is possible to use the indicator with ATR as a filter , as well as the option to pop up an alert when a reverse trend occurs. The readings are very simple to use and understand. Indicator works best on H1 timeframe.
You can to get source code from here .
Parameters BarsCount - How many bars used to show the line. BBperiod - Period of Bollinger Bands. BBdeviations - De
FREE
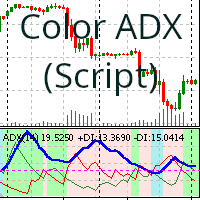
Ortalama Yön Hareketi Endeksi (ADX) göstergesinin arka planını alım veya satım trendine göre renklendiren sürükle ve bırak betiği
Ortalama Yön Hareketi Endeksi (ADX) göstergesi, bir trendin gücünü ölçmek için kullanılan bir teknik göstergedir. Bu sürükle ve bırak betiği, ADX göstergesinin arka planını alım veya satım trendine göre renklendirir. Arka plan rengi, betiğin parametreleri tarafından belirlenir. Değiştirilebilir parametreler: Period: ADX göstergesinin zaman aralığıdır. Level: Trendin
FREE

Hareketli ortalamalar hareket halindeyken değişir. Gösterge, hareketli ortalamaları hesaplamak için otomatik olarak periyodu seçer. Hareket ne kadar yönlü olursa, ortalama süre o kadar uzun olur. Eğilim yavaşladığında, hareketli ortalamaların periyodu azalır ve daha hızlı olurlar. Bu, trend değişikliğine daha hızlı tepki vermenizi sağlar.
Gösterge trendde veya trendin tersine çevrildiği noktada iyi çalışır. Yan duvarda, gösterge tersine kullanılabilir, örneğin hızlı bir kayma yavaş bir yukar
FREE
This indicator is a professional Trend identifier, it measures the angle or slope of moving averages with different methods. As this indicator calculate angles you can identify the strength of trend by magnitude of angle. It also shows if angle is increasing or decreasing which gives you the opportunity to make more information about current trend. You can combine this indicator with your strategy as a filter or you can use it alone to make your trading system. This is not a repainting indicator
FREE

If you trade or wish to trade the popular HLHB Trend-Catcher System, then this indicator is for you! It detects when the HLHB system entry rules are met and sends out an alert in the form of notifications to your mobile phone and to your pc. By automatically sending you notifications, this indicator lessens your trading work load as you don't have to sit in from of your pc all day checking all the chats for when the entry rules are met. This indicator does all the dirty work for you. When the si
FREE

This indicator is suitable for trading Forex and Binary Options, depending on its settings. The indicator is designed for trend trading. A buy signal: An up arrow appears on the chart. A sell signal: A down arrow appears on the chart.
Input parameters === Setup CCI === Period CCI 1 - Period of the CCI Period CCI 2 - Period of the CCI Level BUY - Level of the CCI for buying Level SELL - Level of the CCI for selling === Setup RSI === Level SELL - Level of the RSI for selling Period SELL - Period
FREE

MACD is well known indicator that still can be use for prediction where price will go next few minutes, hours or even weekly With colored bar of Macd, your eyes can easily catch when color is changed based what market price movement to find any early trend on market. here is the parameter of the indicator: TF_MACD , default is 1 Hour , this mean you can see clearly MACD of 1 Hour TimeFrame on Lower TimeFrame. InpPrice , default is Price Close , this is original MACD parameter from Metaquotes st
FREE

POWERFUL CANDLE USES THE TREND WAVE INDICATOR AND IT CAN IDENTIFY THE BEGINNING AND THE END OF A NEW WAVE TREND MOVEMENT.
AS AN OSCILLATOR, THE INDICATOR IDENTIFIES THE OVERBOUGHT AND OVERSOLD ZONES.
IT WORKS GREAT TO CATCH THE SHORT TERM PRICE REVERSALS AND USES A MARTINGALE STRATEGY TO CLOSE ALL TRADES IN PROFIT.
USE DEFAULT SETTINGS ON H1 OR HIGHER TIME FRAME ON ANY PAIR FOR MORE ACCURATE TRADES
WHY THIS EA :
Smart entries calculated by 4 great strategies The EA can be run on even
FREE

This indicator is not only for trading but also for learning, thanks to it, you can learn to identify trend, support and resistance.
You've probably heard about the Dow trend theory, where higher highs and higher lows indicate an uptrend, and lower highs and lower lows indicate a downtrend. This indicator determines this trend based on the Dow Theory. You just need to enter a number representing the number of candles between extremes. The optimal solution is the number 3 (H1 TF), unless you
FREE

TG MTF MA MT5 is designed to display a multi-timeframe moving average (MA) on any chart timeframe while allowing users to specify and view the MA values from a particular timeframe across all timeframes. This functionality enables users to focus on the moving average of a specific timeframe without switching charts. By isolating the moving average values of a specific timeframe across all timeframes, users can gain insights into the trend dynamics and potential trading opp
FREE

Introducing our simple yet powerful trendline trading expert, designed to open positions upon trendline breaks or touches based on predefined parameters. All you need to do is rename it to buy, sell, buy limit, or sell limit. As the name suggests, this is the basic version with minimal features. However, if you're looking for a truly professional trendline trading expert equipped with various trading management tools, automatic position sizing, trailing stops, breakeven points, partial closures,
FREE

SKAN This indicator helps you to scan all symbols which are in the Market Watch window and filter out a trend with alerts. It works on five most effective indicators which are used by most of traders for trading: Moving Average Super Trend (ST) Bolinger Band (BB) OPRC BFD It calculates two bars for scanning. When box colour changes to coral or royal blue colour, it indicates you for trend change for long and short entry. And also you will get alert on screen. When it changes to royal blue, it
FREE

This indicator is designed to find the difference in RSI price and indicator. This indicator shows the price and indicator difference on the screen. The user is alerted with the alert sending feature. Our Popular Products Super Oscillator HC Cross Signal Super Cross Trend Strong Trend Super Signal
Parameters divergenceDepth - Depth of 2nd ref. point search RSI_Period - Second calculation period indAppliedPrice - Applied price of indicator indMAMethod - MA calculation method findExtInt
FREE

The Heikin Ashi indicator is our version of the Heikin Ashi chart. Unlike competitor products, this indicator offers extensive options for calculating Heikin Ashi candles. In addition, it can be displayed as a classic or smoothed version.
The indicator can calculate Heikin Ashi with moving average by four methods: SMA - Simple Moving Average SMMA - Smoothed Moving Average EMA - Exponential Moving Average LWMA - Linear Weighted Moving Average
Main features The indicator shows Heikin
FREE
This EA opens a buy sell order based on the H4 trend. When the price goes over 100 pips ea keep opening orders against the price until the profit is positive and EA will close all orders and continue the new round. Requirement - Flatform: MT4 - Symbol: XAUUSD. - Time frame: M15 - Minimum deposit: >500$ - Leverage: 1:500 and higher - ECN broker - Virtual Private Server hosting (VPS) Parameters
FREE

This EA (Expert Advisor) is based on the logic of the ADX and utilizes the strength of trends as entry signals.
The most crucial factor here is the success rate of these entries.
By increasing the success rate, even with smaller profits for each individual trade, it becomes possible to accumulate substantial gains when trading across numerous currency pairs.
This EA primarily operates on longer timeframes because it makes it easier to determine whether the trend is upward or downwar
FREE

PrecisionWedge Detector X
Description: PrecisionWedge Detector X is an innovative indicator designed to identify and analyze wedge patterns on financial charts with unparalleled accuracy and precision. Developed using advanced algorithms, this indicator provides traders with a powerful tool to detect potential trading opportunities based on wedge formations. Key Features: Automatic Wedge Detection: Powered by sophisticated algorithms, PrecisionWedge Detector X automatically scans price data to
FREE
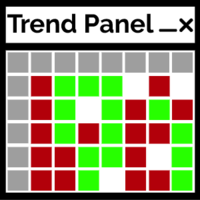
Trend Paneli, kullanıcı tarafından seçilen on çifti kullanarak M1 - D1 zaman çerçevelerinin onaylanmış bir trend yönünü gösterecek basit ve kullanışlı bir araçtır.
Gösterge, herhangi bir stratejiye/şablona yön teyidi eklemek için tasarlanmıştır ve ardından grafiği farklı bir çift veya zaman dilimine hızlı bir şekilde değiştirmek için temiz bir etkileşimli arayüz olarak çalışır. Grup sohbeti : https://www.mql5.com/en/users/conorstephenson Kurulum tavsiyesi ve ücretsiz bir Uzman Danışman için
FREE

The indicator is based on identifying engulfing candlestick patterns within the current timeframe. When such patterns are found, it generates buy and sell signals represented by up and down arrows, respectively. However, the user is responsible for determining the prevailing trend. Once the trend is identified, they should trade in line with the corresponding signal that aligns with the trend direction.
FREE

Engulfing candlestick patterns are comprised of two bars on a price chart. They are used to indicate a market reversal. The second candlestick will be much larger than the first, so that it completely covers or 'engulfs' the length of the previous bar.
By combining this with the ability to look at trend direction this indicator eliminates a lot of false signals that are normally generated if no overall trend is taken into consideration
FREE

Reward Multiplier is a semi-automatic trade manager based on pyramid trading that opens additional orders with the running profit of your trades to maximize return exponentially without increasing the risk. Unlike other similar EAs, this tool shows potential profit/loss and reward to risk ratio before even entering the first trade! Download full version here ( In the mini version. Starting lot is fixed at 0.01 (or minimum allowed lot size ) Guide + tips here MT5 version here You only open the
FREE

Bu Komut Dosyası, trend çizgileri, Fibonachi Düzeltmeleri vb. gibi herhangi bir türdeki çizim nesnelerini bir veya daha fazla başka grafiğe kopyalamanıza olanak tanır.
Varsayılan olarak komut dosyası, geçerli grafikteki, yani komut dosyasının uygulandığı grafikteki tüm nesneleri, o anda yüklü olan aynı Symbol'ün diğer herhangi bir grafiğine kopyalar.
Ayarlar
HedefZaman Dilimi PERIOD_CURRENT dışında herhangi bir değere ayarlandığında, nesneleri komut dosyasının uygulandığı grafikle aynı Sem
FREE
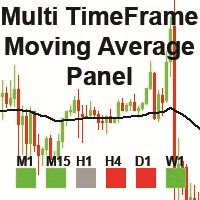
The "MTF Moving Average Panel" indicator is more of a helping tool than an indicator, it serves to help traders to spot the trend direction without having to change the timeframe and check all timeframes. It is best used with other indicators and signals, to help filter the signals according the trend based on multiple timeframes.
Indicator inputs : - Moving Average period : The period for the Moving Average. Default is set to 50 periods. - Moving Average method : The method of calculation of
FREE
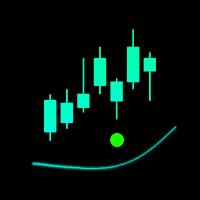
The indicator is designed for fast scalping. The principle of operation of the indicator is based on the direction of the Moving Average.
The period and sensitivity of the Moving Average can be adjusted for yourself in the indicator settings. I recommend watching my advisor - Night Zen EA
Subscribe to my telegram channel, link in my profile contacts. Advantages of the indicator: The free version is full, there are no additional purchases The arrows are not redrawn, the signal comes after
FREE

Donchian channels are a tool in technical analysis used to determine the relative volatility of a market and the potential for price breakouts.
Can help identify potential breakouts and reversals in price, which are the moments when traders are called on to make strategic decisions. These strategies can help you capitalize on price trends while having pre-defined entry and exit points to secure gains or limit losses. Using the Donchian channel can thus be part of a disciplined approach to manag
FREE

"Drivers Road Bands" indicator that is designed to be used in the 1H, 4H and 1D timeframes in the most ideal way. If we compare timeframes to roads and streets; main streets and highways with high traffic volume are similar to high-time timeframes in technical analysis. If you can interpret the curvilinear and linear lines drawn by this indicator on the graphic screen with your geometric perspective and develop your own buy and sell strategies; you may have the key to being a successful trader.
FREE

This indicator evaluates the market sentiment using raw price action measurements, and it is an amazing trading confirmation. It can be used to take a trend-trade approach or a contrarian approach using reversal patterns. [ Installation Guide | Update Guide | Troubleshooting | FAQ | All Products ] Find early reversals Confirm short-term trades Detect indecision on the market Take contrarian trades near support and resistance levels Trade inside bars confirmed by overall direction of the market T
FREE

This indicator will show week and monthhigh low, very useful to understand the market sentiment. To trade within the range/ break out. Low- can act as support- can used for pull back or break out High- can act as resistance- can used for pull back or break out Breakout strategy refers to the day trading technique that provides traders with multiple opportunities to go either long or short . The main idea is to identify the trend in its most juicy state followed by a trending move.
FREE

Volatility under control. The indicator shows the optimal depth for setting goals within the day and on the average trend. It also builds pivot zones for the estimated correction depth. As an accompaniment, the key levels of the structure are displayed for several timeframes. Classical volatility indicators ATR & ADX on fixed timeframes are used for calculation. The calculation takes into account the spread, and if the market is slightly volatile, you will see a warning about the risk. You can c
FREE
The "FracLine" Expert Advisor uses trend lines based on fractals to open a position.
It works at closing prices, so optimization and testing can be performed at open prices. The time frame and tool can be anything. Definition of a fractal for this EA:
a fractal is a 9-candlestick pattern, where the central one is the maximum (in an upward movement) or minimum (in a downward movement) in this pattern.
A prerequisite is that to the left and right of the high (fractal candle) there must be a
FREE

Keltner Trend Pro - Unleash the Power of Price Action! Are you ready to transform your trading approach? Meet Keltner Trend Pro, an Expert Advisor meticulously crafted to harness the dynamic movements of the market using the renowned Keltner Channel and Average True Range (ATR) indicators. Limited-time Special Opportunity: Seize the moment! Be among the first 10 (Purchasing 0/10) to seize this unique opportunity, and not only will you acquire a top-tier trading algorithm but also enjoy an exclu
FREE

The indicator displays two Moving Average lines on the chart with parameters specified in the settings. It issues a signal in the form of arrows and a sound at the intersection of these Moving Average. In the indicator settings, you can set the period of fast Moving Average ( Fast MA Period ) and slow Moving Average ( Slow MA Period ). And also Shift, Applied Price, Method and Timeframe for two Moving Averages separately. Important:
The main difference from oth
FREE

This indicator will show yesterday and today high low, very useful to understand the market sentiment. To trade within the range/ break out. Previous day low- can act as support- can used for pull back or break out Previous day high- can act as resistance- can used for pull back or break out The previous day high low breakout strategy refers to the day trading technique that provides traders with multiple opportunities to go either long or short . The main idea is to identify the trend in its m
FREE

The indicator searches for and displays Doji candlesticks on the chart and signals the appearance of such a candle. The direction of the signal depends on the direction of the previous candles, as the Doji signals a reversal or correction. In addition to the possibility of signaling, the power of the reversal is graphically shown (the more green, the more likely growth, the more red, the price will fall). In the indicator settings, you can change the parameters of the Doji candlestick, the closu
FREE

This scanner shows the trend values of the well known indicator SuperTrend for up to 30 instruments and 8 time frames. You can get alerts via MT4, Email and Push-Notification as soon as the direction of the trend changes. This is the FREE version of the indicator: SuperTrend Scanner The free version works only on EURUSD and GBPUSD!
Important Information How you can maximize the potential of the scanner, please read here: www.mql5.com/en/blogs/post/718074
With the following FREE indicator you
FREE

Investment Castle Indicator has the following features: 1. Dictates the direction of the trend in different Timeframes . 2. Shows the hit rate and winning rate on the chart. 3. This indicator does not repaint the chart. 4. This indicator is built-in the Support & Resistance based Investment Castle EA which works with Psychological Key Levels "Support & Resistance" Indicator.
FREE

The Green Dragon is a strategy that uses the Ichimoku Kinko Hyo system to place trades. The primary element of the Green Dragon is the use of the Chinkou Span as it crosses price action to place trades. This is a classic strategy of the Ichimoku even though its not as popular as some of the other strategies. The Chinkou Span is normally thought of as a market momentum indicator and used to give a trade set up more conviction when analyzing price movement. I find this description somewhat vague a
FREE
This EA has no stop loss. All risks are at your discretion.
This is Free EA, It can make you profitable if you use it carefully. Please don't ask for the MQ4 file, I'm using it to develop other robots.
Gegenpressing EA is a fully automatic Expert Advisor for Scalping Trading on XAUUSD timeframe M1 but also in others. The basic strategy starts with Market order in Trend Following, so this EA Follow the Trend . M1 Trend…. very very fast.
If you like this EA and want to help me de
FREE
This expert advisors trades donchian breakouts according to Bill Williams's definition of "Trading in the Zone". It uses alligator to find strong trends, AC and AO to identify trading zones and MACD to avoid trading exhausted trends. [ Installation Guide | Update Guide | Troubleshooting | FAQ | All Products ] Easy to use and supervise Fully configurable indicator settings Customizable break-even, stop-loss, take-profit and trailing-stop settings Works for ECN/Non-ECN brokers and 2-3-4-5 digit s
FREE

The indicator helps to determine the potential for price movement within the day and on a trend. For calculations, the average price movement on the instrument is used. If you have a problem setting TP, the indicator allows you not to overestimate your expectations. For volatile instruments, the SL position can also be taken into account. If the entry was in the right place, the risk / reward ratio will prompt a profitable level for profit taking. There is a reset button at the bottom of the sc
FREE
MetaTrader Mağaza, ticaret robotları ve teknik göstergelerin benzersiz bir deposudur.
Yatırımcılara sunduğumuz benzersiz hizmetler hakkında daha fazla bilgi edinmek için MQL5.community - Kullanıcı notunu okuyun: ticaret sinyallerini kopyalama, freelancerlar tarafından geliştirilen özel uygulamalar, ödeme sistemi aracılığıyla otomatik ödemeler ve MQL5 Bulut Ağı.
Ticaret fırsatlarını kaçırıyorsunuz:
- Ücretsiz ticaret uygulamaları
- İşlem kopyalama için 8.000'den fazla sinyal
- Finansal piyasaları keşfetmek için ekonomik haberler
Kayıt
Giriş yap
Gizlilik ve Veri Koruma Politikasını ve MQL5.com Kullanım Şartlarını kabul edersiniz
Hesabınız yoksa, lütfen kaydolun
MQL5.com web sitesine giriş yapmak için çerezlerin kullanımına izin vermelisiniz.
Lütfen tarayıcınızda gerekli ayarı etkinleştirin, aksi takdirde giriş yapamazsınız.