YouTube'dan Mağaza ile ilgili eğitici videoları izleyin
Bir alım-satım robotu veya gösterge nasıl satın alınır?
Uzman Danışmanınızı
sanal sunucuda çalıştırın
sanal sunucuda çalıştırın
Satın almadan önce göstergeyi/alım-satım robotunu test edin
Mağazada kazanç sağlamak ister misiniz?
Satış için bir ürün nasıl sunulur?
MetaTrader 4 için ücretsiz Uzman Danışmanlar ve göstergeler - 47

Based on technical analysis and the logic of upward (bullish) and downward (bearish) trends, the bot eliminates speculative cases in the market. High-precision bots surpass humans in all aspects: they replace a workforce and have no limitations on working hours. Unlike humans, they are not subject to fatigue, illnesses, emotions, etc. The bot is limited from the risks of losing the entire capital as it incorporates STOP Loss and Take Profit features. These features help manage potential losses
FREE
Simple and unobtrusive utility for displaying weeks, days and hours
Options to control the display of separator lines and labels allow you to customize them to your own taste Display of the separator lines either only in the main chart, or across any indicator windows Automatically reduce intensity of less relevant separator lines and labels for the chart‘s current magnification
FREE
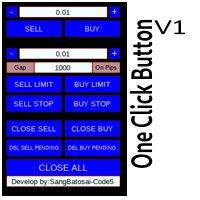
Simple button panel of trade on your chart with OneClick V1 Trial version. This trade panel will make it easier for you.
Equipped with several functions that make it very easy for you. More tools on OneClick VZ version, see here.
This version includes: Open Order Buy Open Order Sell Open Pending Order [Buy Limit - Buy Stop - Sell Limit-Sell Stop] Close ALL orders
Close Order Buy Close Order Sell Delete Pending Order [Buy Limit - Buy Stop - Sell Limit-Sell Stop] ENJOY IT!!! ONE CLICK V1 [TRIAL
FREE

"Statistics by magic pro" is a program that provides statistics after entering a magic number. You can simultaneously track up to 10 statistics for different magic numbers in one chart window. The program is very easy to use. The program should be run on any free chart. In the EDIT field on the chart, you should enter the magic number. Entering "0" will erase the statistics in that window. The operation of the program can be stopped by selecting the statistics off option. After selecting it, the
FREE

The Control risk panel indicator is an information panel that allows you to monitor the status of trading on the account. Information about open orders is provided in the form of a position with a choice of three types of grouping: 1. No grouping - shows the minimized position by symbol, it is recommended to use for General assessment of the situation 2. Groups the position by symbol into subgroups by magic number, it is recommended to use it to monitor the work of different expert advisors on o
FREE
Hello,
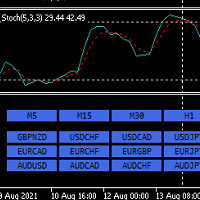
This is an easy symbol change panel.
The free version only can change major pairs which are "AUDUSD, EURUSD, GBPUSD, USDCHF, USDCAD, USDJPY, NZDUSD"
The full version can add your symbols.
FULL version here:
https://www.mql5.com/en/market/product/71176?source=Site+Market+MT4+Indicator+New+Rating005
Also, can change the TimeFrame as well.
Symbols must be active on your Market Watch list.
Parameters:
ratio - change the size LineNumber - you can set that how many symbols are displa
FREE

If you want to test the functionality of this tool, you can do it trough this DEMO version, that is restricted to work only on EURUSD and USDJPY currency pairs. Full version is available here: https://www.mql5.com/en/market/product/29243/ This EA was originally coded as a back up tool for my personal trades as all of us (Or at least the ones who have left an order open and went to sleep) have experienced the frustration that involves waking up, check the trades and see that in some of them the
FREE

Trend indicator Trend Esay MTF is an indicator that draws arrows directly on the price chart. Like every trend indicator, it works well with good price movement and worse in a flat. A feature of this indicator is the ability to send alerts both in the terminal and on a smartphone. The indicator menu contains the number of bars in the history of the indicator and period value for determining the trend. The "trend" function has been added to the indicator menu, which filters the indicator signals
FREE

Belogex - Мы делаем трейдинг простым и удобным! BX Indicator позволяет трейдеру объединять стандартные индикаторы с разных таймфреймов в один уникальный сигнал на графике, настраивать поиск любых свечных моделей и комбинировать их с сигналами от абсолютно любых индикаторов, даже с закрытым исходным кодом, а также получать уведомления о их работе в реальном времени. Это демо версия программы! В демо версии встроены готовые шаблоны торговых систем. Менять параметры индикаторов, добавлять свечны
FREE

This utility identifies certain candle open times on chart, this can help you to see your favorite candle open and use it as it fits in your strategy. This tool is very useful for intraday charting and indicating your sessions. ___________________________________________________________________________________
Disclaimer: Do NOT trade or invest based upon the analysis presented on this channel. Always do your own research and due diligence before investing or trading. I’ll never tell you what
FREE

Orders Manager is a simple and indispensable assistant for managing all your orders. Inputs: Magic = 999; // Magic TakeProfit = 1000; // Take Profit. If = 0 the level is not setts. StopLoss = 0; // Stop Loss. If = 0 the level is not setts. Slippage = 10; // Slippage GeneralProfit = false; // Closing all orders based on total profit. If false the function is disabled and works according to TakePr
FREE

This is an expanded version of my Daily Sacrifice EA that closes old losing trades at the expense of a portion of your profits. This helps to slowly work away drawdown and accelerate the closure of martingale grids
*** Pro Features *** Include/Exclude symbols. These fields are empty by default, but if populated allow you to include only specific symbols or alternatively exclude specific symbols Execute on an hourly interval. Allows the EA to be ran every so many hours rather than on a fixed
FREE
This script permits to delete the pending orders or close the market positions on platform. Very simple to use. Upload the script on the chart and the script will done the work for you following the input values.
An utility to manage very quickly your trading.
Input Values TypeOrders Only BUY (delete or close only BUY) Only SELL (delete or close only SELL) BUY and SELL (delete or close ALL) Type Positions (close only market orders) Only STOP (delete STOP pending orders) Only LIMIT (delete LIMIT
FREE
New version 1.22. Partagas
The AG algorithm is an element of a comprehensive trading system for trading a basket of currencies across 8 major currencies across all 28 currency pairs. The algorithm serves as a signal block for determining entry/exit from a position. To collect initial values, AG uses data from the CSS Currency Slope Strength cluster indicator. This indicator was not chosen by chance - it performed very well during testing of the algorithm. A. AG determines the width of the e
FREE

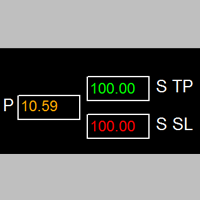
Bu EA, yatırımcılara aşağıdaki avantajlar konusunda yardımcı olur:
- Verdiğiniz satış veya alış emirleri için giriş noktasını gösterin.
-grafik üzerinde TP & SL seviyelerini göster
- parti boyutunu kontrol edin
- noktalarda TP & SL seviyesini kontrol edin
- tüm grafik periyodunda çalışır
- sinyalinizde yükselen algo ticareti sıralaması
- tek bir tıklamayla tüm anlaşmaları kapatma
- yalnızca karlı anlaşmaları kapatmak
- sadece kaybedilebilir tüccarları kapatmak
FREE
Corretora recomendada para usar esse indicador: https://tinyurl.com/5ftaha7c Indicador que pinta o candle de amarelo em pontos de muita agressão no mercado. Sempre que o mercado for se movimentar o candle irá ficar amarelo. Valido para todos ativos e todos timeframes. SEE OUR RESULTS ON INSTAGRAM: https://www.instagram.com/diogo.cansi/ TELEGRAM GROUP = https://t.me/robosdsc More information by email dscinvestimentos@gmail.com or by Whatsapp 55-991372299
FREE

AllHere is a plug-in for Control-adora that works as information panel. Its main function is to show you all the Control-adora elements placed in the chart, like the Control-adora's orders or the exit lines. On the lower left corner, AllHere shows a collection of buttons classified by color (you can set them in the indicator's properties) for several elements used in Control-adora system: Stop loss indications (stop loss Arrows) Exit lines Above (Above trend lines) Exit lines Below (Below trend
FREE

This reliable, professional trade copier system is without a doubt one of the best on the market, it is able to copy trades at very fast speeds from one master account (sender) to one or multiple slave accounts (receivers). The system works very fast and mimics the master account a full 100%. So changing stop losses, take profits, pending orders on the master account is executed on the slave accounts too, like each other action. It is a 100% full copy (unlike many other copiers who only copy mar
FREE
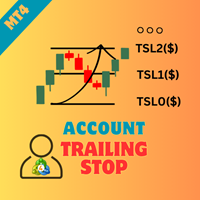
Account Trailing Stop Manager MT4 Description:
The "Account Trailing Stop Manager MT4" EA is designed to automatically calculate and remember the profit of the entire account or specific magic number, and trail it like a trailing stop loss. When the current profit becomes lower than the last saved profit, it will close all trades. This EA provides a convenient way to manage trailing stops for your account. For detailed documentation Overall Settings/Input Guide High Level Overview of Feature
FREE

The indicator allows you to trade binary options. The recommended time frame is М1 and the expiration time is 1,2,3 minutes. The indicator suitable for auto and manual trading. A possible signal is specified as a arrows above/under a candle. You should wait until the candle closes! Arrows are not re-painted Trade sessions: TOKYO section (Half-end) Currency pairs: USD/JPY Working time frame: M1 Expiration time: 1,2,3 minutes. The indicator also shows good results when using the martingale strateg
FREE
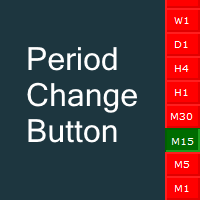
Fastest way to change the period. Suitable for traders who use many charts and timeframes. Size, shape and color can be customized.
Inputs Parameters Corner — Choose corner placement Standart is "Right lower chart corner" Color — Background color of the button ColorText — Text color of the button ColorOn — Background color of the button for the current period ColorOnText — Text color of the button for the current period Font — Arial, Verdana... FontSize — Size of the font in pixels DistanceX —
FREE
Multi operations script to operate manually. It is not a toy!
Warning: This script needs one to two months of utilization to achieve a proficient usage level and knowing all functions and market situations where it can be used.
THIS IS A TOOL FOR PROFESSIONALS & EXPERIENCED TRADERS!
You can save thousands of configurations to make thousands operations beyond your imagination .
Steps buy to protect steps sell, chains of take profits and stop losses, protected, martingale, progressive, inverte
FREE
This is the free version of "SAR Trading Station"(auto trading GBPUSD only), the full version link is here https://www.mql5.com/en/market/product/4690 SAR Trading Station is a semi-auto trading system based on Parabolic SAR and Stochastic etc, and trend driven swing trading strategy. This is an agile platform allowing you to setup various parameters to optimize the specific symbol pair trading strategy for yourself! Risk(Max Loss$): Default is 50, Max loss Per order(Position size is calculated b
FREE

This is a Bot which send notifications every hour at your MT4 platform. The notification consists of four part. <<Clock>> + Your Message + Symbols + profit + Total # of Orders + Total profit Here is an example : 21:00 Hodor: #US30 $+40.31 GOLD $-5.31 Total 5 Orders $+35.00 If there is no order : 21:00 Hodor: HODOR signals: https://www.mql5.com/en/signals/977796
There is a private message parameter where you can enter your own message also. Hodor_Comment_OnOff_Flag removes the "Hodor i
FREE

This EA opens trades when a trend inversion occurs. Trades are normaly closed one by one. When an open trades must be recoverd, the EA opens reverse trades using the same criteria of standard orders. This is the free and limited version of the FRT PriceAction Pro. I suggest to use this EA, first with EURUSD at M1 or D1 , on an ECN account with a good leverage and low spread + commissions (not over 7 USD per lot). If you attach the robot to more than one parity on the same account, remember to
FREE
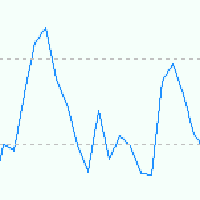
EA is based on Parabolic SAR and MACD indicator. if there are loss EA try to recover loss and fix position by placing another bigger order( factor multipler) after grid gap. if there is profit it waits to optimize profit. Suitable for Beginners No complex settings Just use EURUSD M5 time frame YOU CAN CONTACT ME FOR OPTIMIZATION Please leave the comment your like or dislike I will be happy to answer all kind of query related to this product... I advise you to please check my ot
FREE

TickChartOscillator, osilatör alt penceresinde bir sembolün tik grafiğini görüntüleyen bir göstergedir.
Özelleştirme için esnek ayarlar sağlar:
- Osilatörde fiyat çizgisinin görüntülenmesini devre dışı bırakma yeteneği.
- Tik grafiğinin yayınlanacağı farklı bir sembol belirleme yeteneği.
"Sembol" parametresi boş bırakılırsa, tik grafiği göstergenin ayarlandığı mevcut sembol için görüntülenecektir.
Bu araç, kene dinamiklerini osilatör formatında görmek ve bunu analiz etmek ve alım satım kar
FREE

EXTERNAL EA MANAGER is a programme designed to help manage trading.
If you want any EAs to stop trading at a certain point (for example on FRIDAY in the evening) and you would like to do it remotely and automatically...
EXTERNAL EA MANAGER is a programme for you.
It will deinitialize the whole MT4 terminal and all EAs running.
During deinitializiation process there is an option to kill all trades. It means all opened trades as well as all pending orders will be terminated. You can use a maximum
FREE

Belirli grafik modellerini, omuz başı omuz / ters, üçlü üst / alt, kupa, bayraklar ve diğerlerini tespit etmek için küçük ücretsiz gösterge... Bir süre önce tasarladım, m1, m5, m15, m30 ve h1'deki rakamları algılıyor.
Umarım işinize yarar çünkü bu gösterge ile pek işlem yapmıyorum, birkaç tane daha var bunları hızlıca internete koymaya çalışacağım belki işinize yarar, iyi ticaret dostları.
FREE

The difference between the arithmetic and geometric means at the specified range. Since the greater is the difference between the values, the greater the resulting figure is, actually the indicator shows volatility fluctuations. The arithmetic mean of a certain number of values is the sum of the values divided by their number. The geometric mean is the root of the power of the number of values extracted from the product of these values. If all values are equal, the arithmetic mean and th
FREE

Countdown timer till the bar closure, + % Progress status: My #1 Utility : includes 65+ functions | Contact me if you have any questions In the settings of the indicator, you can configure: Timeframe for Calulculation; true / false: Higher TimeFrame option (next from the currently used: M15->M30, H4->D1...) Position:
1 = Bottom Left corner;
2 = Bottom Right corner;
3 = Top Left corner;
4 = Top Right corner; Font Size; Color; Font Style;
FREE
Hello, Every one The EA is used to close buy or sell market positions and all pending orders when the RSI reaches a certain value. It is also used to close positions in the market when the profit reaches a certain value. All setting 1. RSI Period : 14 ( or as you want ) 2. RSI Close Buy Value : 70 (The EA will close all long positions and Pending Buy Orders when the RSI is above 70) 3. RSI Close Sell Value : 30 (The EA will close all short positions and Pending Sell Orders when the RSI is
FREE

Indicator overview Trend indicator usage Moving averages. Highest quality alerts that need no introduction. It is completely loyal to the original algorithm and uses other useful features.
Easy to trade Carry out all kinds of notifications It's not a new paint and it's not a back paint. Setting Indicator SSMA50 in Time frame H1 for any pair currency and Gold Spot. EMA200 in Time frame H1 for any pair currency and more than EMA250 for Gold spot. Using it for maximum benefit Set up notificatio
FREE

The strategy used by this trading robot is placing stop orders (Pending) before the news event. The news event release time can be accessed from investment.com an app that the trader must download from play store into his/her mobile device. The robot places two stop orders, a Buy Stop and Sell Stop at the same time at least two minutes before news release time. For example, if the news release time is 15:30, the pending orders will be opened at 15:28(see how to insert the news time at screensho
FREE

The Mono Waves indicator is designed to display the wave behavior of the market on a chart. Its appearance is presented on slide 1. This indicator uses the PPPC (Point-Percent Price Channel) indicator, which can be downloaded for free from the Market . When the market moves up, the upper border of the price channel is built on High candlestick prices (for more details, see the description of the PPPC indicator at the link given above). The higher the High prices rise, t
FREE

OCTO TACK TREND INDICATOR
Summary/Description: Trend indicator showing signals to execute orders in favor of the current trend Get ready to have the best trend indicator you've ever tried. No repainting in any way, guaranteed It generates clear signals and always in favor of the trend (see screenshots) You just have to wait for the alert to indicate it and earn pip Are you tired of indicators that never work? Here we have the solution, try the free version and if you want to have more signals
FREE
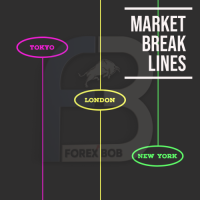
Market Break Lines is an utility tool to create a partition line at market openings/closings of Tokyo/London/NewYork sessions. This will help you to compare the market movements, volatility variations between the different markets.
Inputs: Inputs are simple to feed the time of Tokyo/London/NewYork sessions as per your broker server time Change Color and width of partition lines You can enable or disable any line (Hide/Show).
Please don't forget to support by giving handsome reviews/rating MT5
FREE
This is an additional Tool for Line Alarm Tool for sending Telegram Notification when price reaches a Horizontal Line Line Alarm Tool is an indicator so it can work in coexistence with Expert Advisor, but Sending Telegram Message from MT4 can only be performed by an Expert Advisor. Thus, this additional tool was created.
Get the Line Alarm Tool here: https://www.mql5.com/en/market/product/81723
How to Enable Telegram Notifications? Open: Tools -> Options -> Expert Advisors -> Allow W
FREE

The chart bucket indicator primarily creates custom candlesticks which comes with adjustable colors, color themes and sizes and even comes with a demo. Also included are trade details relevant to trading and binary options.
If your a binary options trader this may be useful for timing of bars with actual price that you can compare with your binary options broker.
Key Features Custom Candlestick Themes, Custom Colors & Sizes. Ask/Bid Point Difference.
Open/Close Point Difference of current bar
FREE

Introducing Spyder Equity Protection EA: Your Shield in Forex Trading In the dynamic world of forex trading, protecting your hard-earned capital is paramount. That's where Spyder Equity Protection EA steps in - your reliable partner in safeguarding your trading account. ️ Total Peace of Mind : Spyder Equity Protection EA is designed to provide traders with unparalleled peace of mind. With its advanced equity protection mechanisms, you can set predefined loss levels, ensuring that your account
FREE

The script automatically downloads historical data for all instruments from the "Market Watch" window, on all timeframes from M1 to MN1. It is recommended to use the script before launching multi-symbol and multi-timeframe indicators that work simultaneously with many instruments. Features: To download quotes, the script uses the MQL API only. This is a necessary requirement for publishing programs on the MQL-Market. This method is fast enough, but effective in not all cases. A more reliable (bu
FREE

This tool automatically sets stop loss and take profit when opening orders.
The information is displayed in the lower right corner of the terminal and displays the lot size, stop loss and take profit levels, as well as the current profit/loss in points for each open order.
It is possible to close orders. to do this, double-click the desired order in the lower right corner and simply move it to the left.
It also displays recommendations for the current instrument in the form of OPEN BUY, KEEP
FREE

Pivot Mean Oscillator (PMO) is a unbounded zero-centered oscillator that provides a quick and normalized measure of divergence between two spreads. Detailed description of the mathematical formulation along with some comments and experiments can be found in this article .
Trading aspects
This version of PMO is tuned on spreads relative to Close and Open price signals against their cumulative moving average (CMA). Positive PMO(m,n) values means that last (normalized) m Close prices are higher t
FREE

Trend Rising, özel bir MT4 (Metatrader 4) göstergesidir, birden fazla zaman dilimine dayalı Bill William Göstergelerini kullanarak trendi ve momentum modelini analiz eden TF M30 ve altı ölçeklendirme için en iyi şekilde kullanın. Sonuç olarak, çoğu döviz çiftinde işe yarayan trendin başlangıcını ve sonunu tanımlar. Trend Yükselen göstergesi, Hızlandırıcı Osilatörü ve Müthiş Göstergeye dayalı olarak geliştirilmiştir.
Ana Özellikler Trendin başlangıcını ve bitişini renkli ekran olarak belirle
FREE

Demo version of the paid product - Copy MT4 copier , limited to lot size of 0.01 Universal copier of deals from MetaTrader 4 to MetaTrader 4 ( MT5<->MT5 version is available ; with both versions, you can copy MetaTrader 5<->MetaTrader 4, MetaTrader 4<->MetaTrader 5, MetaTrader 5<->MetaTrader 5, MetaTrader 4<->MetaTrader 4). Spread filter. Select the best price (start copying positions with a profit or loss). Configure the lot size, fixed or ratio-based (provider signals can be copied with an inc
FREE

The adviser finds the trend of the currency pair on a given number of bars, then determines the time of the onset of correction. If the trend is strong enough, and the correction becomes equal to the one specified in the parameters, then the adviser can open a trade in the direction of the trend, if additional indications of indicators confirm the opening of the trade. You can set different correction values and many other parameters. This version of the Expert Advisor is free, it has limitati
FREE

Convenient tool for measuring the number of points between the prices directly on the chart. Displays in the measurement between points in percentage, points (financial) and time (bars ). Compatible with all graphical timeframes. When fixed on the chart is displayed in all timeframes. Press Ctrl, click the first point, move the mouse and will now display the measurement. Click again and fix. Very fast tool that does not occupy much space. Input Parameters Line Color Line Style Text Color Text S
FREE

Information panel displaying traded lots for pairs, as well as the minimum margin level and maximum drawdown. The info panel will be indispensable when calculating the affiliate program and expert advisor tests. In the settings, you can add up to 10 of your favorite pairs, customize the panel display colors and its location. Check out my other products, maybe they will be useful to you.
FREE

CloseProfit is a utility created to automate the process of setting a stop-loss and closing orders when a certain percentage of profit is reached.
The utility also has two Buy and Sell buttons on the chart for opening orders.
The utility can be used to close orders opened by other advisors, with a stop-loss or a percentage of the increase in the deposit. To do this, you need to set in the settings a magic number that matches the one that is installed in the advisor when opening a transaction.
FREE

-------------------------------------------------------------------------------------------------------------------------------------------------- New version of this product is here : https://www.mql5.com/en/market/product/59924?source=Site+Profile+Seller -------------------------------------------------------------------------------------------------------------------------------------------------- TOTAL TAKE PROFIT & TOTAL TRAILING STOP. Average Take Profit & Average Trailing Stop. Setup TO
FREE

This reliable, professional trade copier system is without a doubt one of the best on the market, it is able to copy trades at very fast speeds from one master account (sender) to one or multiple slave accounts (receivers). The system works very fast and mimics the master account a full 100%. So changing stop losses, take profits, pending orders on the master account is executed on the slave accounts too, like each other action. It is a 100% full copy (unlike many other copiers who only copy ma
FREE

我很高兴欢迎您来到我的产品页面 面板初次加载会服从后台设置,面板控制交易管理凌驾于后台之上。请注意交易方向的管理,正确的交易方向是交易市场生存的根本,这点很重要。 Ea交易有2种策略Sto,MA和用户在面板打开的执行订单,同时也支持移动端下单(下单基础请服从后台自行设置手数)、移动端预下单功能。 Sto策略单量密度大,是激进策略;MA策略较缓和。
此EA可全自动化交易,设置偏向于辅助手控交易。 ============Basic settings============= Magic EA 交易品种(trading variety) 点差(Spreads) 点差系数(Spread coefficient) =============conditions for execution==== 交易模式(Choosing strategy) 打开新系列订单(Open new series) //是否允许,否的话会停止打开新阶段订单。关闭状态适合运行预交易功能,也就是控制运行,一阶段一结。。 开多(Trade Sell) //处于关闭状态会停止一切开Sell方向单子。 开
FREE

Bu gösterge, mevcut grafik ayarlarını tek bir düğmeye tıklayarak bir şablona kaydetmenize olanak tanıyarak grafik şablonları oluşturma sürecini basitleştirir. Gösterge, şablonu belirli bir ad ve önekle otomatik olarak kaydeden ve şablonları düzenlemeyi ve kullanmayı kolaylaştıran bir düğmeyi doğrudan grafiğe ekler.
Göstergenin ana işlevleri şunlardır:
Düğmeye tek bir tıklama ile mevcut grafiğin bir şablonunu oluşturma. Şablon adı için bir önek belirleme imkanı, bu da onları ayırt etmeyi kolay
FREE

Features This EA uses Moving Average technical. This EA specializes in GBPJPY, so we recommend you apply it to that chart. Please apply this EA to the 15 minute chart. This EA is easy to manage because it has a maximum of 1 position. The maximum profit is set at 0 pips(Unlimited). The maximum loss cut is set at 80pips. You can add an EA position by pressing the add button. This EA is highly reliable because it is optimized using TICKDATA.
Parameters -----Basic parameter----- magic - Please set
FREE

Basket Recovery System : is useful for trading multiple pair on a single account, single chart.
Functions Of this Ea
with a simple click on a button in any Symbol row, this Utilities will,
Open new Order, Set Lot, Close Order, Reverse Order, Add new Symbol, Delete Symbol, with a simple click on a Navigation Button, this Utilities will,
Select all Symbol Available on Broker, ReSet Symbol Lots, Close all Order, Set Low Risk for all Symbol, Remove all Pair with spread above 2two.
FREE

"TradeALot" is a plug-in for the Expert Advisor Control-adora . It allow you to place programmed orders without the need to write the name of the order in the Arrow (like bs, ss, bl, sl, sl1, sl2, etc). Just drag and drop the button for "Programmed Buys" or "Programmed Sells" over the candles-zone at the place where you want to program the order and TradeALot will compare the bid price with the position where you dropped the button and will decide if the order need to be "Stop" or "Limit". With
FREE

Change Symbol of all charts with a single click. Place this file in Scripts folder to make it work. Enter your desired chart and me and apply this script to any chart. It will change all charts to that particular chart.
For any help - telegram - @binaryguruofficial
Feel free to use this free script. May god bless you with big profits Good Luck for your trading. Regards : Binary Guru
FREE

特徴: このツールはDOWやNIKKEIなど500や1000ポイントがラウンドナンバーの 指数を取引する際に表示するように開発しました。 もちろんメジャー通貨でも表示はされます。
更新頻度を制限しているのでチャート表示が遅くなるということは ありません。
XMでDOWを取引される場合、Main Levelsを10000 Sub Levelsを5000にしてください。
各パラメータの説明: Number to display lines:表示するライン数を設定します。 Main Levels:メインレベルをポイントで指定します。 Main Line Color:メインラインの色を設定します。 Main Line Style:メインラインで使用されるラインを設定します。 Show Sub Lines:サブラインを表示するか設定します。 Sub Levels:サブレベルをポイントで指定します。 Sub Line Color:サブラインの色を設定します。 Sub Line Style:サブラインで使用されるラインを設定します。 Update Frequency(600
FREE
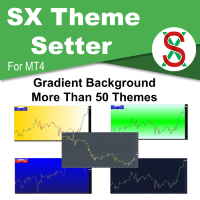
SX Theme Setter is intended for changing chart appearance in 2 modes: - Gradient background mode:
In this mode, the indicator creates a gradient background for your chart. Colors, steps and gradient type can be selected by user. - Color theme:
Color theme mode provides more than 50 built-in different color themes which can be selected from a list. Most of these themes are converted from official color themes of real trading platforms of the past and present. Try them out and see if they suit
FREE

RSI indicator with signal lines, at the intersection of which a corresponding notification will be issued, which can be in the form of a normal alert, or in the form of a user sound file.
The indicator also has the function of sending push-notifications and email notifications at the intersection of these levels.
The values of the levels can be set independently in the indicator settings, and, if desired, they can be changed and configured directly in the indicator window. This product is a
FREE

This is a fully functional evaluation version for working on "CADCHF". Full version - Risk Controller If there are active deals on the account when the robot is launched, then all of them except CADCHF will be closed! Risk controller is a tool allowing you to automatically control orders, losses and emotionally motivated actions.
Main advantages Limitation of the total account loss. When the MinimalDepo value is reached, any trade will be closed. Limitation of losses per day. Limitation of los
FREE

Note: this product is a free limited version of the full featured product Currency Timeframe Strength Matrix . It only includes AUD, CAD, CHF currencies instead of all 8 currencies. It includes only 5S, 1M, 5M time frames instead of all 8 (5S, 1M, 5M, 15M, 30M, 1H, 4H, 1D).
What is it? The Currency TimeFrame Strength Matrix is a simple and comprehensive Forex map that gives a snapshot of what is happening in the Forex market at the very present time. It illustrates the strength and momentum ch
FREE

If you can not create a background image for yourself (photo size and format must be changed), let me know. I make your photo for free. Otherwise, you can read the help file . A tool for chart management You can change the background image You can change the background color Change the color of the candles Volume colors, line charts and everything else You can also enable and disable some items Read the help file for more information
Settings:
Save Changes After Remove Tool
Back Ground Photo
FREE
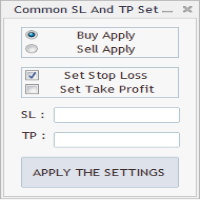
As in the Title. This is simply, but very usefull utility. Program "Common StopLoss And TakeProfit Value" enables You to set one value to Stop Loss, Take Profit, or both Stop Loss and Take Profit. For all Sell or Buy items, Depending on the option selected. All you need to do is select options, enter a value/values and press a button "APPLY THE SETTINGS". God Luck ! Enjoy using !
FREE
如果产品有任何问题或者您需要在此产品上添加功能,请联系我 Contact/message me if you encounter any issue using the product or need extra feature to add on the base version.
Session TakeProfit StopLoss is basically helping to set the take profit and stop loss in dollar for the total open orders (session). Once the total profit is greater than session_tp or less than session_sl, the EA will help to close all open orders acting similarly to a take profit/stop loss for a single order.
Inputs session_tp: session take profit ses
FREE

FREE for limited time! CoPilot EA is an add-on EA to provide additional Order & Risk Management for other EAs. Want more control and Telegram support? Check out CoPilot Pro: https://www.mql5.com/en/market/product/82009 Do you have favorite EAs that trade well, and you want additional control over it? Do you run multiple EAs on same account and you need a way to manage Risks and Orders from account level? CoPilot is the best companion for you! Features: Addition Order & Risk Management to other
FREE

It is a demo version of Advanced Arrow indicator It works only on GBPJPY but the full version works on all currency pairs.
Features Simply it gives you entry point ,SL line and 4 TP lines or less. Once SL-TP lines are shown with the arrow, they remains as they are until signal change. It is historical indicator. No Repaint.
Indicator parameters Indicator Version : choose V5 or V6. TP 1 Line color : TP1 color. TP 2 Line color : TP2 color. TP 3 Line color : TP3 color. TP 4 Line color : TP4 colo
FREE
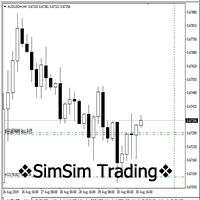
"SimSim Expert Assistant" утилита для сопровождению сделок трейдера в терминале МТ4. Утилита бесплатная, пользуйтесь. Кроме того, утилита открывает сделки по сигналам индикаторов SimSim Trading (через глобальные). Параметр индикатора "Signal shaping for SimSim Expert Assistan" указывает на это.
Как работать с утилитой. Expert Assistant работает в терминале МТ4 и устанавливается в папку Expert, в утилите нет ни одного параметра при старте. Все параметры находятся в списке глобальных переменных
FREE

O Afastamento da Média Móvel, é uma poderosa ferramenta de análise técnica projetada para fornecer uma representação visual do afastamento entre o preço atual e uma média móvel específica. Este indicador, desenvolvido para o MetaTrader, oferece aos traders uma perspectiva clara das mudanças na dinâmica de preço em relação à tendência de médio prazo. Versão MT5: https://www.mql5.com/pt/market/product/111704
FREE
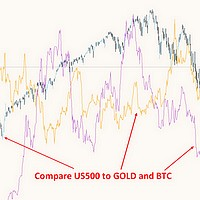
This free MT4 indicator allows you to easily compare as many symbols as you want! Make sure that the input symbol matches the name displayed in the Market Watch ***Please comment, rate and share it to your friends if you like it*** ------------------------------------------------------------------------------ Comparing trading pairs is useful for several reasons, including: Identifying relative strength: Comparing trading pairs can help traders identify which currency or asset is relatively stro
FREE
MetaTrader mağazasının neden alım-satım stratejileri ve teknik göstergeler satmak için en iyi platform olduğunu biliyor musunuz? Reklam veya yazılım korumasına gerek yok, ödeme sorunları yok. Her şey MetaTrader mağazasında sağlanmaktadır.
Alım-satım fırsatlarını kaçırıyorsunuz:
- Ücretsiz alım-satım uygulamaları
- İşlem kopyalama için 8.000'den fazla sinyal
- Finansal piyasaları keşfetmek için ekonomik haberler
Kayıt
Giriş yap
Gizlilik ve Veri Koruma Politikasını ve MQL5.com Kullanım Şartlarını kabul edersiniz
Hesabınız yoksa, lütfen kaydolun
MQL5.com web sitesine giriş yapmak için çerezlerin kullanımına izin vermelisiniz.
Lütfen tarayıcınızda gerekli ayarı etkinleştirin, aksi takdirde giriş yapamazsınız.