İş tamamlandı
Tamamlanma süresi: 2 gün
Geliştirici tarafından geri bildirim
Good job
İş Gereklilikleri
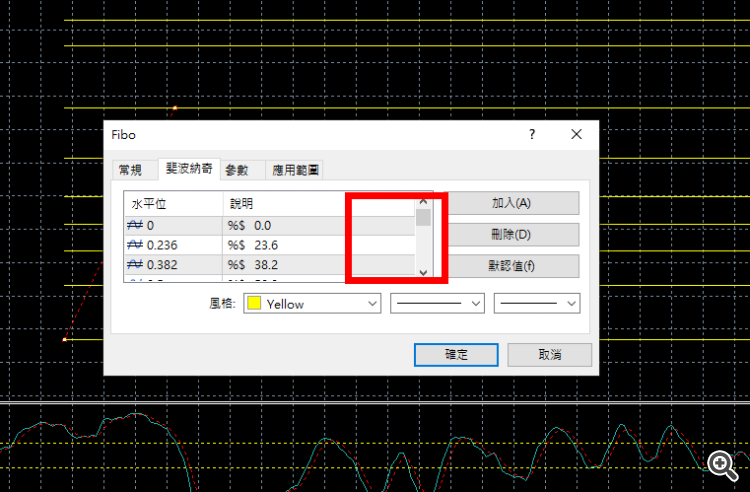
I would like to modify the Fibonacci retracement levels currently provided by MT4.
The requirements are as follows: 1.When modifying the value, I hope to add the function of modifying the color and thickness of the single line in the red box. 2.I hope that when setting the value, I can select a certain range and mark it with different colors, as shown in the blue box.

Yanıtlandı
1
Derecelendirme
Projeler
29
28%
Arabuluculuk
3
0%
/
0%
Süresi dolmuş
1
3%
Meşgul
2
Derecelendirme
Projeler
0
0%
Arabuluculuk
0
Süresi dolmuş
0
Serbest
3
Derecelendirme
Projeler
120
42%
Arabuluculuk
0
Süresi dolmuş
3
3%
Çalışıyor
4
Derecelendirme
Projeler
480
41%
Arabuluculuk
79
11%
/
62%
Süresi dolmuş
77
16%
Çalışıyor
5
Derecelendirme
Projeler
444
35%
Arabuluculuk
2
100%
/
0%
Süresi dolmuş
0
Serbest
Benzer siparişler
hello, I have a VPS with MT5 i want to do a multi-currency backtest i want someone to download (for free) and install historical data for a list of symbols and make my MT5 ready for doing the backtest I know how to use mt5 but i want to save time Reply if you know how to do it and want to do the job thanks
Convert pinescript to MQL5
30 - 50 USD
Hi, I need a developer to convert pinescript to MQL5. The script attached can also have some features removed (highlighted in yellow) you would need to remove all relevant code to those parts. the finished code i will need to test before approving it and I will need the final source code on completion to make further adjustments Please can you let me know if you are able to do this
THE GORILLA MT4/MT5 EA
40+ USD
Buy signal: the main MACD line crosses the signal line upwards (macd_current>signal_current && macd_previous<signal_previous). Sell signal: the main MACD line crosses the signal line downwards (macd_current<signal_current && macd_previous>signal_previous). The below figure shows Buy and Sell cases
Indicator or EA for MT5
30+ USD
EURUSD and AUDUSD broke x day HIGH, but GBPUSD didn't break that x day HIGH. The break should be within one day (today). Like between Market Open and Close. x day is any historical calendar day (Market Open and Close). x day should be any historical previous day. EURUSD and AUDUSD might break x and y day HIGH and GBPUSD didn't. So this is the occurence. x and y are previous days. Hope I could give the logic. It can
Developer to build a simple EA
30+ USD
Hi, Am looking for an expert developer in coding my strategy. Its Multi timeframe strategy, If the conditions of high time frame are true, than on small time frame looking for conditions for entry, On bigbtime frame we are looking for bulish or bearish Fair value gap, and on small timeframe taking trades in the same direction FVG is formed fron 3 candles (if bulish - 1st candle high is lower than 3rd candle low)
Hello there, i need help in coding my strategy. Its Multi timeframe strategy, If the conditions of high time frame are true, than on small time frame looking for conditions for entry, On bigbtime frame we are looking for bulish or bearish Fair value gap, and on small timeframe taking trades in the same direction FVG is formed fron 3 candles (if bulish - 1st candle high is lower than 3rd candle low) opposite for
The Moving Average Cross needs debugging for live chart . [Condition 1] Personalized Omega Trailing Stop Loss ( Details of how it works will be provided , If still necessary the expert where it works just fine will be provided . ) Couple of Input parameters that needs to be removed (previous dev just added ) [ He can be contacted if necessary ]. Following are the implementations required by my expert : 1. Auto Lot
Indicators Used: Volume Indicators: Awesome Oscillator (AO) On-Balance Volume (OBV) Chaikin Money Flow (CMF) Liquidity and Volatility Indicators: Bollinger Bands (BB) Average True Range (ATR) Keltner Channel Key Levels Indicators: Fibonacci Retracement Moving Averages (50-period EMA & 200-period EMA) Momentum Indicator: Relative Strength Index (RSI) Price Action Tool: Horizontal Support and Resistance Levels How
Supertrend X Darvas strategy
30 - 50 USD
Indicator Setup Super Trend : Configure the Super Trend indicator with your chosen period and multiplier settings. Apply a filter to check if the current Super Trend value has held in the same direction for different time period like 15 min, 30 min, 1 hr, 4 hr. This filter will help confirm that the trend direction is stable and less likely to result in whipsaws or false breakouts. Darvas Box : Set the Darvas Box to
Modification on MT4 dashboard
30+ USD
hi, I must finish a mt4 dashboard that have some errors and it is necessary add some features. If you are interested tell me, so I will send the details and the code to verify if are interested
Proje bilgisi
Bütçe
30+ USD
Geliştirici için
27
USD