Bir ticaret robotunun nasıl sipariş edileceğini izleyin
Bir sipariş vermeden veya bir siparişe başvurmadan önce kuralları okuyun
MQL5 ve MQL4'teki bir ticaret robotu nasıl sipariş edilir?
Bir robot sipariş etmek için örnek İş Gerekliliklerine bakın
Kategorideki yeni siparişler:
30 - 40 USD
30 - 40 USD
30 - 40 USD
100 - 200 USD
30+ USD
30 - 79 USD
İş Gereklilikleri
DESCRIPTION
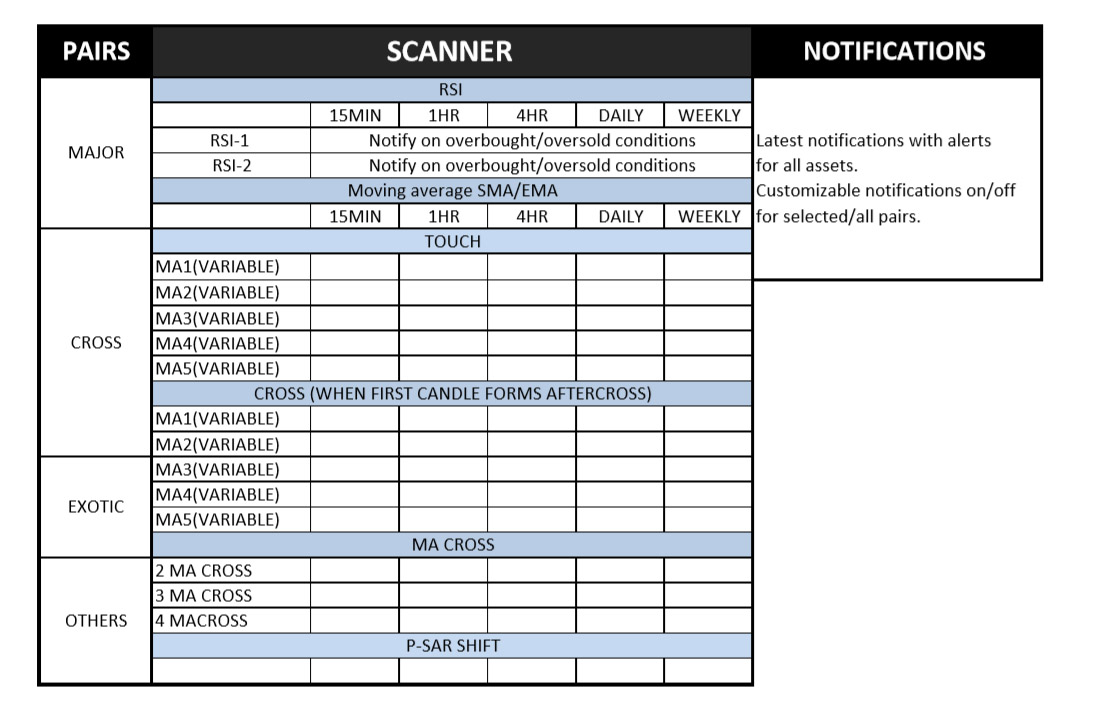
Primarily a scanner, scanning price values with respect to Moving averages/RSI/P-SAR for different
time frames and for different pairs, that can give notifications and alerts under predefined conditions.
The way I see it as:
A tab showing,
PAIRS - that you can select which pairs you want to be active in scanning.(MAJOR/CROSS/EXOTIC/OTHERS)
SCANNER – scanning price values as per MA/RSI/P-SAR on different time frames.
(15MIN/1HR/4HR/DAILY/WEEKLY) - ADJUSTABLE
MOVING AVERAGE SCANNER
MA- Customizable to 5 different values MA1,MA2,MA3,MA4,MA5 with option of selection of type of
MA. SMA/EMA/WMA. . . .with all its in built variables.
The MA Scanner will scan values with respect to 3 criteria.
1.When the value touches the MA.
Showing Red downward arrow when price going down, & green upward arrow when price going up.
2.On formation of first candle completely above or below after the crossing of the moving average.
Showing Red downward arrow when price going down, & green upward arrow when price going up.
3.Oncrossing of MA under 3 conditions A) 2 MA CROSS B) 3MACROSS C) 4MACROSS
Showing Red downward arrow when price going down, & green upward arrow when price going up.
RSI SCANNER
Scanning RSI values for 2 conditions again both values customizable to its in built variables.
Showing over bought conditions with green upward arrows and over sold conditions with red
downward arrow.
P-SAR SCANNER
Showing the shift with the arrow in the opposite direction. Eg. Showing a red downward arrow
indicating a trend shift about to take place from bullish to bearish.
Note:
The tab shows notification for 15 min duration on 15 min time frame/1 hr duration on 1HR
time frame and so on.
The scanner has the option of opening a chart by right click on the indicator when the indicator becomes active.
eg. 1.A 15 min indicator for EUR/USD chowing RSI over bought value allows to opens a 15 min chart for EUR/USD with the RSI indicator below.
2.For MA CROSS of two moving average indication of 1HR time frame allows a 1HR chart with the moving averages shown in the chart.
NOTIFICATIONS & ALERT
Showing latest indication for the active pairs for scanning via alerts/notifications via
telegram/email/SMS. The option of having to switch ON/OFF.
Yanıtlandı
1
Derecelendirme
Projeler
246
45%
Arabuluculuk
42
10%
/
57%
Süresi dolmuş
5
2%
Serbest
2
Derecelendirme
Projeler
125
23%
Arabuluculuk
12
0%
/
75%
Süresi dolmuş
22
18%
Serbest
3
Derecelendirme
Projeler
4
50%
Arabuluculuk
1
100%
/
0%
Süresi dolmuş
2
50%
Serbest
4
Derecelendirme
Projeler
416
38%
Arabuluculuk
86
44%
/
19%
Süresi dolmuş
70
17%
Meşgul
5
Derecelendirme
Projeler
318
35%
Arabuluculuk
64
13%
/
56%
Süresi dolmuş
82
26%
Serbest
6
Derecelendirme
Projeler
395
28%
Arabuluculuk
69
19%
/
49%
Süresi dolmuş
120
30%
Serbest
7
Derecelendirme
Projeler
24
33%
Arabuluculuk
5
20%
/
40%
Süresi dolmuş
8
33%
Serbest
8
Derecelendirme
Projeler
2820
80%
Arabuluculuk
156
22%
/
43%
Süresi dolmuş
488
17%
Serbest
9
Derecelendirme
Projeler
3
33%
Arabuluculuk
1
0%
/
100%
Süresi dolmuş
0
Serbest
10
Derecelendirme
Projeler
167
35%
Arabuluculuk
11
91%
/
0%
Süresi dolmuş
0
Serbest
11
Derecelendirme
Projeler
143
34%
Arabuluculuk
10
10%
/
60%
Süresi dolmuş
26
18%
Serbest
12
Derecelendirme
Projeler
76
33%
Arabuluculuk
9
78%
/
11%
Süresi dolmuş
7
9%
Serbest
13
Derecelendirme
Projeler
134
27%
Arabuluculuk
62
13%
/
53%
Süresi dolmuş
58
43%
Serbest
Benzer siparişler
Hi, I need to automate the supertrend indicator on ctrader with partial tp and sl. I already have a sort of script (without tp and sl) but when I go to compile it gives me an error. would you be able to make it work by adding the partial tp and sl
I need help for my auto trading with Futures using ThinkorSwim platform. I have a thinkscript I use to Buy and Sell futures. Currently I use these scripts and display on the chart (vertical line). Once I see the vertical line on the chart, I do the Buy/Sell. I want to automate this in TOS
I want to create a platform with some features and interface like TradingView ( Quote Your Budget )
100+ USD
3 main issues and features: + The platform uses candlestick data from Oanda Exchange + Features drawing lines and Fibo Retracement + There is a list to manage objects drawn on candlestick charts (Can be divided into groups and has the feature of hiding objects)
EA designer wanted
30+ USD
I would like to find someone who has already created a trading robot before. Im also looking for someone who can creat a bot that goes with time and structure
"I am looking to automate my Delta Divergence trading strategy for NinjaTrader 8. The strategy is thoroughly detailed in the accompanying script, and I need it to be implemented effectively in the platform."
Developer to build a simple EA
30 - 50 USD
Market entries are only performed between the hours of 8pm est to 10pm est At 8pm the very immediate high and low on the 15 min time frame is marked out Price has to break either the high or low before a trade is considered Selling Execution: After crossing the high on the 1 min time frame I’m looking for there to be a market structure shift with displacement (volume) to show price wants to go in the selling
Proje bilgisi
Bütçe
150 - 200 USD
Geliştirici için
135
- 180
USD