Şartname
If I increase this project then I need developers to share more than they can do it and show/point to previous work!!
1. The idea of the trading system is as follows: market entries are performed when ALL (Trend A+B+C) Indicators main and signal lines intersect in the current trend direction. (You need to allow for a +/- input variable to dictate the strength of the trend upside/downside.
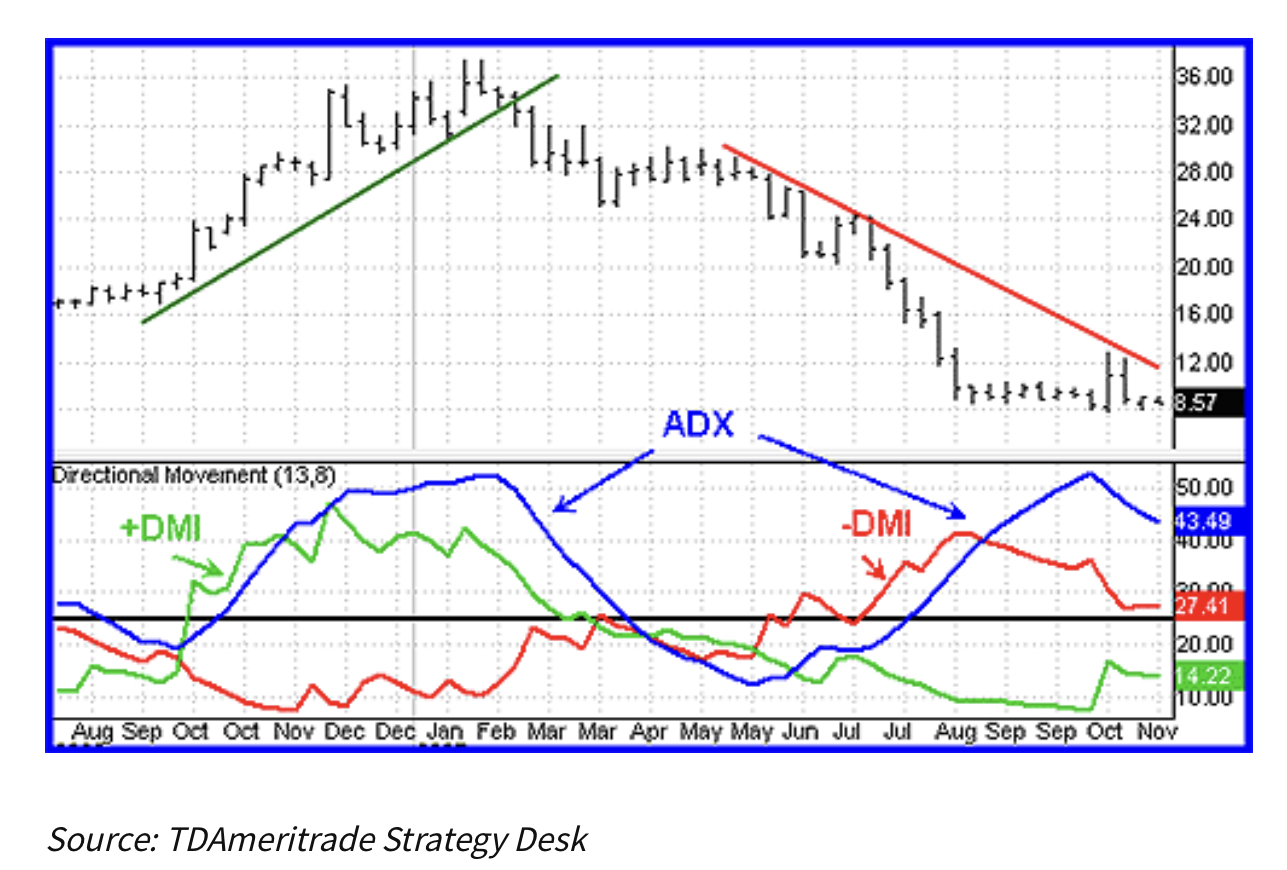
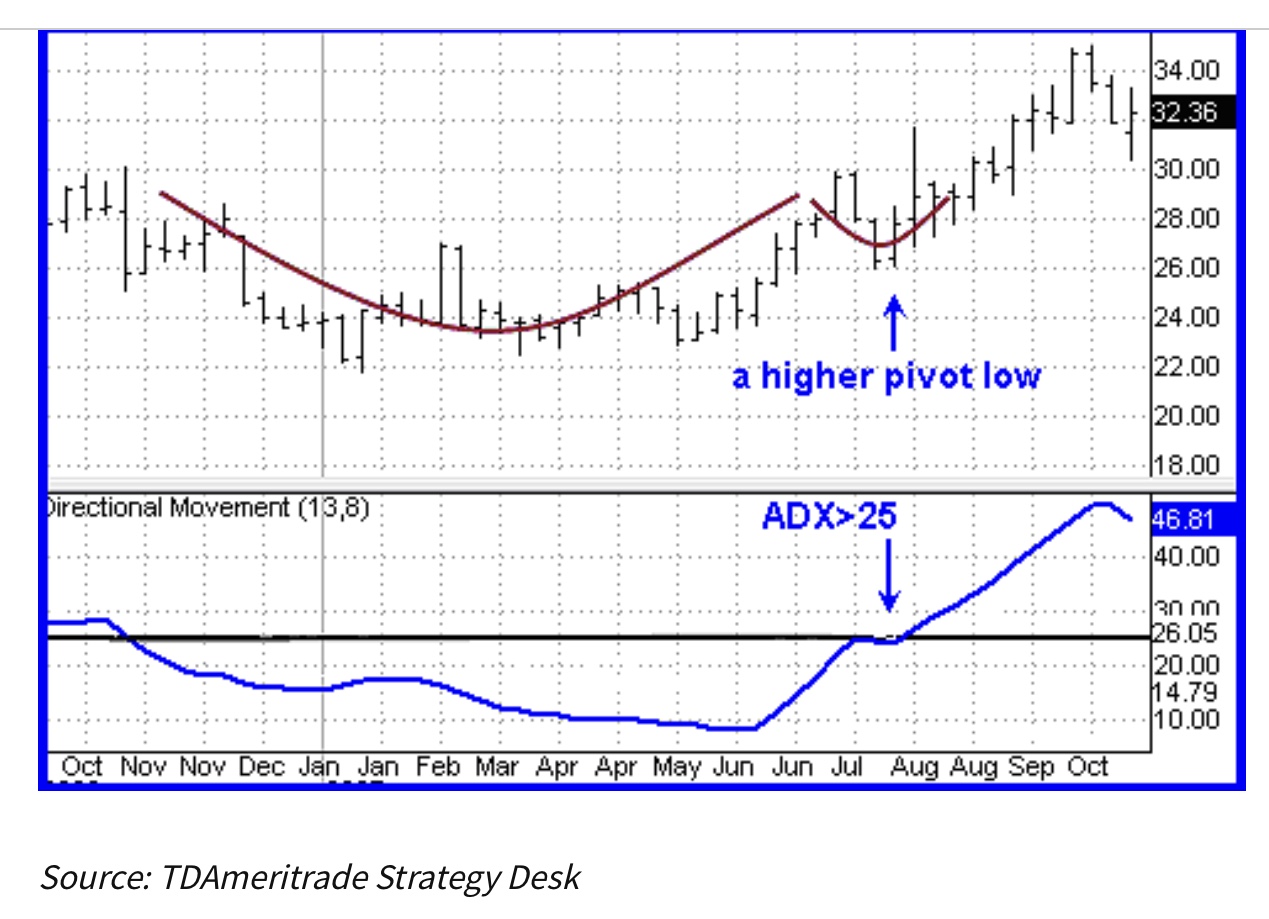
2. Indicator: Trend A is initially determined based on the ADX Trend Indicator with the specified period (14 bars is default) but allow for this value to be changed from 1 bar to 30 bars. If the current ADX value is greater than the previous one, the trend is seen as growing (adx_current>adx_previous). Alternatively, if current ADX is below the previous one, the trend is considered to be falling (adx_curent<adx_previous).ADX Trend Indicator:EUR, GBP, AUD, NZD, USD, CAD, CHF, JPY & allow for more currencies/commodities to be added.
https://www.investopedia.com/articles/trading/07/adx-trend-indicator.asp
When the +DMI is above the -DMI, prices are moving up, and ADX measures the strength of the uptrend. When the -DMI is above the +DMI, prices are moving down, and ADX measures the strength of the downtrend. Figure 1 is an example of an uptrend reversing to a downtrend. Notice how ADX rose during the uptrend, when +DMI was above -DMI. When price reversed, the -DMI crossed above the +DMI, and ADX rose again to measure the strength of the downtrend.
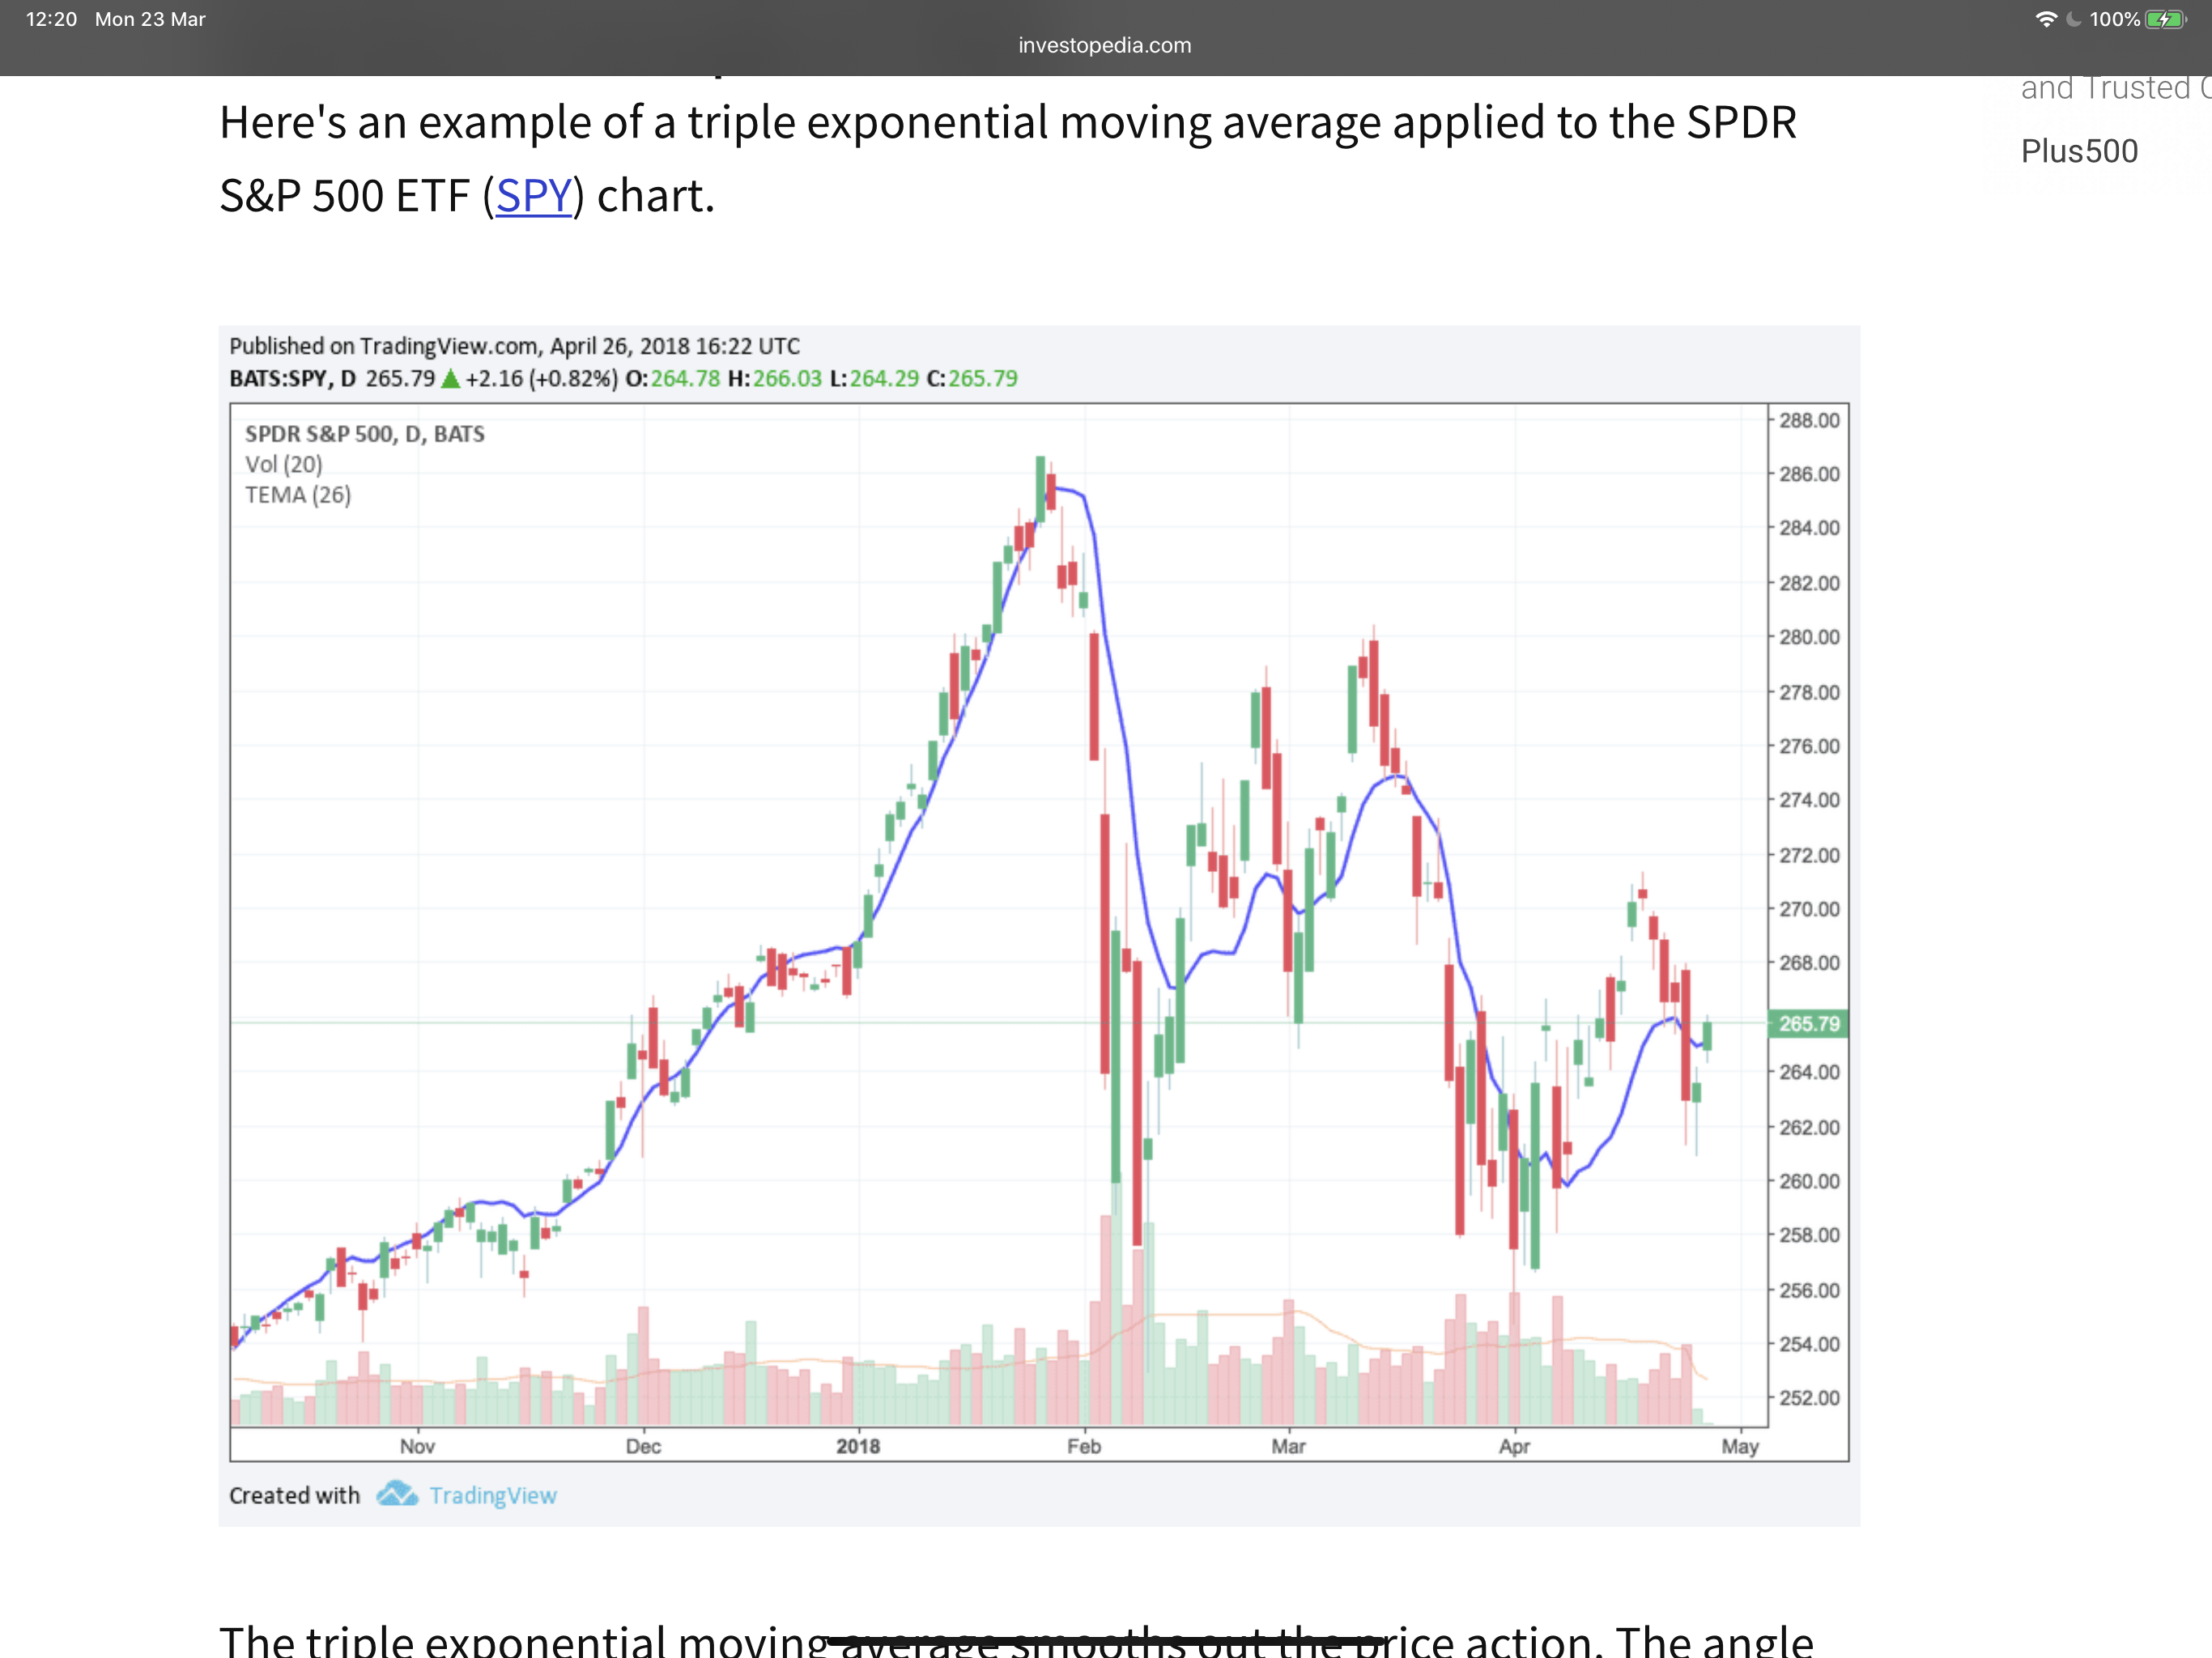
 2.1 Indicator: Trend B is initially determined based on the TEMA (Triple Exponential Moving Average) with the specified period (3x periods) (Period1 is 15bars, Period2 is 15bars (the same) and Period3 is calculated using the formula below but allow for this value to be changed accordingly. Please use the formula that is includedhere. |
https://www.investopedia.com/terms/t/triple-exponential-moving-average.asp
KEY TAKEAWAYS:
- The angle of TEMA can be used to indicate the short-term price direction
- The TEMA formula is complex and actually subtracts out some of the lag
- When the price is above TEMA it helps confirm a price uptrend
- When the price is below TEMA it helps confirm a price downtrend
- When the price crosses down through TEMA that could indicate the price is pulling back or reversing to the downside.
- When the price moves above TEMA, a price rally could be starting
 |
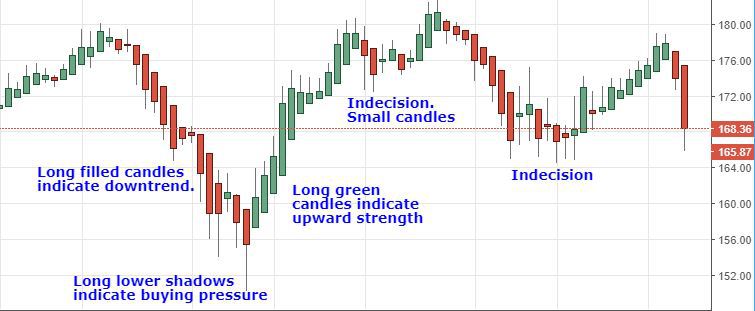
2.2 Indicator: Trend C is initially determined based on theHeiken-Ishiwith the specified period ranging from 1 bar to 90 bars. Lets call the default 15 bars for now. If the current HI value is greater than the previous one, the trend is seen as growing (HI_current>HI_previous). Alternatively, if current HI is below the previous one, the trend is considered to be falling (HI_current<HI_previous).
https://www.investopedia.com/trading/heikin-ashi-better-candlestick/
Putting It to Use
These charts can be applied to any market. Most charting platforms have Heikin-Ashi charts included as an option. There are five primary signals that identify trends and buying opportunities:
- Hollow or green candles with no lower "shadows" indicate a strong uptrend: Let your profits ride!
- Hollow or green candles signify an uptrend: You might want to add to your long position and exit short positions.
- Candles with a small body surrounded by upper and lower shadows indicate a trend change: Risk-loving traders might buy or sell here, while others will wait for confirmation before going long or short.
- Filled or red candles indicate a downtrend: You might want to add to your short position and exit long positions.
- Filled or red candles with no higher shadows identify a strong downtrend: Stay short until there's a change in trend.
- These signals may make locating trends or trading opportunities easier than with traditional candlesticks. The trends are not interrupted by false signals as often and are thus more easily spotted.
3. Buy Trading Signals: Trend A + B + C Indicators must cross their respective signal line upwards. We will call the combined Trend Formula A+B+C = Odyssey for the purpose of this EA ok. (Odyssey_current>signal_current && Odyssey_previous<signal_previous) + (Odyssey_current>signal_current && Odyssey_previous<signal_previous).
ALL 3x Trends (A+B+C) must cross together simultaneously for the buy trade signal. (We are using 3x combined buy trading signals)
4. Sell Trading Signals: Both Trend A+B+C Indicators cross their respective signal line downwards (Odyssey_current<signal_current && Odyssey_previous>signal_previous) + (Odyssey_current<signal_current && Odyssey_previous<signal_previous). Both Trend A+B+C must cross together simultaneously for the sell trade signal. (We are using 3x combined sell trading signals/indicators)
5. Positions are closed at opposite combined signals (Trend A+B+C): Buy positions are closed at Sell signals, and Sell positions are closed at Buy signals
6. Positions are opened at the market price, when a new bar emerges. The Expert Advisor is to be tested using Open prices, so there is no need to add functions for disabling operations inside the bar for now.
7. Additional filters for opening a position:
The absolute value of Odyssey (Combined 3x indicator trends) main line will be used to filter out weak signals: the signal is only confirmed if this value is greater than open_level (in points). Signal confirmation conditions are as follows:
- Confirmation of a buy signal:Abs(Odyssey_current)>open_level
Q. What is Abs?
- Confirmation of a sell signal: Odyssey_current>open_level
7. Additional filters for closing a position:
The absolute value of Odyssey's main line will also be used to confirm position closure: the signal is confirmed if this value is greater than close_level (in points). Close signal confirmation conditions are as follows:
Confirmation to close Buy positions — Odyssey_current>close_level
Confirmation to close Sell positions —Abs(Odyssey_current)>close_level
8. Close by Take Profit — during position opening, a Take Profit level is set at a dynamic fixed distance from the open price, specified in points. The value is set in the InpTakeProfit input parameter. Point values to include are: 0.01 – 5. Default value set to: 0.1. All scenarios must be available for back-testing inc. Trend A/B/C. I need to establish the best options available based on the Trend Indicators provided.
In an ideal world I would prefer to take a min. $ profit amount per trade (versus point profit, can we do this?) which I would like added as a input parameter value i.e $5-100 USD. The GOAL is to generate a net profit per trade/s that equates to $50+. Collectively i.e. every X mins or $X per hour.
I want this EA to be a compoundable algorithm that has risk in-place and maximum upside.
Risk is set aside from: 10% to 40% with matching periods shown above. I want to see ALL scenarios so that WE can the best trading options available etc.
9. Position management
Dynamic TrailngStop is used to protect profit. Stop Loss is set if profit in points exceeds the value specified in the InpTrailingStop parameter. If the price continues to move in the profit direction, Stop Loss should be trailed at the given distance. Allow trail to vary from 0.001 to 1 point. The stop loss maximises ALL profit whether buy/sell order.
Stop Loss cannot be moved towards the loss direction, i.e. the Stop Loss value cannot be increased. If none of protective orders (Take Profit or Stop Loss) triggers, the position should be closed by an opposite signal. No other position exit methods are available.
Trading idea
If ALL 3x trends (above) demonstrate + or – trend (In-Order i.e. Trend A, B, C) then WE buy/sell based on the collective trend that has been identified allowing for multiple data input scenarios OR just default giving us access to ALL backtesting output scenarios. The idealistic Goal is to generate the following returns scored as a percentage within the EA report:
- 95+%, 90-95%, 85-90% & 80-85%
I only want to see actionable trades that deliver 80%+ success based on the 3x indicators (Odyssey) and I am open to how often these trades occur across multiple currencies or commodities etc ok.