İş tamamlandı
İş Gereklilikleri
Hello! This indicator may seem simple however it is the culmination of almost 13 years of trading experience. I have yet to find anyone who understands what I’m doing. This indicator is the first step in making an EA based on this indicator.
We are all familiar with the a moving average cross. However this indicator is designed to identify and give a “long” or “short” alert for when some additional criteria are met. Indicator must give signal when all of these specific criteria are met:
RULE 1. THERE IS A NEW EMA CROSS (BOTH LONG OR SHORT)
AND
RULE 2. A CANDLE OPENS AND CLOSES ABOVE (or below if short period EMA crosses below longer period EMA) THE **** MARKET PRICE LEVEL**** OF THE PREVIOUS EMA CROSS ——- indicator will not so anything until both rule 1 and 2 are met.
This indicator is simply designed to help identify trends and to help weed out false reversals. The candle “opening and closing” above or below a support or resistance level may seem like a trivial thing but this is an absolute must for this indicator.
VERY important to note that when I say “MARKET PRICE LEVEL OF PREVIOUS CROSS” here is what I mean: you can look at the chart and see the red 50 period and green100 period EMA lines cross and you could draw a horizontal line exactly where those two colors meet - this is NOT what I am after - what I mean by market price level is identifying where the to “colored ema lines meet” then identifying the specific price/candle at that EMA cross. If this is not clear then I can easily make a video of what I mean but this is CRUCIAL to understand for the making of this indicator.
It is also important for the indicator to perform in this particular order:
1. Identify new EMA cross. Indicator will not do anything else until this happens.
2. Look back to identify previous EMA cross price level. If we could have the indicator draw a horizontal trend line each time this occurs that would be great. (So perhaps we will need to program a way to always save and record the previous price level?)
3. Draw arrow in appropriate direction after a candle opens and closes above or below the level identified in step 2 above.
4. Once there has been one open and close candle below or above a level, no new arrow/alert will be given until there is a new EMA CROSS
I know there are several different ways to calculate EMA so I am open to suggestions that would work well with this indicator.
Additionally, I am open to input from the developer on any other recommendations that would assist in the robustness of this indicator (I know we will run into scenarios in which we may want to include some filters when the two EMA’s are very close to each other and perhaps bouncing between long and short very quickly). Over all t is essential that this indicator is perfect because it is the main building block for my EA - which will be based on this indicator applied to multiple time frames.
I plan on back testing in MT5 however I’d like to have the code in python as well because it seems like I will be good to be able to import the indicator into other software. THANKS
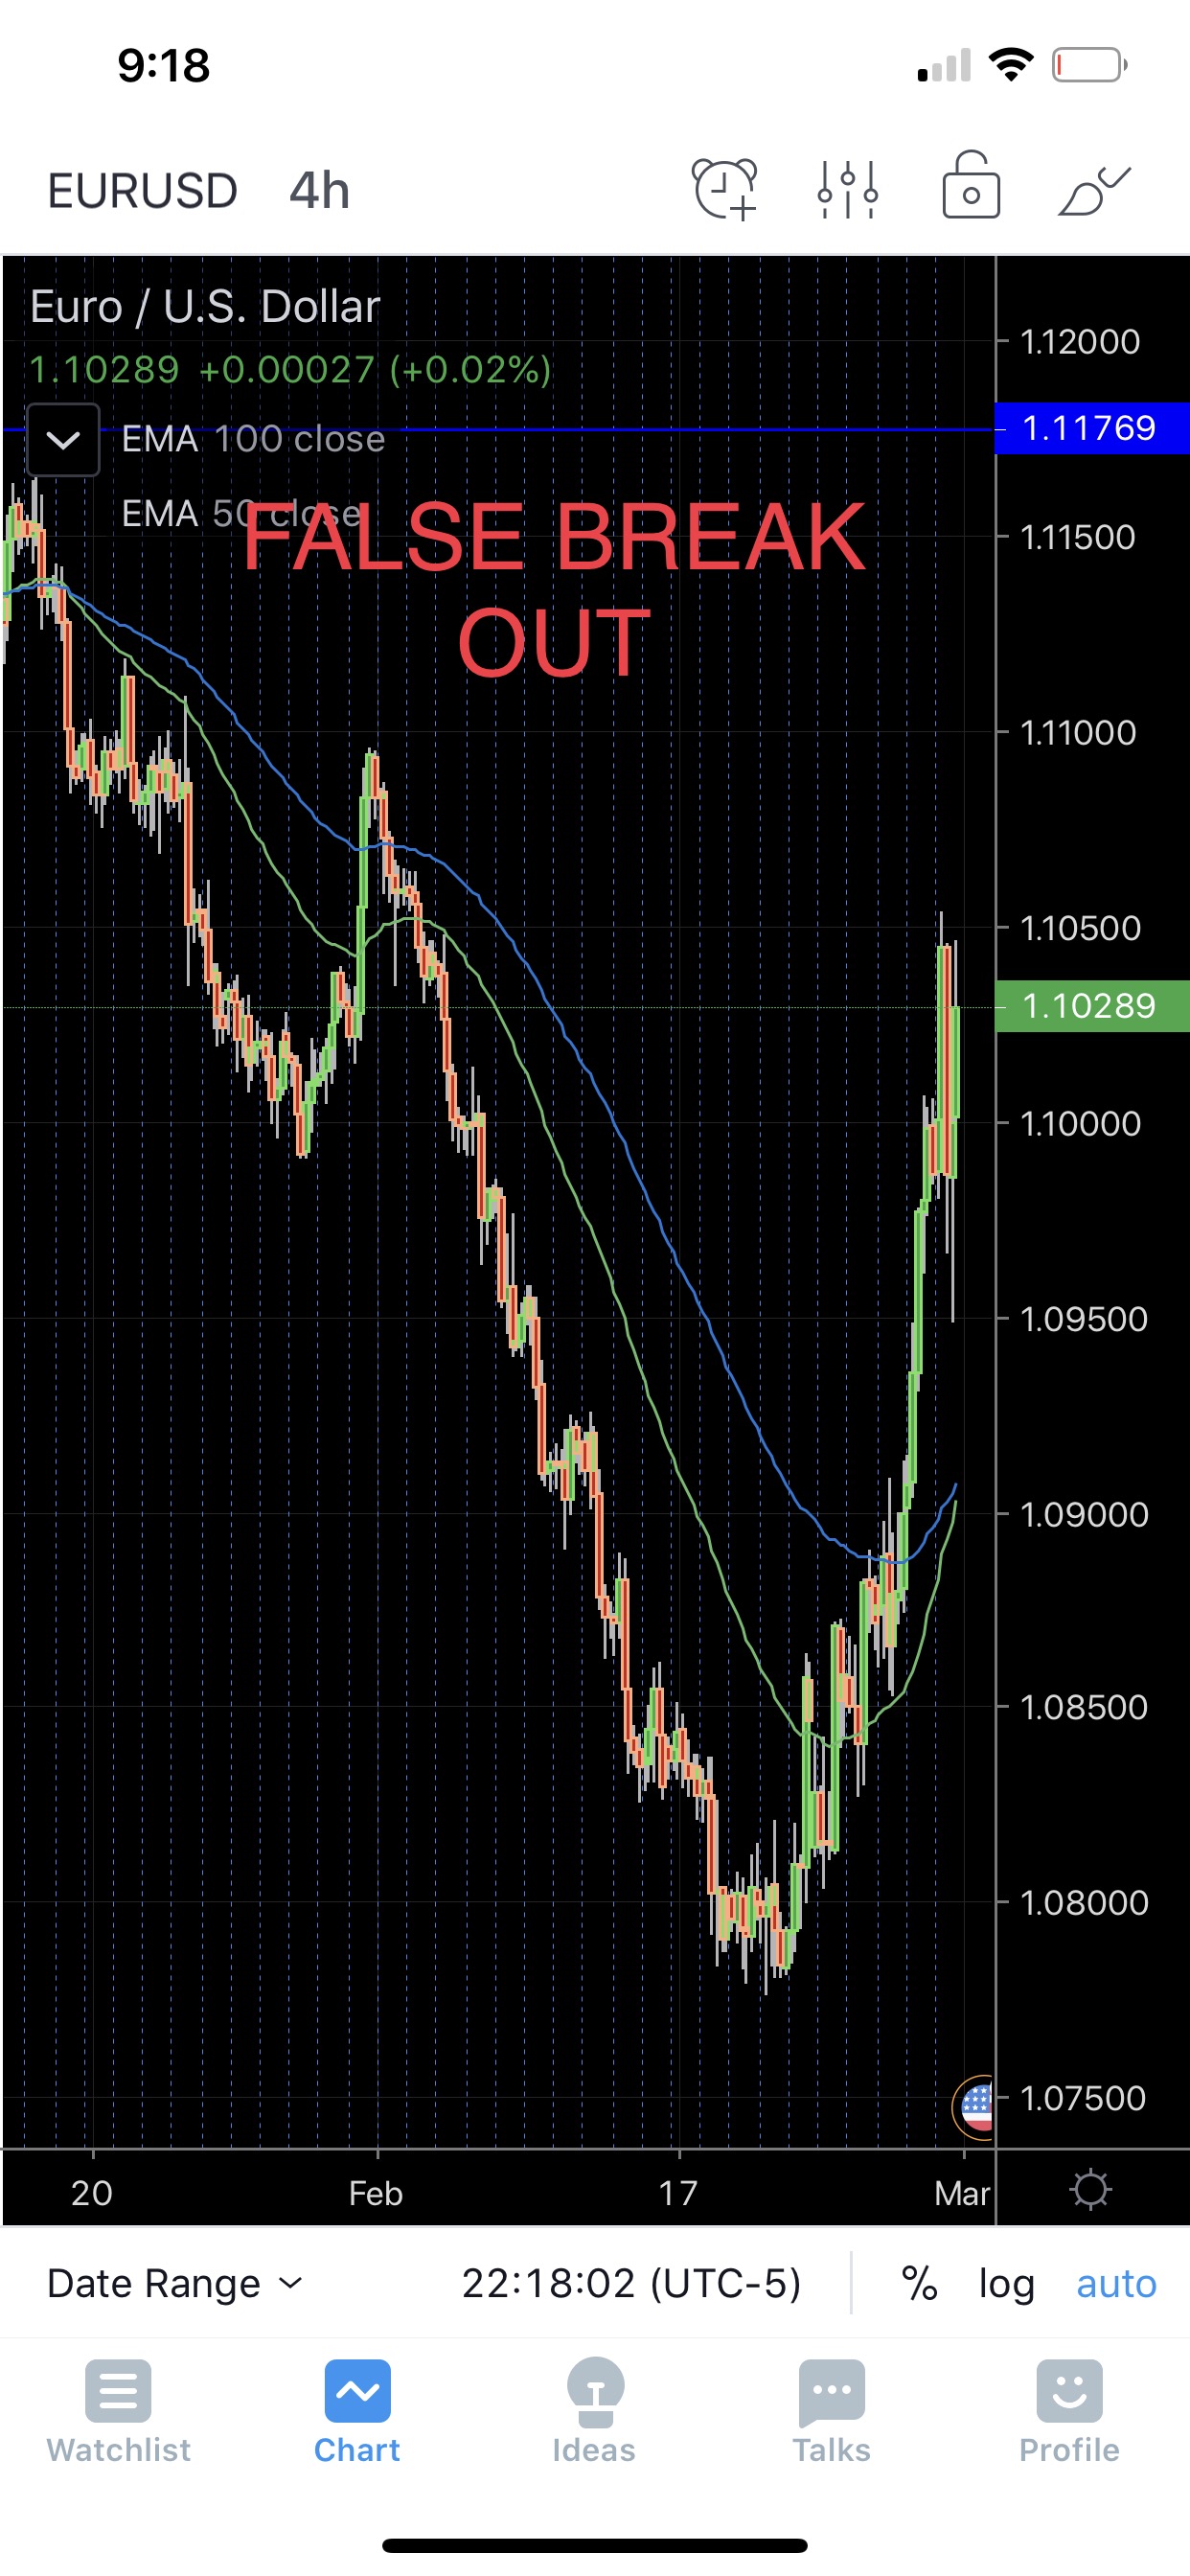
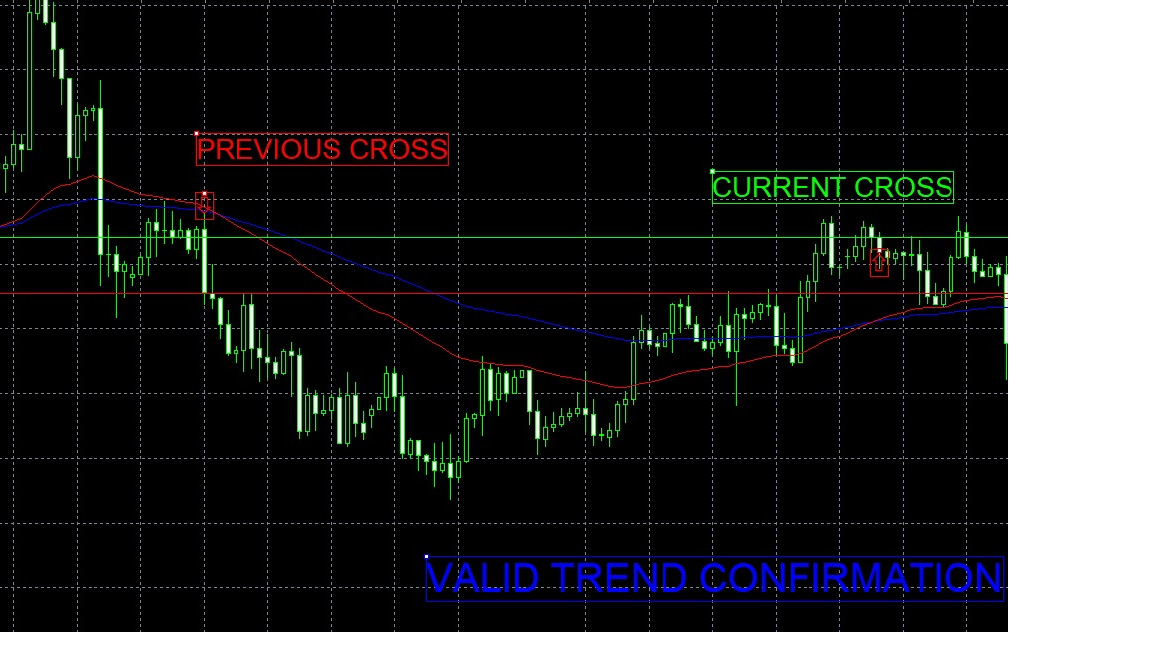
******* EXPLANATIONS OF PHOTOS:
- For photos labeled “Valid trend confirmation”: this is an example of a scenario in which the indicator would produce a long signal.
- For photo labeled “false break out”: the green EMA has ALMOST crossed above the blue but for the sake of example we will pretend that it has fully crossed above the blue. In which case this would be a NEW EMA cross however a candle has not yet opened and closed above the price level of the previous/opposite downward green below blue EMA cross. So this is an example of a false break out and the indicator would NOT give a signal.