Fan sayfamıza katılın
Öyleyse bir link gönderin -
başkalarının da faydalanmasını sağlayın
- Görüntülemeler:
- 22987
- Derecelendirme:
- Yayınlandı:
- 2010.09.01 08:25
- Güncellendi:
- 2016.11.22 07:32
-
Bu koda dayalı bir robota veya göstergeye mi ihtiyacınız var? Freelance üzerinden sipariş edin Freelance'e git
Author:
Kevin Kurka, Kurkafund.com
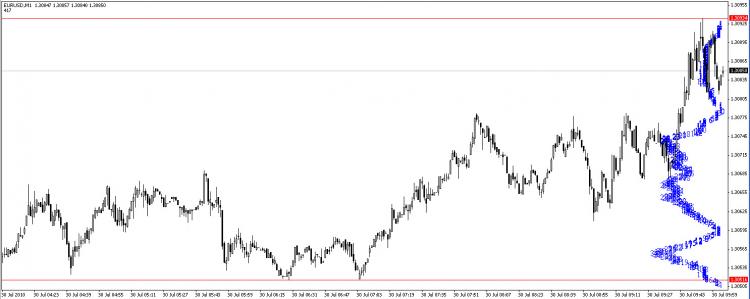
Numeric representation of how many times each price occurred during a given period. Prints the number of occurrences at each price level within the given time.
Recommendations:
- Use it in an EA to determine support and resistance levels
- Can be used for weighted Mean revisions.
 Stop Hunter
This EA is based on the strategy "Stop Hunting with the Big Players". It sends BuyStop and SellStop orders at near distance from the round price targets.
 Doji Hunter
This indicator is a spin off of the Doji Reader 2 found in the code base. I have made several changes such as it is now capable of being used in code for coding use, not just as a visual indicator. I also took out several un-needed code that was redunda
 Symbols.mqh
Retrieve a list of all Symbols/Instruments known to the Server with MarketInfo output to a CSV file
 TrailingStopFrCnSAR
The script can apply the trailing function based on the portfolio profits, i.e. Stop Levels can be set upon reaching the total breakeven level of all the orders in the selected direction.
