Fan sayfamıza katılın
Öyleyse bir link gönderin -
başkalarının da faydalanmasını sağlayın
- Yayınlayan:
- okh
- Görüntülemeler:
- 261
- Derecelendirme:
- Yayınlandı:
-
Bu koda dayalı bir robota veya göstergeye mi ihtiyacınız var? Freelance üzerinden sipariş edin Freelance'e git
Pivot Noktaları ticaret için her zaman çok faydalıdır, bu, piyasanın gün içinde nereye gittiğine dair bir fikir edinmenin basit bir yoludur.
Gösterge ayrıca ilk üç destek ve direnci de sağlar.
Kullandığım formüller şunlardır:
Resistance 3 = High + 2*(Pivot - Low)
Resistance 2 = Pivot + (R1 - S1)
Resistance 1 = 2 * Pivot - Low
Pivot Point = ( High + Close + Low )/3
Support 1 = 2 * Pivot - High
Support 2 = Pivot - (R1 - S1)
Support 3 = Low - 2*(High - Pivot)
Bir önceki günün çubuğundaki verileri kullanır.

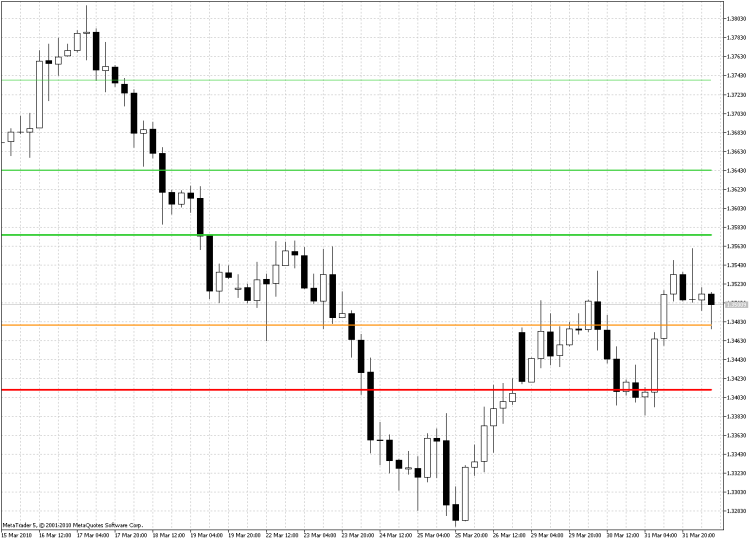
Turuncu çizgi günün pivot noktasıdır, kırmızı çizgiler desteklerdir ve yeşil çizgiler dirençlerdir.
MetaQuotes Ltd tarafından İngilizceden çevrilmiştir.
Orijinal kod: https://www.mql5.com/en/code/95
 AdoSuite v 1.0
ODBC ve OLE DB arayüzleri aracılığıyla veritabanlarıyla çalışmak için bir dizi sınıf.
 FVG based Momentum Detection
Bu, momentum veya trend gücünü tespit etmek için girilen "window_size" içindeki FVG'leri değerlendiren bir göstergedir.
 Renkli parabolik 2
Parabolik temanın devamı. Şimdi hızlanma faktörüne bağlı olarak renkleri var.
 Trend Zigzag (on ma cross)
Hareketli bir ortalama geçişinin kesişim noktalarını birbirine bağlayan statik bir zikzak