Fan sayfamıza katılın
Öyleyse bir link gönderin -
başkalarının da faydalanmasını sağlayın
- Görüntülemeler:
- 26204
- Derecelendirme:
- Yayınlandı:
- 2009.12.08 10:16
- Güncellendi:
- 2016.11.22 07:32
-
Bu koda dayalı bir robota veya göstergeye mi ihtiyacınız var? Freelance üzerinden sipariş edin Freelance'e git
Description:
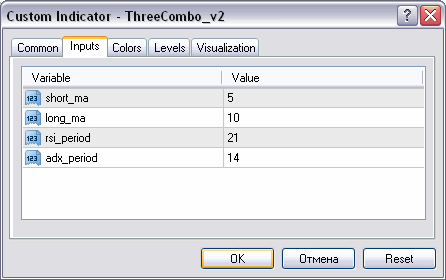
Three combo uses ema 5 and 10, rsi 21 and adx 14 to give you buy or sell signals.
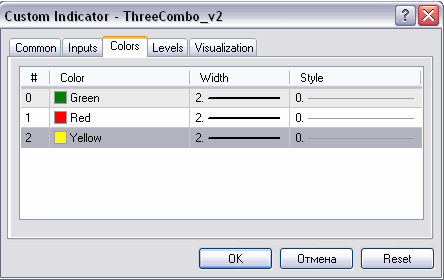
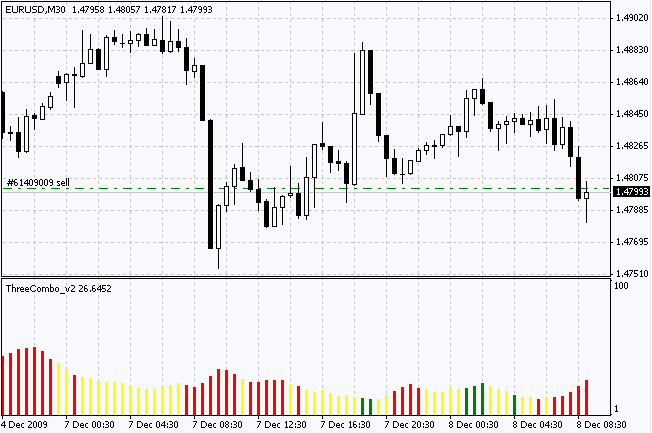
When the three indicators give the same signal then the histogram will turn green for buy, or red for sell.
Yellow means that the three indicators have not agreed on a position yet.
The values of the the rsi, adx and ema can be changed to whatever you feel comfortable with. The height of the histogram is tied to the main adx line.

Input parameters

Color settings

 Auto-Fibonacci
Create a Fibonacci retracement object automatically on your graph.
 Jays Candle Display
Jays candle display is a multi candle displaying indicator. It displays the swing and body of candles on different timeframes from one minute up to one day.
 Trader Script 1
It's easy to use, just input your lotsize, stoploss and take profit values (in points) and trade.
 ReverseSymbol
It allows to work with reversed symbols (for example USDGBP)