Alım-satım robotlarını ücretsiz olarak nasıl indirebileceğinizi izleyin
Bizi Twitter üzerinde bulun!
Fan sayfamıza katılın
Fan sayfamıza katılın
Komut dosyasını ilginç mi buldunuz?
Öyleyse bir link gönderin -
başkalarının da faydalanmasını sağlayın
Öyleyse bir link gönderin -
başkalarının da faydalanmasını sağlayın
Komut dosyasını beğendiniz mi? MetaTrader 5 terminalinde deneyin
- Görüntülemeler:
- 9304
- Derecelendirme:
- Yayınlandı:
- 2009.07.26 08:07
- Güncellendi:
- 2016.04.05 08:31
-
Bu koda dayalı bir robota veya göstergeye mi ihtiyacınız var? Freelance üzerinden sipariş edin Freelance'e git
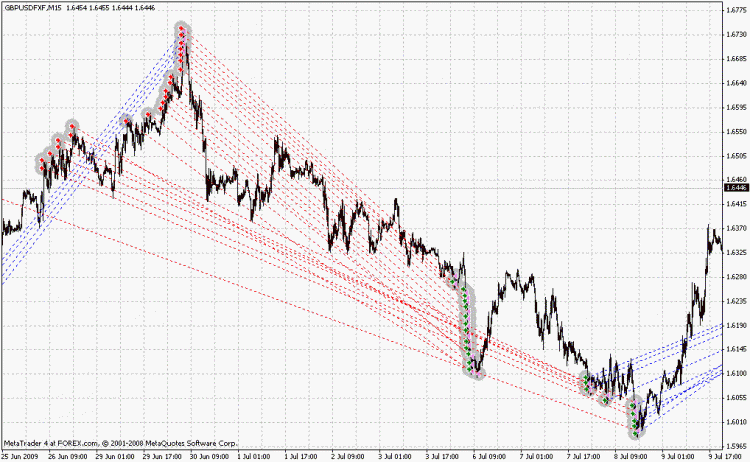
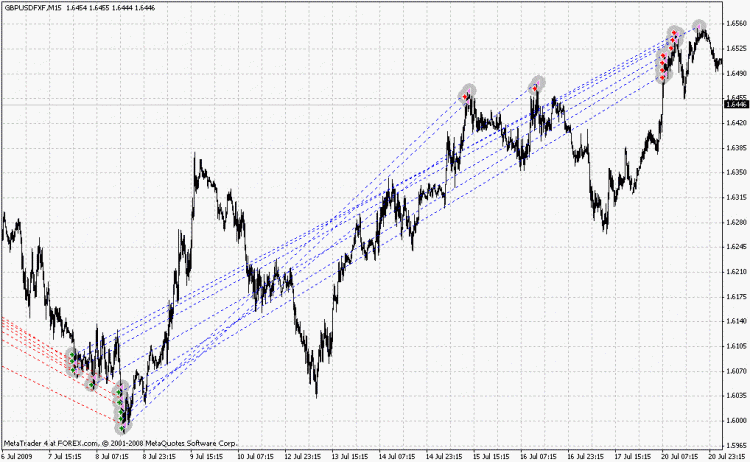
Strategy Tester Report
exp_Amstell-SL
Forex.com-Demo(R) (Build 220)
| Symbol | GBPUSDFXF (Great Britan Pound vs US Dollar) | ||||
| Period | 15 Minutes (M15) 2009.06.25 00:00 - 2009.07.23 00:00 (2009.06.25 - 2009.07.23) | ||||
| Model | Control points (a very crude method, the results must not be considered) | ||||
| Parameters | TakeProfit=460; StopLoss=610; Lots=0.1; | ||||
| Bars in test | 2072 | Ticks modeled | 55645 | Modeling quality | n/a |
| Mismatched chart errors | 28 | ||||
| Initial deposit | 10000.00 | ||||
| Total net profit | 21400.40 | Gross profit | 21454.40 | Gross loss | -54.00 |
| Profit factor | 397.30 | Expected payoff | 297.23 | ||
| Absolute drawdown | 1008.00 | Maximum drawdown | 11099.20 (39.30%) | Relative drawdown | 39.30% (11099.20) |
| Total trades | 72 | Short positions (won %) | 34 (94.12%) | Long positions (won %) | 38 (100.00%) |
| Profit trades (% of total) | 70 (97.22%) | Loss trades (% of total) | 2 (2.78%) | ||
| Largest | profit trade | 468.20 | loss trade | -33.50 | |
| Average | profit trade | 306.49 | loss trade | -27.00 | |
| Maximum | consecutive wins (profit in money) | 69 (21442.90) | consecutive losses (loss in money) | 2 (-54.00) | |
| Maximal | consecutive profit (count of wins) | 21442.90 (69) | consecutive loss (count of losses) | -54.00 (2) | |
| Average | consecutive wins | 35 | consecutive losses | 2 | |
MetaQuotes Ltd tarafından Rusçadan çevrilmiştir.
Orijinal kod: https://www.mql5.com/ru/code/9073
 Pretty T3
Colorfull T3 MA
 RSI_Strike(AM)_SW / Stoch_Strike(AM)_SW
MACD (настройки по умолчанию - АО Вильямса) с сигналами импульса от пересечений разнопериодных RSI / направления Стохастика.
 wajdyss_RSI_O_L_H_C_Indicator_V2
This indicator To show the numerical values of RSI (Open , Close , High , Low)
 wajdyss_FIBO_S_Indicator_V1
This indicator for draw an Arrows for buy & sell, it's Depends on FIBO S Indicator


