Fan sayfamıza katılın
Öyleyse bir link gönderin -
başkalarının da faydalanmasını sağlayın
- Yayınlayan:
- Nikolay Kositsin
- Görüntülemeler:
- 34756
- Derecelendirme:
- Yayınlandı:
- 2012.01.10 15:20
- Güncellendi:
- 2023.03.29 13:43
-
Bu koda dayalı bir robota veya göstergeye mi ihtiyacınız var? Freelance üzerinden sipariş edin Freelance'e git
Real author:
LeMan
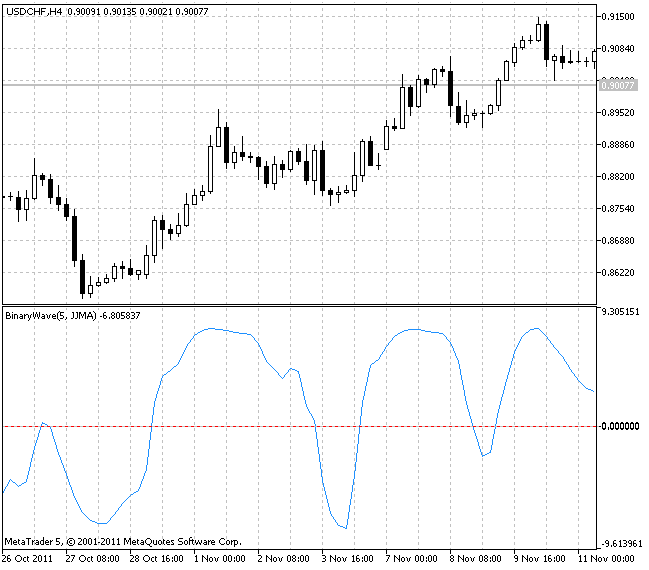
The Binary Wave returns a positive or a negative value depending on the indicator readings' bullish or bearish forecasts. The real strength of binary waves can be seen when several binary waves are combined into composite binary waves.
I have gathered seven individual binary waves into a composite one:
- a close price relative to its moving average (above - below);
- MACD slope;
- OsM crossing with the zero line;
- CCI crossing the zero line;
- Momentum crossing the level 100;
- RSI crossing the level 50;
- DMI+ and DMI- position relative to each other (ADX).
When you create a composite wave, it is important to test the individual binary waves first to check their validity. A good binary composite wave will show the results superior to the results generated by the individual binary waves included into it. Any of the above mentioned waves can be excluded from the composite wave by assigning it a weight (Weight parameter) equal to zero. This allows you to check the validity of individual waves.
Interpretation of the binary waves is fairly obvious: higher values indicate a bullish trend, while lower values - a bearish one. Composite binary wave values depend on the number of individual binary waves included in it. You can "weigh" binary waves readings depending on the quality of their predictive ability by assigning the value to the corresponding Weight parameter. For example, one component of a binary composite wave can have a value of 5, while another one can be equal to 0.75. Wave maximum total weight is shown in parentheses after the indicator name in the upper left corner of the indicator area.
You can smooth a binary wave by setting bLength parameter greater than one.
I think you can easily understand the principle of the indicator operation and may use it to create high-quality filters for your trading systems.
This indicator allows to select a smoothing type out of ten possible versions:
- SMA - simple moving average;
- EMA - exponential moving average;
- SMMA - smoothed moving average;
- LWMA - linear weighted moving average;
- JJMA - JMA adaptive average;
- JurX - ultralinear smoothing;
- ParMA - parabolic smoothing;
- T3 - Tillson's multiple exponential smoothing;
- VIDYA - smoothing with the use of Tushar Chande's algorithm;
- AMA - smoothing with the use of Perry Kaufman's algorithm.
It should be noted that Phase type parameters for different smoothing algorithms have completely different meaning. For JMA it is an external Phase variable changing from -100 to +100. For T3 it is a smoothing ratio multiplied by 100 for better visualization, for VIDYA it is a CMO oscillator period and for AMA it is a slow EMA period. In other algorithms these parameters do not affect smoothing. For AMA fast EMA period is a fixed value and is equal to 2 by default. The ratio of raising to the power is also equal to 2 for AMA.
The indicator uses SmoothAlgorithms.mqh library classes (must be copied to the terminal_data_folder\MQL5\Include). The use of the classes was thoroughly described in the article "Averaging Price Series for Intermediate Calculations Without Using Additional Buffers".
This indicator was first implemented in MQL4 and published in CodeBase 21.08.2009.

Indicator input parameters:
//+-----------------------------------+
//|  Indicator input parameters       |
//+-----------------------------------+
//--- indicators weight. The indicator does not take part in the wave calculation in case of a zero value
input double WeightMA    = 1.0;
input double WeightMACD  = 1.0;
input double WeightOsMA  = 1.0;
input double WeightCCI   = 1.0;
input double WeightMOM   = 1.0;
input double WeightRSI   = 1.0;
input double WeightADX   = 1.0;
//---- Moving Average parameters
input int   MAPeriod=13;
input  ENUM_MA_METHOD   MAType=MODE_EMA;
input ENUM_APPLIED_PRICE   MAPrice=PRICE_CLOSE;
//---- MACD parameters
input int   FastMACD     = 12;
input int   SlowMACD     = 26;
input int   SignalMACD   = 9;
input ENUM_APPLIED_PRICE   PriceMACD=PRICE_CLOSE;
//---- OsMA parameters
input int   FastPeriod   = 12;
input int   SlowPeriod   = 26;
input int   SignalPeriod = 9;
input ENUM_APPLIED_PRICE   OsMAPrice=PRICE_CLOSE;
//---- CCI parameters
input int   CCIPeriod=14;
input ENUM_APPLIED_PRICE   CCIPrice=PRICE_MEDIAN;
//---- Momentum parameters
input int   MOMPeriod=14;
input ENUM_APPLIED_PRICE   MOMPrice=PRICE_CLOSE;
//---- RSI parameters
input int   RSIPeriod=14;
input ENUM_APPLIED_PRICE   RSIPrice=PRICE_CLOSE;
//---- ADX parameters
input int   ADXPeriod=14;
//---- including wave smoothing
input int MovWavePer     = 1;
input int MovWaveType    = 0;
input Smooth_Method bMA_Method=MODE_JJMA;// Smoothing method
input int bLength=5;                     // Smoothing depth
input int bPhase=100;                    // Smoothing parameter
MetaQuotes Ltd tarafından Rusçadan çevrilmiştir.
Orijinal kod: https://www.mql5.com/ru/code/679
 ASCtrend_HTF_Signal
ASCtrend_HTF_Signal shows a trend direction or a signal for performing a deal generated by ASCtrend indicator as a graphic object with colored trend indication or deal direction.
 IncSAROnArray
CSAROnArray class is designed for calculation of SAR (Parabolic SAR) values on indicator buffers. The example of use of the CSAROnArray class is presented.
 IncMomentumOnArray
CMomentumOnArray class is designed for calculation of Momentum values on indicator buffers. Test_MomentumOnArray indicator is provided as the example of the class use.
 Parabolic_HTF_Signal
Parabolic_HTF_Signal shows a trend direction or a signal for performing a deal generated by Color_Parabolic indicator at the chosen bar as a graphic object with colored trend indication or deal direction and sends alerts or audio signals in case of a market entry moment.