Fan sayfamıza katılın
Öyleyse bir link gönderin -
başkalarının da faydalanmasını sağlayın
- Görüntülemeler:
- 4201
- Derecelendirme:
- Yayınlandı:
- 2011.12.14 12:30
- Güncellendi:
- 2016.11.22 07:32
-
Bu koda dayalı bir robota veya göstergeye mi ihtiyacınız var? Freelance üzerinden sipariş edin Freelance'e git
CMAOnArray class is designed for Moving Average calculation on indicator buffer's data.
Usage:
Init() method with the following parameters is called in the OnInit() function of the indicator:
- int aMAPeriod - MA period.
- ENUM_MA_METHOD aMAMethod - МА calculation method.
Solve() method with the following parameters is called in the OnCalculate() function of the indicator:
- const int aRatesTotal - rates_total variable from the OnCalculate() function parameters;
- const int aPrevCalc - prev_calculated variable from the OnCalculate() function parameters;
- double aData[] - buffer with the data, according to which MA is calculated;
- double aMA[] - the buffer with calculated МА.
- int BarsRequired() - returns the minimal number of bars necessary for calculation;
- string Name() - returns the line with the indicator name;
- string NameMethod() - returns the line with the name of the used smoothing method.
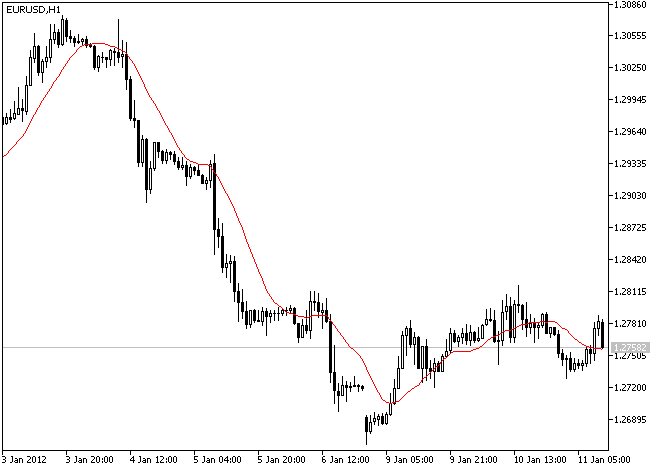
Test_MAOnArray.mq5 is a sample indicator showing CMAOnArray class application. IncMAOnArray file must be located in MQL5\Include\IncOnArray of the terminal data folder (IncOnArray folder must be created).
The Moving Average Technical Indicator shows the mean instrument price value for a certain period of time. When one calculates the moving average, one averages out the instrument price for this time period. As the price changes, its moving average either increases, or decreases.

MetaQuotes Ltd tarafından Rusçadan çevrilmiştir.
Orijinal kod: https://www.mql5.com/ru/code/623
 VGridLine Monthly
Vertical time grid with one month step.
 JFatl HTF Baby
The hybrid of digital and analog filters that displays larger timeframe values at a smaller one in a minimized way.
 Multi RSI
Eight RSI (Relative Strength Index) technical indicators in one chart.
 VGridLine Weekly
Vertical time grid with one week step.
