Fan sayfamıza katılın
Öyleyse bir link gönderin -
başkalarının da faydalanmasını sağlayın
- Görüntülemeler:
- 5165
- Derecelendirme:
- Yayınlandı:
- 2024.11.08 20:25
- Güncellendi:
- 2024.12.24 19:01
-
Bu koda dayalı bir robota veya göstergeye mi ihtiyacınız var? Freelance üzerinden sipariş edin Freelance'e git
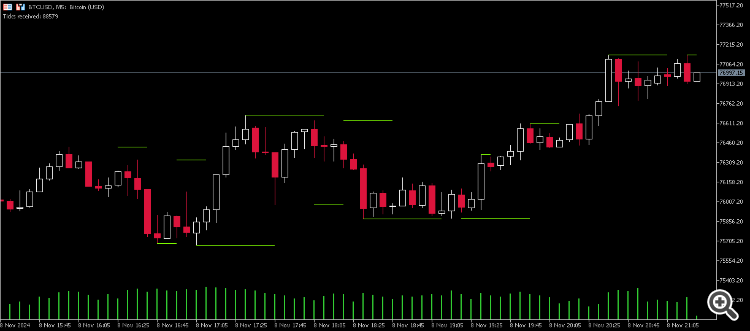
An indicator to mark extremums with lines. A period input is used to determine highest highs and lowest lows for that period. In this indicator, it's not only highs and lows (OHLC) which are used in the analysis, but also bid and ask prices from each bar. A lookback figure is used to limit the processing to a specific number of bars.
Another feature in this indicator is to not paint on break of structure areas (breaking of the current perceived higher high or lower low) by forcing sections of the lines to vanish during those periods. This way it will only display lines on actual support and resistance areas. That feature is controlled by an input, so if you prefer, it will display lines on the extreme prices as well as display sloping of the lines when the market is trending up or down.
----------------------------------------------------
What's new in version 2.0
- It uses an optimization where only the ticks from the current bar will be accounted for, and this will mean that the indicator can run seamlessly on higher timeframes
- Removed unneeded buffers
 Hammer Indicator
The code above is a "Hammer" indicator that detects candlestick hammer formations (bullish and bearish) and inverted hammer formations (bullish and bearish) on a MetaTrader 5 chart. This indicator identifies price reversal patterns by calculating the size and ratio of the candlestick wicks based on adjustable parameters: MaxRatioShortWick, MinRatioLongWick, and MinCandleSize. When a pattern is detected, the indicator displays a colored arrow near the candle’s lowest or highest price according to the pattern’s direction. The code also includes functions to create and delete objects automatically when the indicator is initialized or stopped.
 Day Of Week, Week Of Year and other marks in Data Window and on chart
WeekDays indicator displays Day Of Week, Week Of Year, Day Of Year or Bar Index in the Data Window, and optionally in labels on the chart.
 Economic Calendar Monitor and Cache for Backtesting on History
This indicator displays current events on the chart and allows you to export the calendar to archives for backtesting, automatically fixing time discrepancies between the history of bars and the history of events. This is an improved version of CalendarMonitorCached indicator from the algotrading book.
 simple mt5 trade copier
this is a copier template
