Fan sayfamıza katılın
Öyleyse bir link gönderin -
başkalarının da faydalanmasını sağlayın

Bounce Number for Grid/Martingale strategies Lot Sizing/Order Count set - MetaTrader 4 için Uzman Danışman
- Görüntülemeler:
- 8709
- Derecelendirme:
- Yayınlandı:
- 2024.01.11 15:56
- Güncellendi:
- 2024.01.19 10:36
-
Bu koda dayalı bir robota veya göstergeye mi ihtiyacınız var? Freelance üzerinden sipariş edin Freelance'e git
Lot sizing and/or Number of trades for strategies like Grid and Martingale are very important.
We always ask about what happened in history of a symbol during range zones and How Many Times price bounced between two price of a Range Zone?!
This is what I define as Bounce Number. It can be calculated by a statistical analyses of any Symbol History from Market.
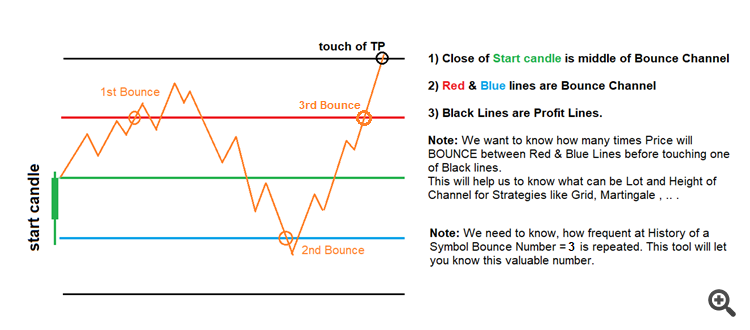
To be more clear lets have a look to image No. 1.

Image No. 1: Definition of Bounce Number, its goal and applications
Image illustrates how price movement generates statistics of Bounce Number Tool. To have a delay on tool I generated it as an EA to use Sleep function. This function somehow prohibits crash on chart because of higher number of candle set on tool's input.
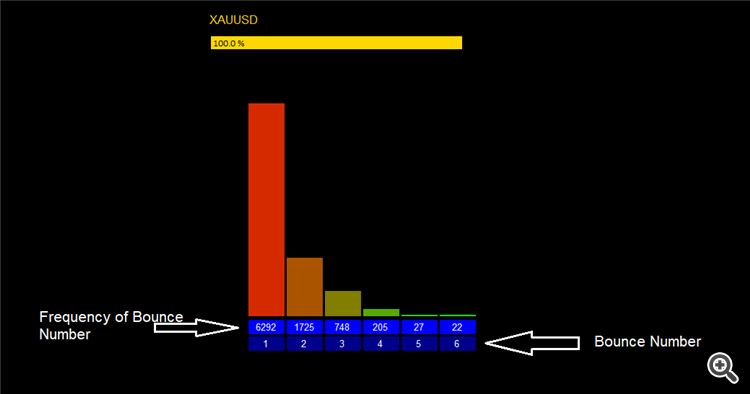
The other image (Image No.2) shows tools very brief graphical structure and its objects meanings.
Image No. 2: Bounce No. Statistics.
Tools usage:
form Image No. 2 considering we set Bouncing Channel Half Height to 600 points :
- there are 6 different bounce numbers from 1 to 6 for this symbol.
- bounce number 2 means, price starts from middle of bounce channel (height 2 * 600 = 1200 points) and moves up and down also hits one time red and one time blue lines before hitting TP=1200 points. So for bounce No. 5 this means price starts from channel mid point and hits 2 times red 3 times blue OR 3 times red and 2 times Blue line then hits TP=1200 points. Same can be said for other bounce numbers.
- We do not have bounce number 7, means there is not any 7 times bounce between red and blue lines (with 1200 points distance) over all history selected in tool's input. Please consider that if you select more historical data (Max number of lookback candles), chance to find 7 bounce will increase. but as we see even chance for 6 bounce is 22 in 9020 total items of price hit TPs.
What is in input of Tool:
- Max number of lookback candles: Same as other scanning tools be careful about number you set for this cell. Do no increase it dramatically to avoid any crash in memory.
- Time-Frame: Time-Frame of candles e want to use to find bounce from channel limits and also touching of TP lines. Use a lower time frame for thin channels. If you do not know what to set better to use M1 Time-frame.
- Bouncing Channel Half Height: This is green line's distance from red and blue lines. it is in Points.
- Chart Background Color
- Bar Chart Color 1/Bar Chart Color 2: to make statistical bars a little bit fancy
- Count Cells Color
- Bounce Numbers Cell color
- Load bar color: During calculation, this load bar will help user to know if it is working or not also how is the speed of calculations.
-Added button to start and entering number of historical candles from Screen.
 SSH Multi Time-Frame
SSH is popular indicator as it uses simply two moving averages. This version is a mylti-TF of SSH with TF change ability from screen.
 pivots calculation based on pine script v4
This is the exact conversion of pivotshigh and pivotslow functions from pine script v4 as an mql4 indicator.
 Relative Price Channel
mt4 version of original indicator
 Candle Gain Candle Loss
Displays the gains and losses for all candles where the given threshold is surpassed. The values are calculated in points and percentage.
