Fan sayfamıza katılın
Öyleyse bir link gönderin -
başkalarının da faydalanmasını sağlayın
- Görüntülemeler:
- 5086
- Derecelendirme:
- Yayınlandı:
- 2023.09.10 15:14
- Güncellendi:
- 2025.03.18 15:14
-
Bu koda dayalı bir robota veya göstergeye mi ihtiyacınız var? Freelance üzerinden sipariş edin Freelance'e git
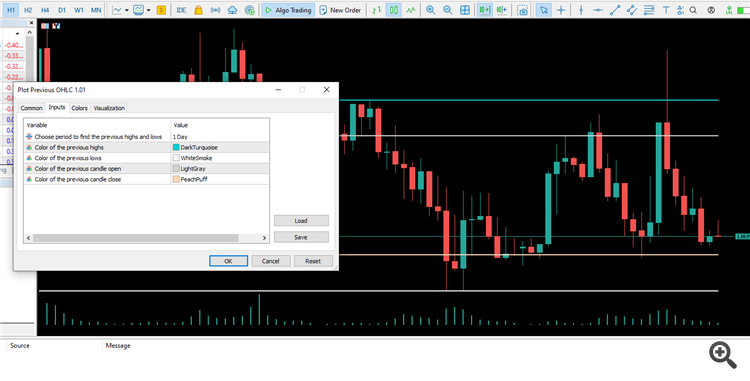
This indicator plots highs and lows as well as the open and close for the candle of the selected period. It is a multi-timeframe indicator which plot plot specific OHLC levels on the timeframe of your choice.
A shift input is included in the latest revision. A shift of 0 means the current bar OHLC, a shift of 1 means one bar back before the current (previous).
 Translating mouse click on chart into price value (Helper function)
This is a helper function which enables you to find the price of the symbol (the prices on the Y-axis) wherever you click the mouse on the chart. Using OnChartEvent, we don't have an MQL5 function in the API to do this, we can only obtain X and Y pixel values with mouse click.
 Drag and Drop Move TakeProfit
Set TakeProfit by just dragging and dropping script on the desired price level.
 Stochastic code for beginners by William210
Stochastic beginner tutorial to learn how to code in MQL5
 Automatic Chart Refresher
A tool which refreshes the chart automatically and will make active indicators update if something stopped plotting on the chart.
