Fan sayfamıza katılın
Öyleyse bir link gönderin -
başkalarının da faydalanmasını sağlayın
- Yayınlayan:
- padbravo
- Görüntülemeler:
- 7817
- Derecelendirme:
- Yayınlandı:
- 2022.06.07 18:10
- Güncellendi:
- 2022.06.08 23:27
-
Bu koda dayalı bir robota veya göstergeye mi ihtiyacınız var? Freelance üzerinden sipariş edin Freelance'e git
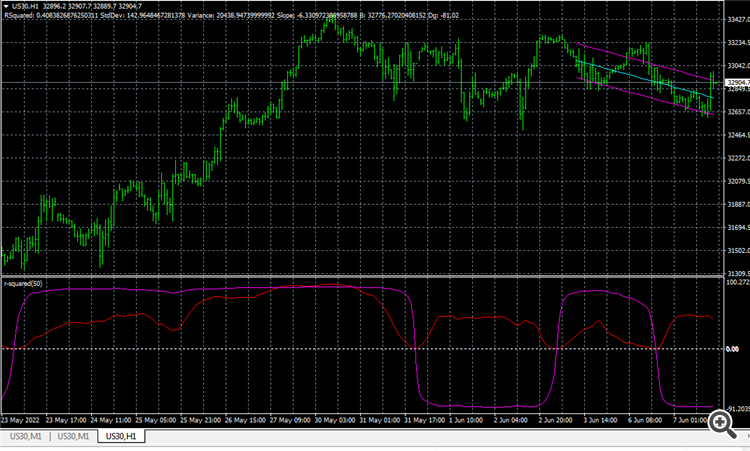
Also, it can do some other things:
- Slope
- Slope in degrees
- Variance
- Std Deviation
- Mean
- "Fake Graphs"
With this function (fake graphs) you can plot the actual data from a indicator. This is valuable when you are coding an EA and testing it on MT4, as the strategy tester does not show in real-time the actual graph from the indicators... Just fill the array with the actual N-values and call the procedure "Fake Graph" to plot it rigth on the main window
(8/6/2022 - Correctd a bug on the graph generating cicle)
 LP_entry
Arrow Up and Down on each bar and other informations.
 ScalpX
ScalpX is an indicator that uses Kalman filters to identify buy and sell opportunities whenever is indicated by the graph.
 Speed and Acceleration (with HMA)
This indicator gives the Speed and Acceleration of the price for a given period. In order to make a smooth graph, can be used a procedure using the Hull Moving Average method
 Squeeze Momentum Indicator - LazyBear
Converted LazyBear Squeeze Momentum Indicator from TradingView to MQL4
