Alım-satım robotlarını ücretsiz olarak nasıl indirebileceğinizi izleyin
Bizi Facebook üzerinde bulun!
Fan sayfamıza katılın
Fan sayfamıza katılın
Komut dosyasını ilginç mi buldunuz?
Öyleyse bir link gönderin -
başkalarının da faydalanmasını sağlayın
Öyleyse bir link gönderin -
başkalarının da faydalanmasını sağlayın
Komut dosyasını beğendiniz mi? MetaTrader 5 terminalinde deneyin
- Görüntülemeler:
- 16455
- Derecelendirme:
- Yayınlandı:
- 2019.01.25 11:04
-
Bu koda dayalı bir robota veya göstergeye mi ihtiyacınız var? Freelance üzerinden sipariş edin Freelance'e git
Theory :
The Donchian channel is an indicator used in market trading developed by Richard Donchian. It is formed by taking the highest high and the lowest low of the last n periods. The area between the high and the low is the channel for the period chosen.Donchian Channel Formula
- The upper band is calculated as the highest high for the selected period.
- The lower band is calculated as the lowest low for the selected period.
- The selected period does not include the day on which the band is plotted (otherwise the band would never be crossed). For example, the 20-Day Donchian Channels for today are the highest high and lowest low for the preceding 20 trading days.
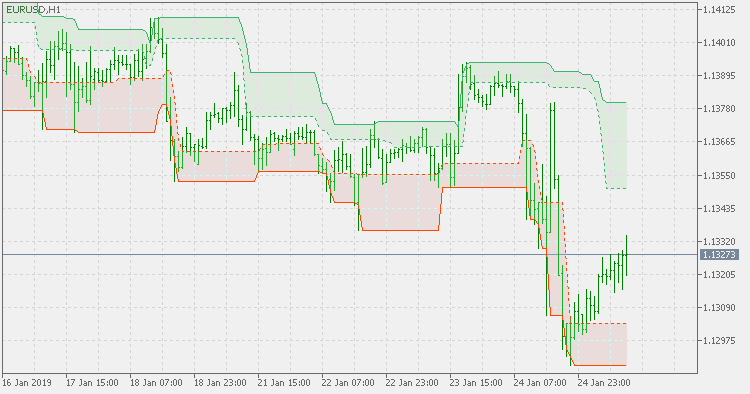
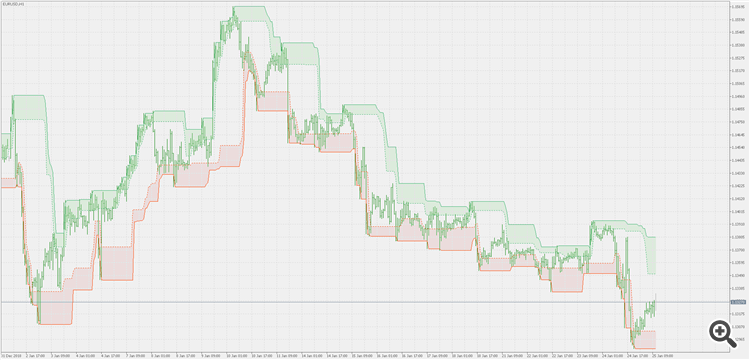
This version is not calculating only the channel itself, but is calculation a sort of support and resistance "sub"channels" within the existing Donchian channel. That way we can estimate the "price action" a bit more accurate
Usage :
It can be used as any "regular" Donchian channel, but also can be used for support and resistance levels assessment

 Smoother rainbow
Smoother rainbow
 Asymmetric bands oscillator - extended
Asymmetric bands oscillator - extended version
