Fan sayfamıza katılın
Öyleyse bir link gönderin -
başkalarının da faydalanmasını sağlayın
- Görüntülemeler:
- 9667
- Derecelendirme:
- Yayınlandı:
- 2019.01.16 21:10
-
 Alım-satım fırsatlarını kaçırıyorsunuz:
- Ücretsiz alım-satım uygulamaları
- İşlem kopyalama için 8.000'den fazla sinyal
- Finansal piyasaları keşfetmek için ekonomik haberler
Kayıt Giriş yapGizlilik ve Veri Koruma Politikasını ve MQL5.com Kullanım Şartlarını kabul edersiniz
Hesabınız yoksa, lütfen kaydolun -
 Bu koda dayalı bir robota veya göstergeye mi ihtiyacınız var? Freelance üzerinden sipariş edin
Freelance'e git
Bu koda dayalı bir robota veya göstergeye mi ihtiyacınız var? Freelance üzerinden sipariş edin
Freelance'e git
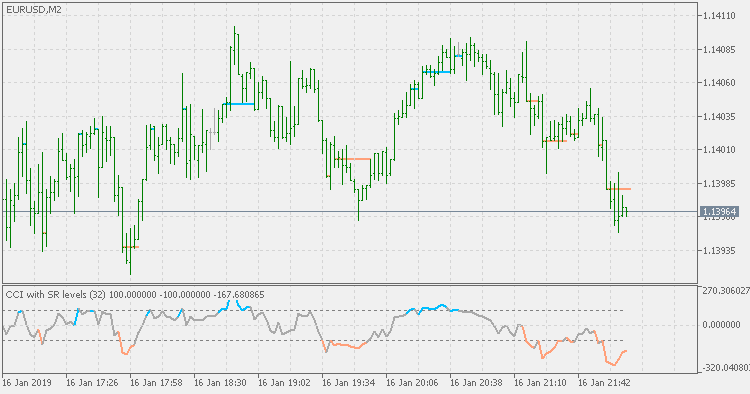
Theory :
The idea for this indicator is as simple as it gets : a lot of times we are using some indicator levels as a signal that some desired level is reached and that the price change is to be used as an entry or exit price for our orders / positions. That is all OK but many times we simply are comparing the prices only visually. This indicator is a sort of a "helper" for that. What it does :
- it waits for a level break (CCI in this case)
- if it was broken, then it checks if a new trend line at the chart should be displayed
- if it remains in the over bought or oversold area, it adjusts the existing SR level displayed on chart
- if it retraces in to the neutral zone, the line update is canceled and a new signal is waited for
Th indicator, as it is, is mainly meant to be used in manual trading.
Usage :
The same as any CCI.
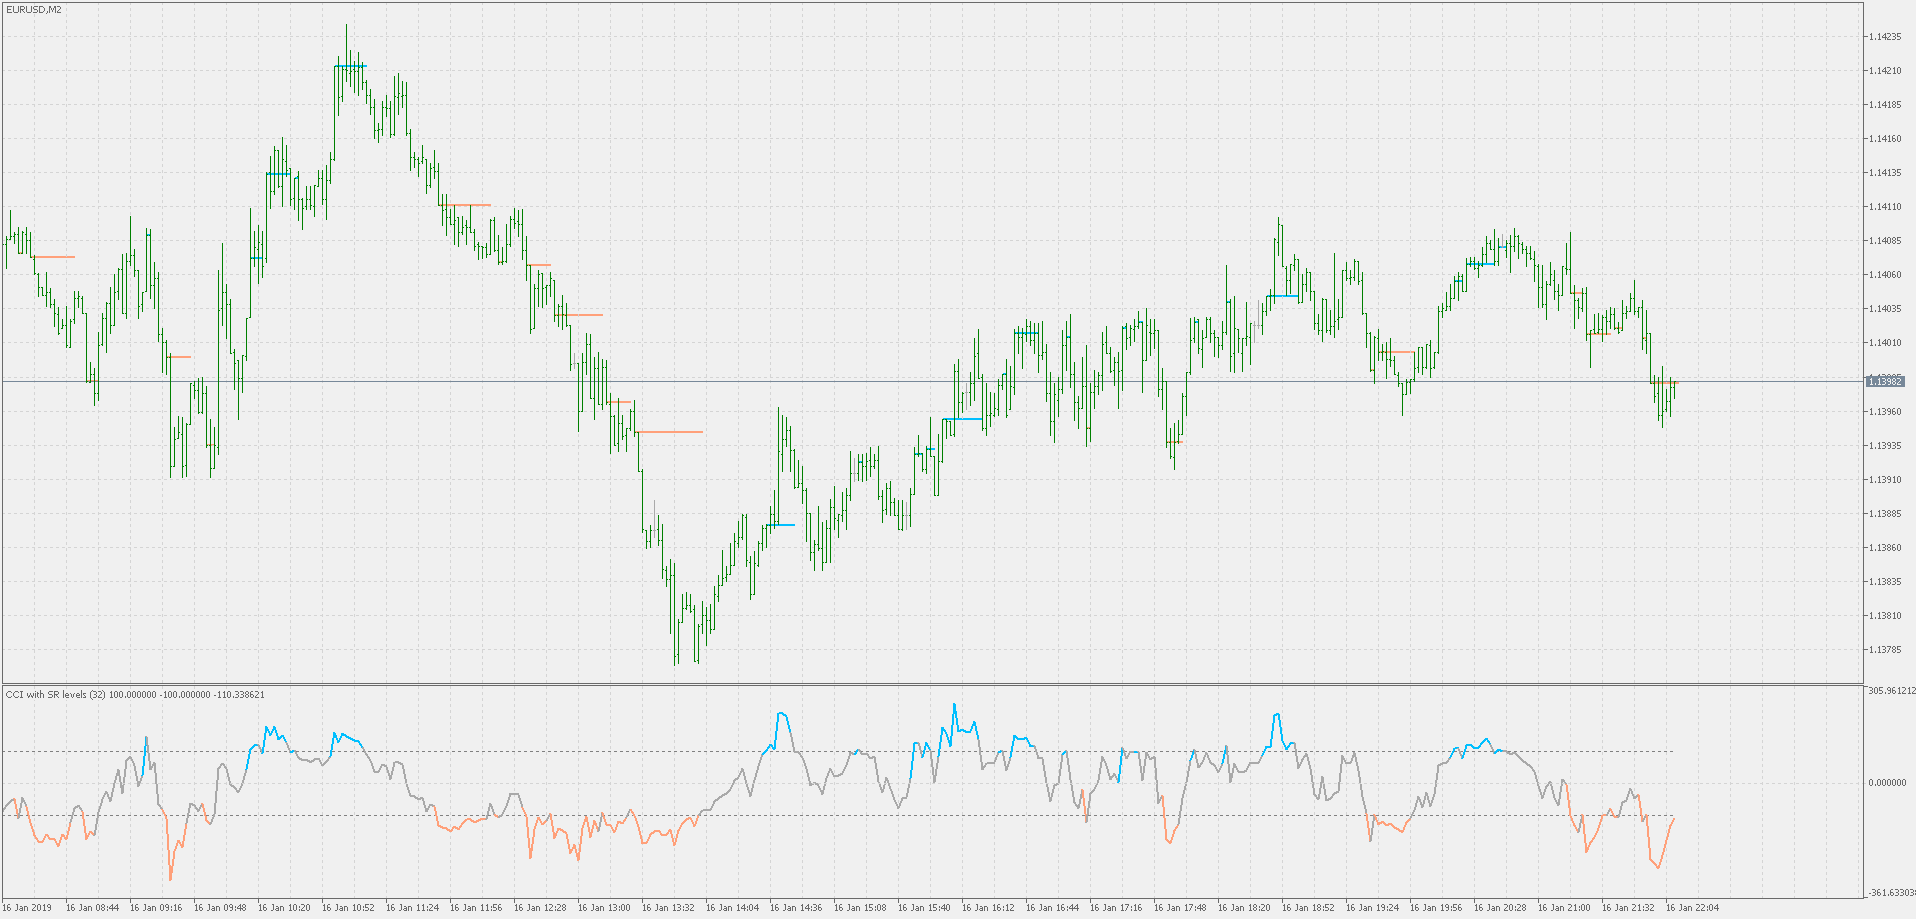
PS:
The "big picture" example that shows in a more clear way how the indicator works and what is it showing us on chart
 Corrected double smoothed Wilder's EMA (extended version)
Corrected double smoothed Wilder's EMA (extended version)
Corrected double smoothed Wilder's EMA
Corrected double smoothed Wilder's EMA
RSI with on chart SR levels
RSI with on chart SR levels
Stochastic with support / resistance levels
Stochastic with support / resistance levels