Ticaret robotlarını ücretsiz olarak nasıl indirebileceğinizi izleyin
Bizi Twitter üzerinde bulun!
Fan sayfamıza katılın
Fan sayfamıza katılın
Komut dosyasını ilginç mi buldunuz?
Öyleyse bir link gönderin -
başkalarının da faydalanmasını sağlayın
Öyleyse bir link gönderin -
başkalarının da faydalanmasını sağlayın
Komut dosyasını beğendiniz mi? MetaTrader 5 terminalinde deneyin
- Görüntülemeler:
- 6514
- Derecelendirme:
- Yayınlandı:
- 2018.11.20 12:49
-
 Ticaret fırsatlarını kaçırıyorsunuz:
- Ücretsiz ticaret uygulamaları
- İşlem kopyalama için 8.000'den fazla sinyal
- Finansal piyasaları keşfetmek için ekonomik haberler
Kayıt Giriş yapGizlilik ve Veri Koruma Politikasını ve MQL5.com Kullanım Şartlarını kabul edersiniz
Hesabınız yoksa, lütfen kaydolun -
 Bu koda dayalı bir robota veya göstergeye mi ihtiyacınız var? Freelance üzerinden sipariş edin
Freelance'e git
Bu koda dayalı bir robota veya göstergeye mi ihtiyacınız var? Freelance üzerinden sipariş edin
Freelance'e git
Wick length indicator displays the candle wick length in points in a separate chart window.
It has one configurable parameter:
- Method - display method
- Separated - separate
- Separated Opposite Only - separated, opposite wicks only
- Cumulative
- Difference
Display methods:
- Separated display method:
Wick length is displayed "as is":
Upper wick - upper wick length,
Lower wick - lower wick length - Separated, opposite wicks only:
- If the candle is bullish:
Upper wick = 0
Lower wick = lower wick length - If the candle is bearish:
Upper wick = upper wick length
Lower wick = 0
- If the candle is bullish:
- Cumulative:
The 'Upper wick' buffer is named "Wick cumulative" and displays the sum of the upper and lower candle wick
The 'Lower wick' buffer is not displayed - Difference:
The 'Upper wick' buffer is named "Wick difference" and displays the difference between the candle's upper and lower candle
The 'Lower wick' buffer is not displayed
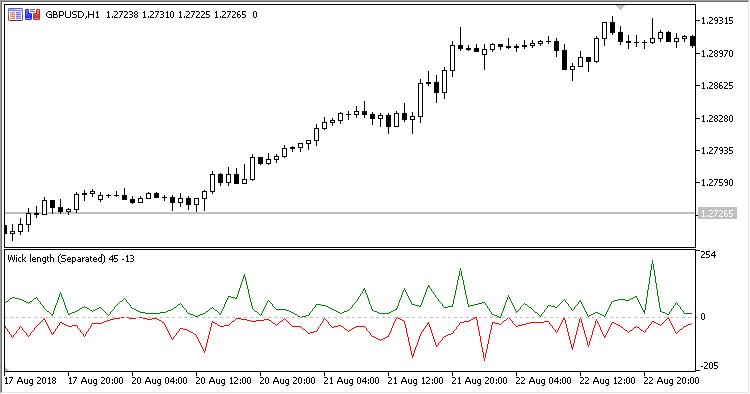
Fig. 1. Wick length, Method = Separated
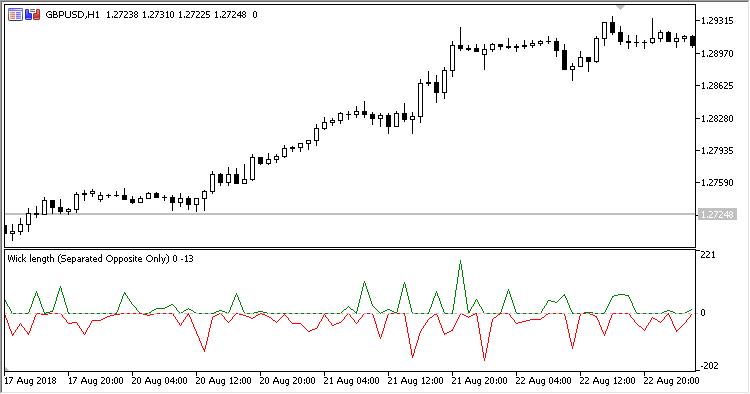
Fig. 2. Wick length, Method = Separated Opposite Only
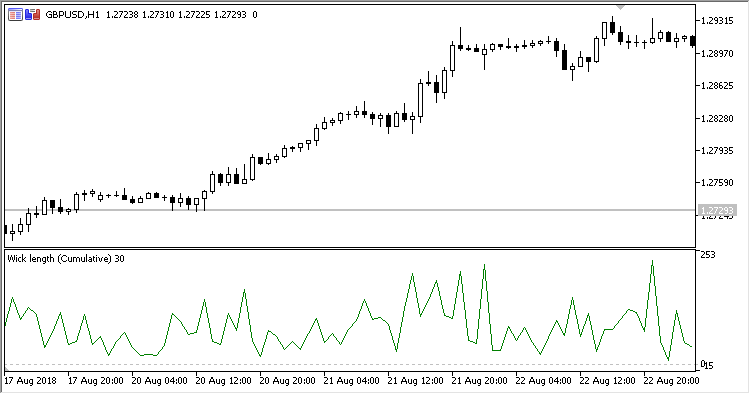
Fig. 3. Wick length, Method = Cumulative
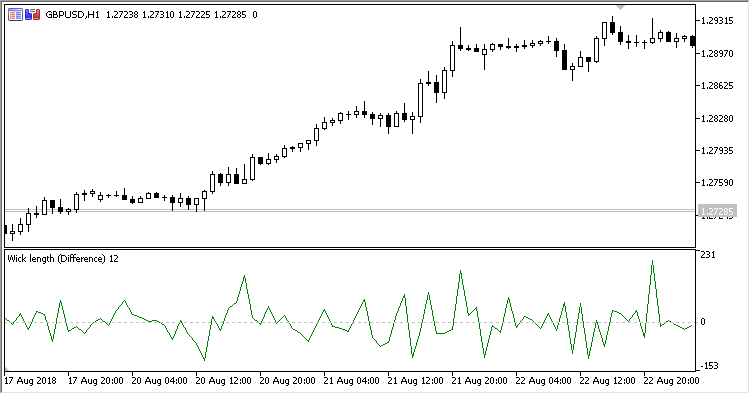
Fig. 4. Wick length, Method = Difference
MetaQuotes Ltd tarafından Rusçadan çevrilmiştir.
Orijinal kod: https://www.mql5.com/ru/code/23008
 Time_Bar_Custom_Weekly
The indicator plots one vertical line per day in a specified moment of time once per week
ColorXFisher_org_v1_X20
XFisher_org_v1_X20 indicator is able to color each line depending on its position relative to overbought and oversold areas