Fan sayfamıza katılın
Öyleyse bir link gönderin -
başkalarının da faydalanmasını sağlayın
- Görüntülemeler:
- 3363
- Derecelendirme:
- Yayınlandı:
- 2015.01.22 12:33
- Güncellendi:
- 2016.11.22 07:32
-
Bu koda dayalı bir robota veya göstergeye mi ihtiyacınız var? Freelance üzerinden sipariş edin Freelance'e git
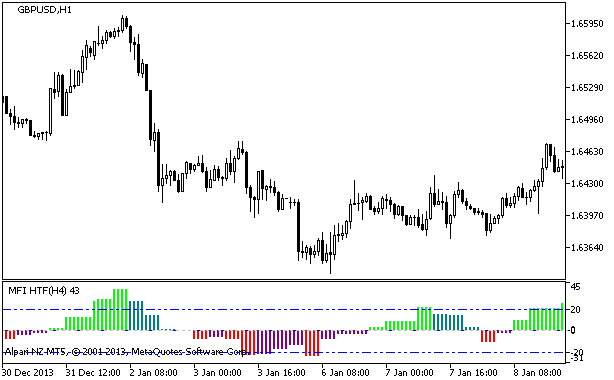
The MFI oscillator with the timeframe selection option available in input parameters.
input ENUM_TIMEFRAMES TimeFrame=PERIOD_H4; // Indicator chart period (timeframe)
For more visual perception the indicator has been shifted fifty units down.

Fig.1. The MFI_HTF indicator
MetaQuotes Ltd tarafından Rusçadan çevrilmiştir.
Orijinal kod: https://www.mql5.com/ru/code/2283
 ColorCCI
The classic CCI with the colored signal levels. For the moments of time, when the CCI indicator is in oversold and overbought zones, there are change of the indicator color corresponding to the trend direction. The growing trend colors the indicator in lettuce green, the falling into the red one.
 Simple Continuous ParabolicSAR
Unlike ParabolicSAR this indicator is continuous and more precise. Indicator's calculation is also very easy.
 CronexRSI
The MACD Indicator, in which the price series is replaced by the series of values of the iRSI technical indicator. It is drawn in the form of a colored cloud.
 DynamicRS_C_HTF
The DynamicRS_C indicator with the timeframe selection option available in input parameters.