Fan sayfamıza katılın
Öyleyse bir link gönderin -
başkalarının da faydalanmasını sağlayın
- Görüntülemeler:
- 2927
- Derecelendirme:
- Yayınlandı:
- 2018.07.13 16:00
-
 Ticaret fırsatlarını kaçırıyorsunuz:
- Ücretsiz ticaret uygulamaları
- İşlem kopyalama için 8.000'den fazla sinyal
- Finansal piyasaları keşfetmek için ekonomik haberler
Kayıt Giriş yapGizlilik ve Veri Koruma Politikasını ve MQL5.com Kullanım Şartlarını kabul edersiniz
Hesabınız yoksa, lütfen kaydolun -
 Bu koda dayalı bir robota veya göstergeye mi ihtiyacınız var? Freelance üzerinden sipariş edin
Freelance'e git
Bu koda dayalı bir robota veya göstergeye mi ihtiyacınız var? Freelance üzerinden sipariş edin
Freelance'e git
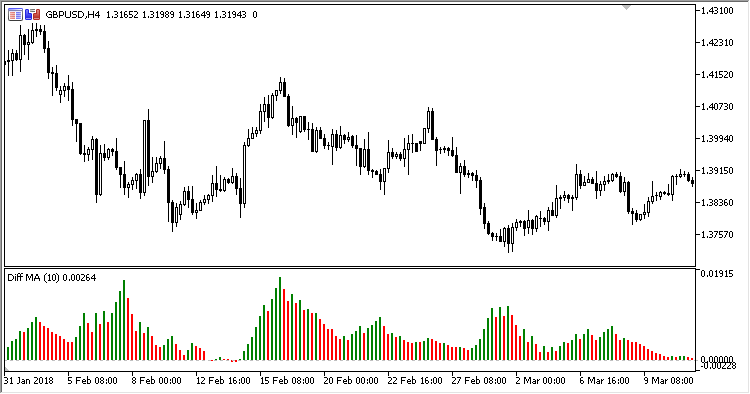
The indicator displays the difference between the DiffMA lines, i.e., two moving averages calculated within the range of one-direction candlesticks.
The calculations doe not require the availability of DiffMA - the indicator calculates it by itself.
It has two configurable parameters:
- Period - DiffMA calculation period
- Applied price - DiffMA calculation price
Calculations:
DMA = (Up - Dn)
where:
UP = SumUp / CountUp
DN = SumDn / CountDn


SumUp = Sum of SMA(Applied price, 1) for all bullish candlesticks within the Period
SumDn = Sum of SMA(Applied price, 1) for all bearish candlesticks within the Period
CountUp - number of bullish candlesticks within the Period
CountDn - number of bearish candlesticks within the Period
MetaQuotes Ltd tarafından Rusçadan çevrilmiştir.
Orijinal kod: https://www.mql5.com/ru/code/21317
 DiffMA
Two moving averages on the range of one-direction candlesticks
Bears_Bulls_Impuls
An indicator of bull/bear power
Flat_Trend
A market state indicator
AbsolutelyNoLagLwma_Range_Channel_HTF
Indicator AbsolutelyNoLagLwma_Range_Channel with the timeframe selection option available in the input parameters.