Fan sayfamıza katılın
Öyleyse bir link gönderin -
başkalarının da faydalanmasını sağlayın
- Görüntülemeler:
- 7310
- Derecelendirme:
- Yayınlandı:
- Güncellendi:
-
Bu koda dayalı bir robota veya göstergeye mi ihtiyacınız var? Freelance üzerinden sipariş edin Freelance'e git
Real author:
Forex-TSD.com
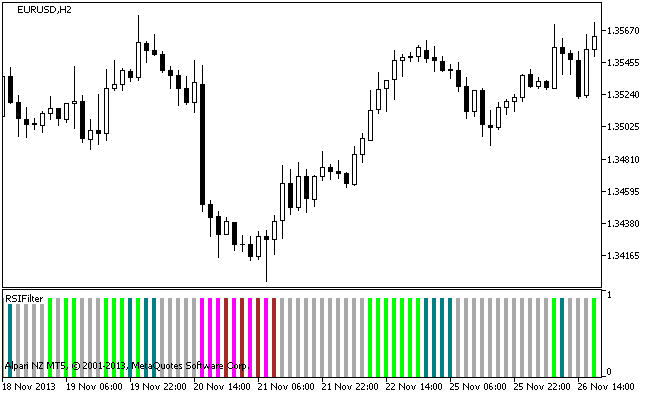
The indicator changes color of bars in a separate window. It is changed to the color of the current trend calculated based on the RSI technical indicator.
If the trend and candlestick direction match, the color of the bar is light, if opposite, the bar is dark.
Trend strength is determined by the presence of the RSI indicator in overbought or oversold areas whose levels are determined by the indicator input parameters:
input uint   HighLevel=55;    // Overbought level
input uint   LowLevel=45;     // Oversold level
If the RSI is outside these areas, the bar is painted in light gray.

Figure 1. The RSIFilter indicator
MetaQuotes Ltd tarafından Rusçadan çevrilmiştir.
Orijinal kod: https://www.mql5.com/ru/code/2125
 Background_Candles_Smoothed_HTF
The indicator draws averaged candlesticks of a higher timeframe as color filled rectangles using DRAW_FILLING buffers.
 Background_Heiken_Ashi_Сandle_HTF
The indicator draws Heiken Ashi candlesticks of a higher timeframe as color filled rectangles using DRAW_FILLING buffers.
 BackgroundСandle_BrainTrend1_HTF
The indicator draws rectangle candlesticks of a higher timeframe based on the values of the BrainTrend1 indicator.
 BackgroundСandle_BrainTrend2_HTF
The indicator draws rectangle candlesticks of a higher timeframe based on the values of the BrainTrend2 indicator.