Fan sayfamıza katılın
Öyleyse bir link gönderin -
başkalarının da faydalanmasını sağlayın
- Görüntülemeler:
- 11173
- Derecelendirme:
- Yayınlandı:
- 2018.05.17 13:07
-
 Ticaret fırsatlarını kaçırıyorsunuz:
- Ücretsiz ticaret uygulamaları
- İşlem kopyalama için 8.000'den fazla sinyal
- Finansal piyasaları keşfetmek için ekonomik haberler
Kayıt Giriş yapGizlilik ve Veri Koruma Politikasını ve MQL5.com Kullanım Şartlarını kabul edersiniz
Hesabınız yoksa, lütfen kaydolun -
 Bu koda dayalı bir robota veya göstergeye mi ihtiyacınız var? Freelance üzerinden sipariş edin
Freelance'e git
Bu koda dayalı bir robota veya göstergeye mi ihtiyacınız var? Freelance üzerinden sipariş edin
Freelance'e git
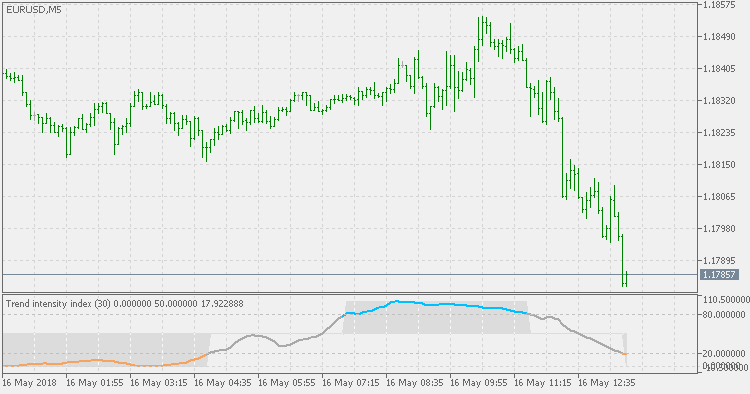
Trend Intensity Index as described by M.H.Pee in his article "Trend Intensity Index".
To calculate a 30-day Trend Intensity Index (TII), follow these steps:
- Obtain the 60-day simple Moving Average by adding the Closes for the past 60 days and dividing the result by 60.
- Find the deviation of each of the recent 30 Closes from the 60-day Moving Average. The deviation is up if the Close is above the Moving Average, and down when the Close is below the average.
- Up deviation values are obtained by subtracting the Moving Average from the Close.
- Down deviations are calculated by subtracting the Close from the Moving Average.
- The TII allows you to find out what percentage of these deviations is up or down. For a 30-day TII, you should have 30 deviations from the 60-day Moving Average.
 Leader of the MACD - Extended
This version extends the basic version of Leader of the MACD with some options that are adding more flexibility to the usage of the indicator.
Trend Strength Average
Trend Strength Average uses some of the 4 regular types of averages for trend strength assessment.
Heiken Ashi Zone Trade
Heiken Ashi Zone Trade indicator is based on 3 indicators: Heiken Ashi, Accelerator Oscillator, and Awesome Oscillator.
Heiken Ashi Zone Trade - Separate
This version of Heiken Ashi Zone Trade indicator is made to display values in a separate window - that way it will not interfere with the other on-chart indicators and can be easier to read the states in some cases.