Fan sayfamıza katılın
Öyleyse bir link gönderin -
başkalarının da faydalanmasını sağlayın
- Görüntülemeler:
- 6028
- Derecelendirme:
- Yayınlandı:
- 2018.01.22 09:22
-
Bu koda dayalı bir robota veya göstergeye mi ihtiyacınız var? Freelance üzerinden sipariş edin Freelance'e git
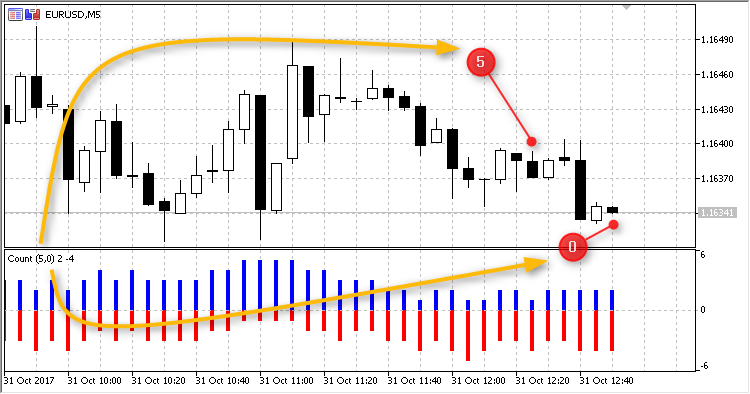
The indicator calculates bullish and bearish bars in the period from The number of the starting bar (the first bar on the right of the chart) till The number of the end bar (located on the left).
The indicator with 'starting bar' (0) and 'end bar' (5):

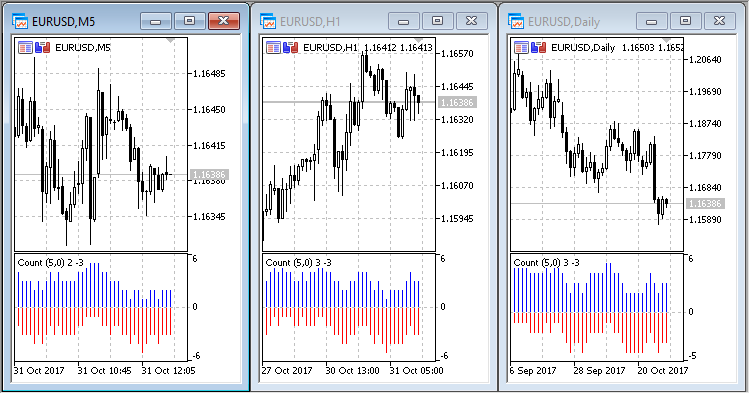
Possible application: three timeframes with the same settings:

MetaQuotes Ltd tarafından Rusçadan çevrilmiştir.
Orijinal kod: https://www.mql5.com/ru/code/19328
 Statistics of candles 2
Counting the number of series of bullish and bearish bars. Displaying the result as a chart. Saving the screenshot of the resulting chart. The script uses the CGraphic class.
 DeMarkerValues
The indicator shows a text block with the values of the user defined DeMarker oscillator period for each timeframe.
 MAMACD
A strategy based on iMA (Moving Average, MA) and iMACD (Moving Average Convergence/Divergence, MACD).
 Alert Crossing Moving Average Nth Bar
An alert (an audio alert, email and push notification) is generated when the iMA (Moving Average, MA) indicator crosses the bar with index N.