Fan sayfamıza katılın
Öyleyse bir link gönderin -
başkalarının da faydalanmasını sağlayın
- Görüntülemeler:
- 7491
- Derecelendirme:
- Yayınlandı:
- 2013.08.19 21:49
- Güncellendi:
- 2016.11.22 07:32
-
Bu koda dayalı bir robota veya göstergeye mi ihtiyacınız var? Freelance üzerinden sipariş edin Freelance'e git
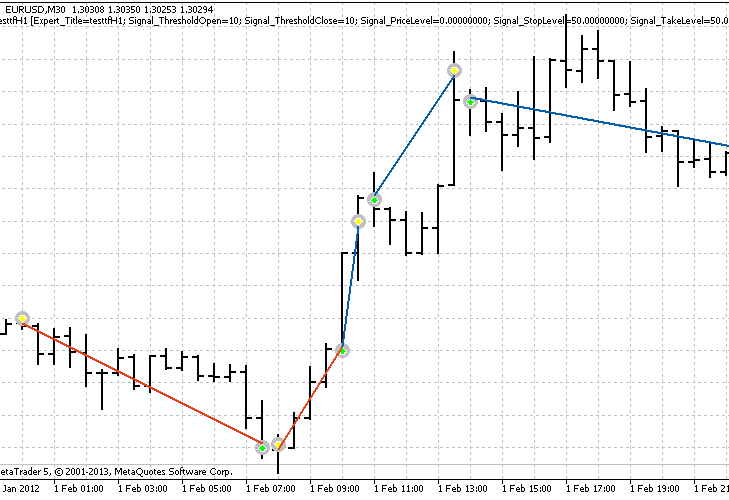
The ForAfterTesting script for changing the display of graphical objects created by the strategy tester and for easier visual analysis of the results.
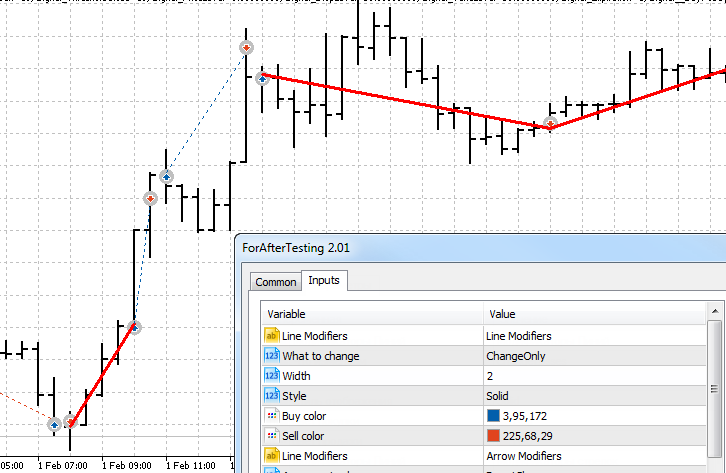
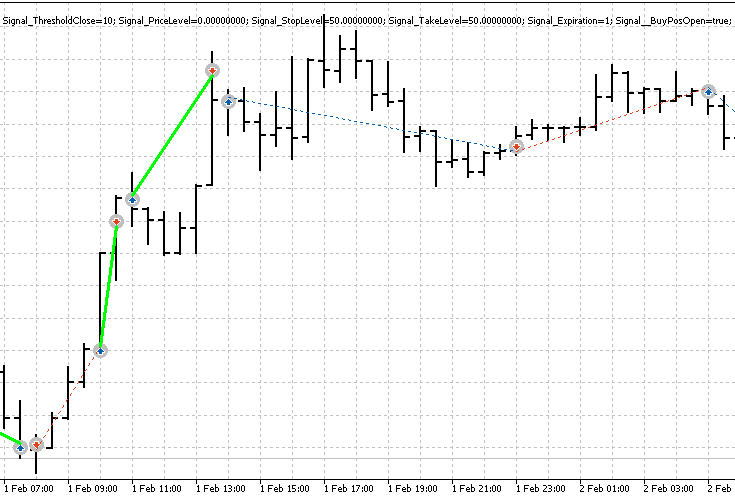
Changes the parameters of lines (the ChangeOnly parameter). Simplifies the analysis of profitable (parameter ChangeWinners) and loss (parameter ChangeLosses) trades.
Key features:
Changing object properties: the color of the line, the display style, width, color of the arrows.

Analysis of losing trades:

Analysis of profitable trades:

Tips:
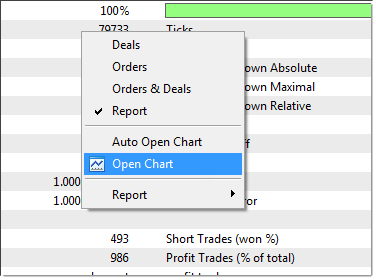
Note: it is recommended that you open a new chart for every new change.

MetaQuotes Ltd tarafından Rusçadan çevrilmiştir.
Orijinal kod: https://www.mql5.com/ru/code/1791
 Three Screen Elder Arrows
An indicator in the form of arrows on the basis of Elder's trading system.
 Levels
Another version of the indicator that calculates support/resistance levels.
 NextBarColor
The indicator "predicts" the color of the next bar with the probability specified in the settings. It is useful for the evaluation of strategies aimed at such a prediction when choosing trading instruments / timeframes for strategies. Caution: The indicator "looks into the future", so do not apply it in real life or in the strategy tester!
 ChartChanger
The script is assigned to a hot key for quick change of charts around in a circle.