Fan sayfamıza katılın
Öyleyse bir link gönderin -
başkalarının da faydalanmasını sağlayın
- Görüntülemeler:
- 13129
- Derecelendirme:
- Yayınlandı:
- 2015.12.11 11:03
-
 Ticaret fırsatlarını kaçırıyorsunuz:
- Ücretsiz ticaret uygulamaları
- İşlem kopyalama için 8.000'den fazla sinyal
- Finansal piyasaları keşfetmek için ekonomik haberler
Kayıt Giriş yapGizlilik ve Veri Koruma Politikasını ve MQL5.com Kullanım Şartlarını kabul edersiniz
Hesabınız yoksa, lütfen kaydolun -
 Bu koda dayalı bir robota veya göstergeye mi ihtiyacınız var? Freelance üzerinden sipariş edin
Freelance'e git
Bu koda dayalı bir robota veya göstergeye mi ihtiyacınız var? Freelance üzerinden sipariş edin
Freelance'e git
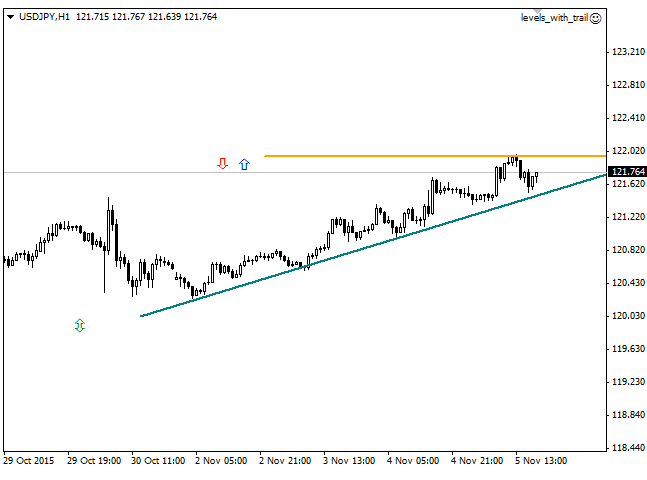
The EA trades on the breakout or the retreat from the support/resistance lines. The lines are set manually by the trader using the "Trend line" object on the toolbar.
When the price moves towards the profit the EA trails the Stop Loss order.
Two trade modes are available:
- Retreat from the line. In this case, the buy order is placed by the "up" arrow once the price touches the support level (when the bar opening price is above the line). The sell order is placed by the "down" arrow once the price touches the resistance level (the bar opening price is below the line).
- The breakout of the line. Buy and sell are placed by the ↕ arrow once the line crosses the resistance and the support levels, respectively.
For ease of visual perception, the line colors are set according to the slope angle, as well as zero thickness in case incompatible trade directions relative to it are set. In that case the line is considered to be disabled, and trading based on it is not performed. A reduction to the horizontal is provided once the trader moves the second plot point of the horizontal line to the left of the first plot point, in order to simplify its placement.
MetaQuotes Ltd tarafından Rusçadan çevrilmiştir.
Orijinal kod: https://www.mql5.com/ru/code/14206
 Simple News
The Expert Advisor places a grid of pending orders in both directions several minutes before the specified time and trails the Stop Loss order after the orders trigger.
 ClusterBox_DayHistogramm - horizontal cross-section of the market by days
Tick volumes drawn by days as a histogram of clusters.
 The function of program operation by time
The function allows the execution of the specific code in the specified time interval.
High, Low and Close of the previous day, week or month
The indicator shows the High, Close and Low of the previous day, week or month with time shift.