Fan sayfamıza katılın
Öyleyse bir link gönderin -
başkalarının da faydalanmasını sağlayın
- Görüntülemeler:
- 15606
- Derecelendirme:
- Yayınlandı:
- 2015.12.11 10:59
- Güncellendi:
- 2016.11.22 07:32
-
 Ticaret fırsatlarını kaçırıyorsunuz:
- Ücretsiz ticaret uygulamaları
- İşlem kopyalama için 8.000'den fazla sinyal
- Finansal piyasaları keşfetmek için ekonomik haberler
Kayıt Giriş yapGizlilik ve Veri Koruma Politikasını ve MQL5.com Kullanım Şartlarını kabul edersiniz
Hesabınız yoksa, lütfen kaydolun -
 Bu koda dayalı bir robota veya göstergeye mi ihtiyacınız var? Freelance üzerinden sipariş edin
Freelance'e git
Bu koda dayalı bir robota veya göstergeye mi ihtiyacınız var? Freelance üzerinden sipariş edin
Freelance'e git
General Information
For each candlestick of any timeframe there is a corresponding amount of ticks that formed it. On Forex charts this trait is displayed as Volume, although it has no direct relation to the real trade volumes. However, the tick volume data can be in the same way as the real volume data.
The information about the ticks that came before the indicator was attached are taken from the special tick file, which is formed with the help of the Ticks collector. A ready-made tick file can also be taken from the archive. If the history rendering is not required, then the indicator values will appear in real-time, provided the new ticks arrive.
About the ClusterBox_Histogramm indicator
Unlike the ClusterBox indicator, that displays the amount of ticks per one cluster within a single candlestick, the ClusterBox_Histogramm indicator calculates the amount of ticks of one cluster, which combines several candlesticks. That is the specified interval of the candlesticks is considered as a single candlestick split into clusters. For each such cluster, the amount of ticks within it is calculated.
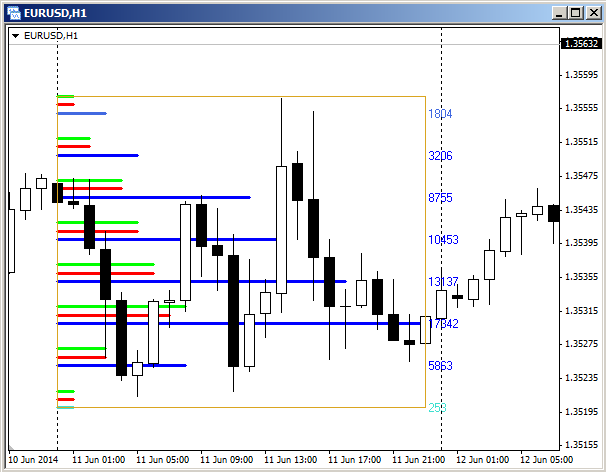
The blue and light blue lines on the chart — total amount of ticks per one cluster. The precise value of this number is displayed to the right of the rectangle, that bounds the data collection interval. The colors of these lines depends on the amount of ticks and values of the setting parameters of the "Min. volumes and colors" block.
Red and green lines — the amount of ticks per fall and growth prices respectively. Set in the "Delta of volumes" parameters block.
The data collection interval is set by moving and/or dragging the rectangle.
More detailed information can be found in the article The horizontal cross-section of the market.
MetaQuotes Ltd tarafından Rusçadan çevrilmiştir.
Orijinal kod: https://www.mql5.com/ru/code/14180
 Arrows Template
An indicator template that draws arrows on the chart.
 Close_all-e
Script that closes orders and (or) deletes pending orders.
ClusterBox_DayHistogramm - horizontal cross-section of the market by days
Tick volumes drawn by days as a histogram of clusters.
 Simple News
The Expert Advisor places a grid of pending orders in both directions several minutes before the specified time and trails the Stop Loss order after the orders trigger.