Fan sayfamıza katılın
Öyleyse bir link gönderin -
başkalarının da faydalanmasını sağlayın
- Görüntülemeler:
- 10441
- Derecelendirme:
- Yayınlandı:
- 2015.07.24 16:28
- Güncellendi:
- 2016.11.22 07:32
-
 Ticaret fırsatlarını kaçırıyorsunuz:
- Ücretsiz ticaret uygulamaları
- İşlem kopyalama için 8.000'den fazla sinyal
- Finansal piyasaları keşfetmek için ekonomik haberler
Kayıt Giriş yapGizlilik ve Veri Koruma Politikasını ve MQL5.com Kullanım Şartlarını kabul edersiniz
Hesabınız yoksa, lütfen kaydolun -
 Bu koda dayalı bir robota veya göstergeye mi ihtiyacınız var? Freelance üzerinden sipariş edin
Freelance'e git
Bu koda dayalı bir robota veya göstergeye mi ihtiyacınız var? Freelance üzerinden sipariş edin
Freelance'e git
Real author:
Chester Keltner
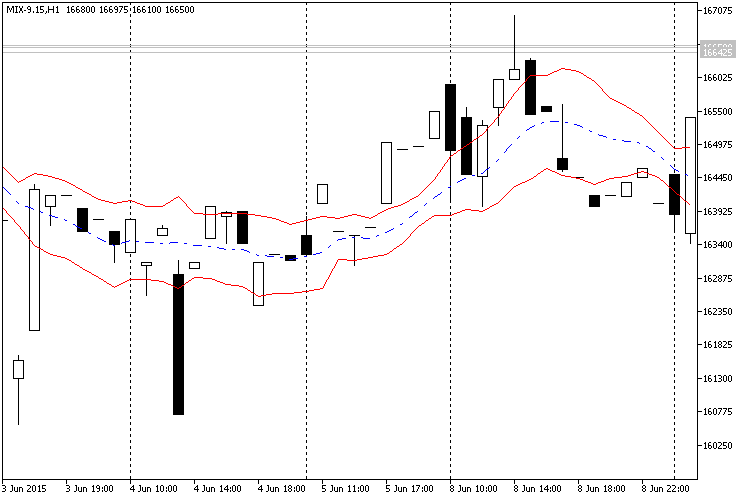
The indicator shows the Keltner Channel — a classic technical indicator developed by Chester Keltner in 1960. It may look similar to Bollinger Bands.
It uses three chart lines: middle line is a 10-day simple moving average by typical prices ((high + low + close) / 3), upper and lower lines are formed by adding and subtracting the moving average of daily price range (difference between maximum and minimum) from the middle line. Therefore, it forms a channel based on volatility.
Input Parameters:
- MA_Period (by default = 10) — period of moving average (middle line).
- Mode_MA (by default = MODE_SMA) — type of moving average (middle line).
- Price_Type (by default = PRICE_TYPICAL) — price type for moving average (middle line).
MetaQuotes Ltd tarafından Rusçadan çevrilmiştir.
Orijinal kod: https://www.mql5.com/ru/code/13258
 Exp_ColorZerolagRSIOSMA
The Exp_ColorZerolagRSIOSMA Expert Advisor is based on the ColorZerolagRSIOSMA histogram change of direction.
 BollingerBands_b_HTF
The BollingerBands_b indicator with the timeframe selection option available in the input parameters.
 Time Price Scale Enables Disables
The script controls the display of time and price scales for all open charts or only for one chart.
MultiColorZerolagTriXOSMATrend_x10
The MultiColorZerolagTriXOSMATrend_x10 indicator shows information on current trends using the ColorZerolagTriXOSMA indicator direction from ten different timeframes.