Fan sayfamıza katılın
Öyleyse bir link gönderin -
başkalarının da faydalanmasını sağlayın
- Görüntülemeler:
- 53168
- Derecelendirme:
- Yayınlandı:
- 2015.03.20 12:05
- Güncellendi:
- 2017.04.02 18:30
-
Bu koda dayalı bir robota veya göstergeye mi ihtiyacınız var? Freelance üzerinden sipariş edin Freelance'e git
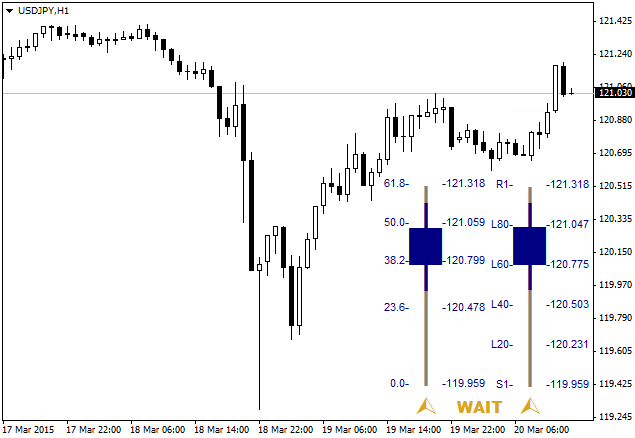
This indicator is a composite of several indicators: Fibonacci, Pivot Point, ZigZag, MACD and Moving Average which are combined in this indicator.
This indicator gives advice to buy and sell with the direction of the arrow.
Update_01 (24/03/2015)
- Reduced false signals, simplified the formula, and replaced the formula of the Stochastic indicator with MACD indicator.
Update_02 (26/04/2015)
- Fixed code for Price Retracement FiboCandleBar.
Update_03 (18/05/2015)
- Added Alerts (Messages, Email and Sound) to the indicator.
- Improved the performance of the Indicator.
Update_04 (16/06/2015)
- Added Color Option, so that the user can change the color bar and font colors.
Update_05 (30/07/2015)
- Made minor changes to the Pivot formula.
- Removed unused variables.
- Added a formula to improve the accuracy of the signal.
Update_07 (29/12/2016): version "2.00"
- Update and simplify code.
Update_08 (01/04/2017) version "3.00"
- Fix syntax, according to the latest updates MQL4.
- Simplify the writing program.
- Added Font model option.

 Overlay and Spread Charts for 2 symbols
Main chart shows the overlay chart of 2 symbols - while subchart displays the price spread line with spreadfactor.
 InfoLabel
A simple label that shows information like Ask & Bid, OHLC prices, volume, spread, remaining candle time, local & server time.
 BB_OsMA
BB_OsMA indicator is the OsMA indicator in the form of spheroid with a deviation as the upper and lower bands.
 Multi-Trendlines Breakout
When the current price is below trendlines, EA will wait for upward breakout, and vice versa.