Fan sayfamıza katılın
Öyleyse bir link gönderin -
başkalarının da faydalanmasını sağlayın
- Görüntülemeler:
- 25685
- Derecelendirme:
- Yayınlandı:
- 2011.08.02 08:49
- Güncellendi:
- 2015.04.21 13:22
-
 Alım-satım fırsatlarını kaçırıyorsunuz:
- Ücretsiz alım-satım uygulamaları
- İşlem kopyalama için 8.000'den fazla sinyal
- Finansal piyasaları keşfetmek için ekonomik haberler
Kayıt Giriş yapGizlilik ve Veri Koruma Politikasını ve MQL5.com Kullanım Şartlarını kabul edersiniz
Hesabınız yoksa, lütfen kaydolun -
 Bu koda dayalı bir robota veya göstergeye mi ihtiyacınız var? Freelance üzerinden sipariş edin
Freelance'e git
Bu koda dayalı bir robota veya göstergeye mi ihtiyacınız var? Freelance üzerinden sipariş edin
Freelance'e git
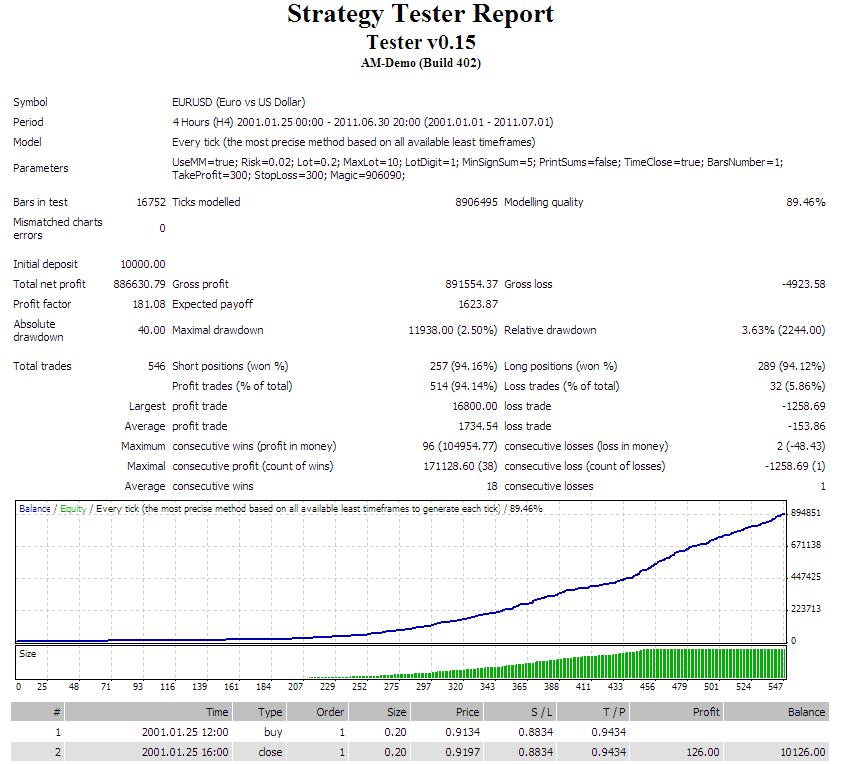
Description:
This is an example only - how optimization results can be edited in a text editor and used by the Expert Advisor.
The signals were found by the optimizer of MT4 strategy tester, and all of these signals are used above profit factor 2. Many of these signals appeared only one time in the whole history, that's why more different type of signals must confirm each other.
"MinSignSum" setting means the number of these confirmations and it should never be less than 4!!
Shared only to show this method, how even beginner coders also can create real trading monsters :)
It's not recommended for live trading at all!
* first version is updated - v0.15 - some mistakes are corrected
Backtest using forextester data, with default settings, 2001.01.01 - 2011.06.30. (test starts from the 100th H4 bar)
 MMR
MMR
Combines a strategy based on MA crossover with RSI and MACD confirmation by cmillion
Heiken Ashi w/ Doji Spotter
This is the standard Heiken Ashi, but with the option to spot Dojis and color them differently.
 EMAplusWPR_V2
Expert advisor that trade in the trend of EMA and buy/sell signals get from Williams %R
Welch Bollinger Band ® Width
This uses the standard Bollinger Band calculations to further calculate the width of the Upper and Lower Bands, comparing that number to the Max and Min width of the bands for the last N periods. The results are plotted onto a histogram.