Fan sayfamıza katılın
Öyleyse bir link gönderin -
başkalarının da faydalanmasını sağlayın
- Görüntülemeler:
- 28618
- Derecelendirme:
- Yayınlandı:
- Güncellendi:
-
Bu koda dayalı bir robota veya göstergeye mi ihtiyacınız var? Freelance üzerinden sipariş edin Freelance'e git
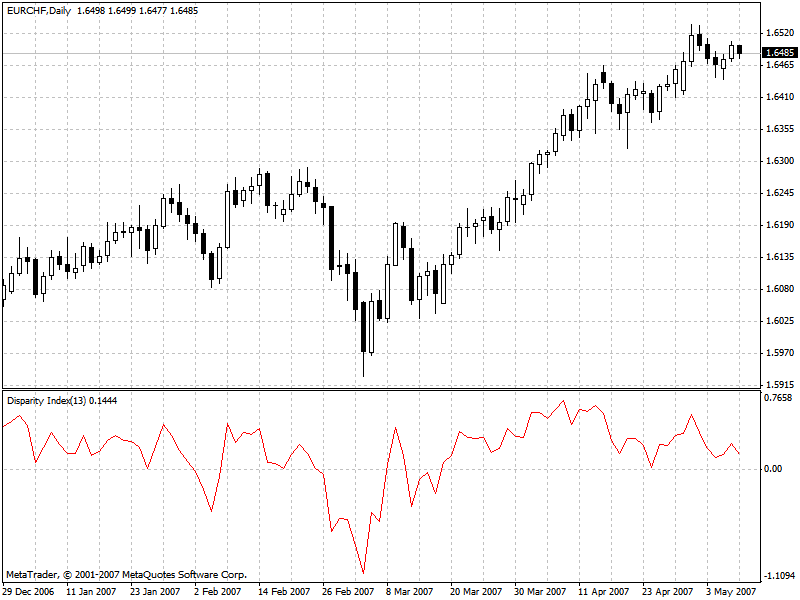
Steve Nison refers to his Disparity Index as "a percentage display of the latest close to a chosen moving average." This can be defined mathematically using the formula:
[Mov(C,X,MA) ] * 100
Where X is the number of time periods and MA is the calculation type of the moving average. For more in depth interpretation of the Disparity Index refer to Steve Nison's book "Beyond Candlesticks", Chapter 5

 Stoller Average Range Channels
This code is simple variation of Bollinger Bands code which comes with Metatrader4, if we change Standard Deviation by ATR we have StarcBands.
 Waddah Attar Weekly CAMERILLA
This Indicatro Draw Weekly CAMERILLA Levels H1 H2 H3 H4 L1 L2 L3 L4 with back test.
 Waddah Attar RSI Level
You never see like this indicator before. This indicator draw Dayly RSI Level on your chart like CAMERILLA and Pivot. The levels is very powerful and very matchful. Try it quickly.
 i-Breakeven
i-Breakeven groups the open position by symbol and for the each of group shows: 1. The current equity level. 2. The estimated breakeven level.