

Reversal Zones Pro indicator is now on sale.
https://www.mql5.com/ru/market/product/122205?source=Site+Profile+Seller
Characteristics and operating principle of the indicator - Reversal Zones Pro .
In order to correctly use any analysis algorithm, it is necessary to fully understand the principle of its operation.
Let's start with the most important thing - a description of the indicator itself. So , Reversal Zones Pro is built on the basis of the modernized indicator ATR stands for Average True Range, which is translated as "average true range". This indicator is used to analyze the scale of price fluctuations over a given period of time. The key point is the limited nature of the period under consideration. For example, on a chart with a five-minute interval, you can observe significant volatility with wide ranges of candles, while the daily candle can remain within the average values. A striking example of such a situation is the end of the month. On the last trading day, volatility on shorter time intervals increases sharply, while on longer-term periods, changes remain insignificant. In short, the ATR indicator is needed to assess volatility over a certain period of time.
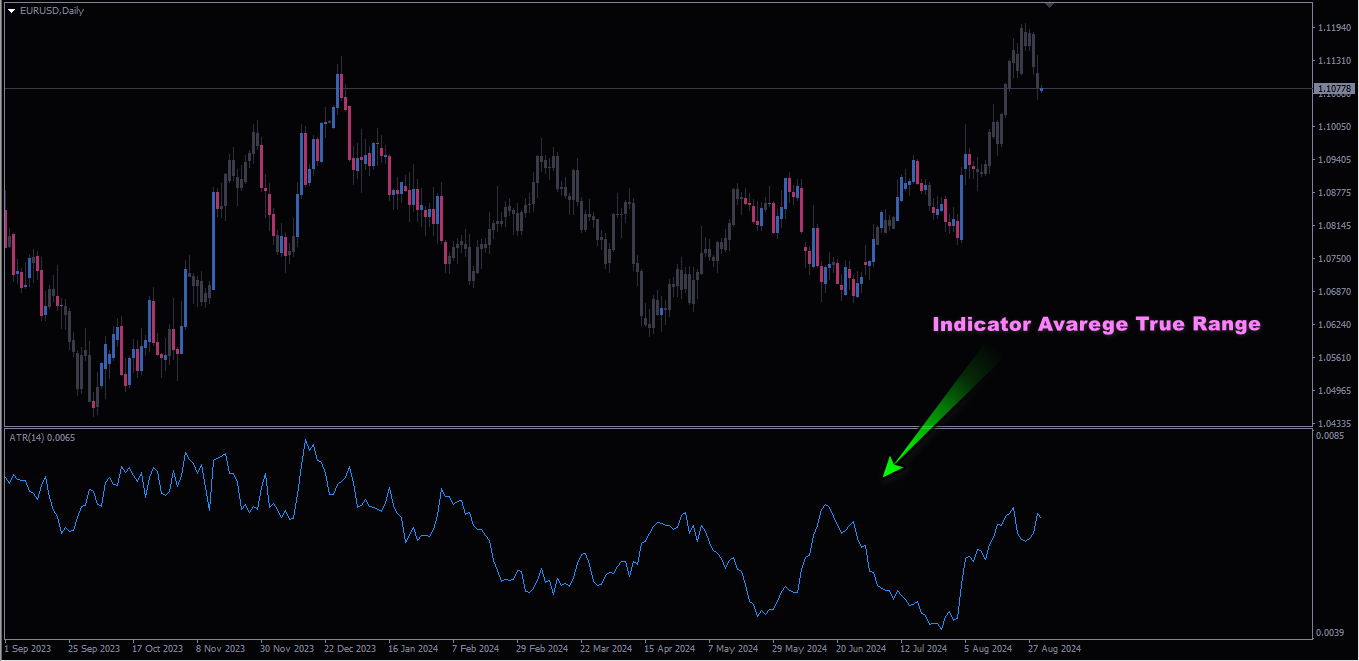
What is the ATR indicator used for?
Traders actively use mathematical methods of analysis, including the ATR indicator in trading. The main areas of application are:
-
assessing the state of the market as a filter;
-
using ATR to calculate the loss limit for a transaction;
-
finding a point to exit a transaction.
The above areas are not the only ones, ATR is often present in strategies as one of the elements of analysis. The indicator is also often found in automated trading systems. The adviser cannot determine the current state of the market “by eye”, it needs a mathematical formula. And in this case, the ATR index comes to the rescue
Calculation of the ATR indicator using the formula
The author of the indicator is the famous stock market analyst Wells Wilder.
In his book, Wilder suggests paying attention to the trading range. This involves a certain calculation, which is based on the main indicators of the trading period selected for analysis. Within any candle (or bar, whichever is more convenient), you can highlight 4 main indicators:
-
minimum;
-
maximum;
-
opening;
-
closing.
These are the well-known OHLC, which can be enabled in the Metatrader trading terminal. The ATR volatility indicator calculates the maximum range of a candle. In most cases, this will be the distance from the minimum to the maximum. In some cases, if the candle has no lower or upper shadow, then the maximum coincides with the closing or opening, and the same is true for the minimum. The essence does not change from this, the indicator only cares about the range of the candle.
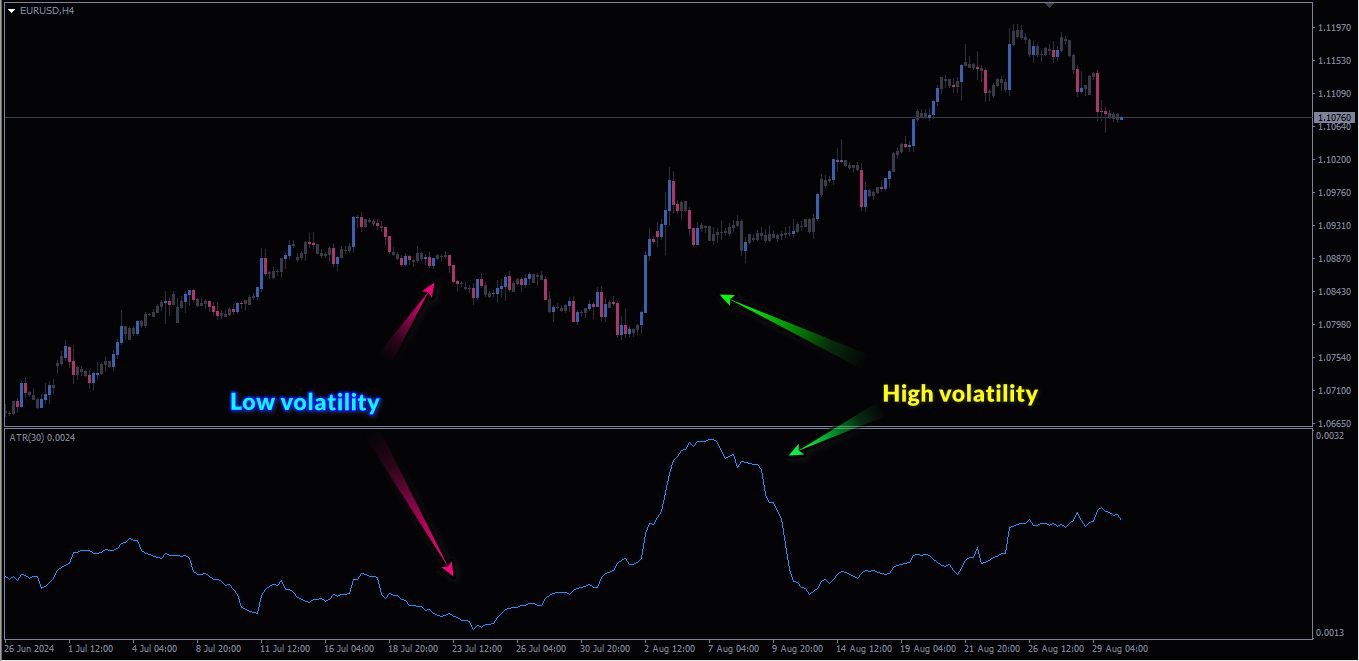
The next important point is the period. The calculations presented above are carried out for one candle, they cannot be representative. That is, one current candle will not tell us anything about what is happening, it only states the mood of the participants and their activity specifically for this period of time. Therefore, as in many other indicators, the ATR index provides for the setting of such a parameter as a period. What is it for? Let's consider a specific example.
Let's assume that we have a sequence of 5 trading days of one week. On Monday, the price was very active, on Tuesday it showed a weak range. And Wednesday, Thursday and Friday were even more dynamic than Monday. If we looked only at Tuesday's data, we would see weak activity. And within the average value for the week, the ATR volatility indicator shows a large range of candles. And here there are two main points related to changing the period:
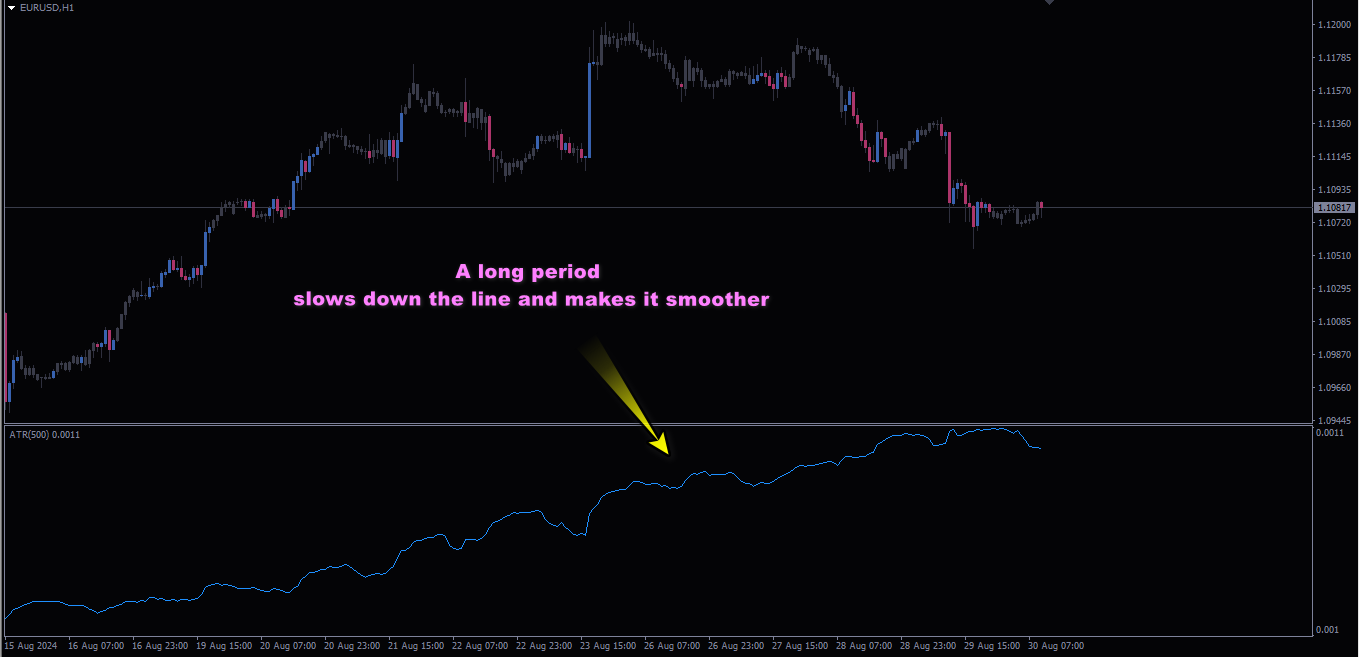
-
If you increase the period value, the average value will change more smoothly. That is, after the increase in traders' activity, ATR will gradually grow. And the longer the period, the slower, since the current candles with a large range will have a smaller value in the total mass of ranges calculated by the indicator;
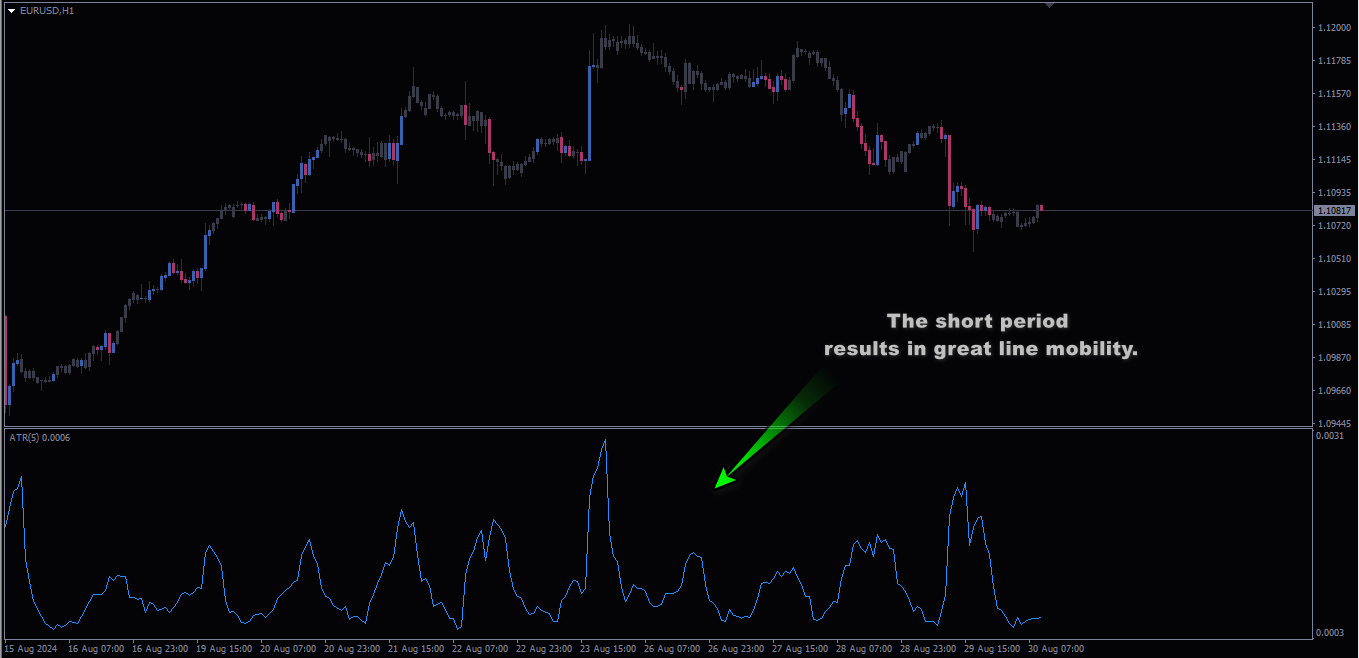
-
Reducing the period leads to the opposite situation - Average True Range changes its value faster. With small periods, even one candle with a very large range can significantly change the ATR value. It is one thing when such a candle is one of 25, and another when it is one of 5.
It is necessary to select the period in the context of a specific task. Most often, various trading strategies specify the parameter values for all indicators, the ATR index is no exception. The authors of the systems independently select such values that are most effective within the framework of their trading algorithms. If we are talking about the simple use of the indicator as an auxiliary tool for assessing the state of the market, then values within 14-20 bars are usually used. On a daily chart, this will be about 3-4 weeks. In general, a fairly representative period of time that shows the volatility value within the trading cycle. Each month consists of different phases. It all starts with cautious behavior of traders, then activity increases and at the end of the month there is a fixation. If we talk about H4 charts, then the value of 18-30 will be relevant here, which corresponds to 3-5 trading days. Simply put, we select the value of the ATR period so that it corresponds to some whole periods on a larger scale. Many traders use the value of 14.
This method of calculating the construction for full visualization is quite complex.
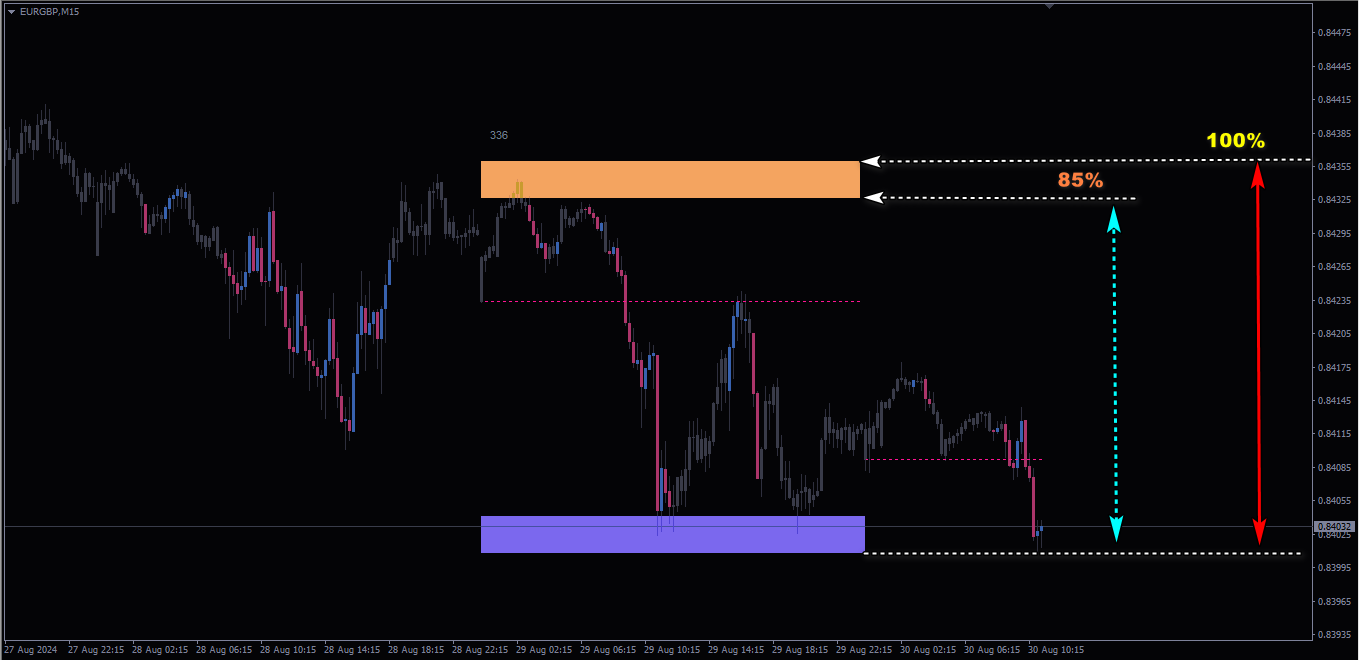
Therefore, I have specially developed the Reversal Zones Pro indicator, which structures the received data and visually displays potential key reversal zones in a convenient, comfortable form. According to statistics, most often, after 85% excess of average volatility, there is a high probability of price correction to the average value. Since each trading session and the total daily volatility of the instrument has its own specific range of price passage, for example, the instrument has an average daily volatility of 1000 pips and if the price passes from this range of 850 pips, then this may indicate that the potential for movement may end (or, more simply, the fuel for further price growth has run out). At a minimum, this may indicate a price correction or even a full-fledged reversal.
Construction calculation methods:
For smaller Timeframes M-1. M-5. M-15, I recommend calculating the average volatility from 3 to 5 days inclusive. For example, to calculate the construction of zones for the Timeframe M15, 4 hourly candles are taken into account, multiplied by 24 hours and then multiplied by the number of days - 5 days, we get the result of weekly volatility for the Timeframe m-15.
Formula: 4x1x24x5 = 480, this is daily volatility.
For Timeframes M-1 and M-5, the calculation is made in exactly the same way according to the formula based on the number of 1 hour candles.
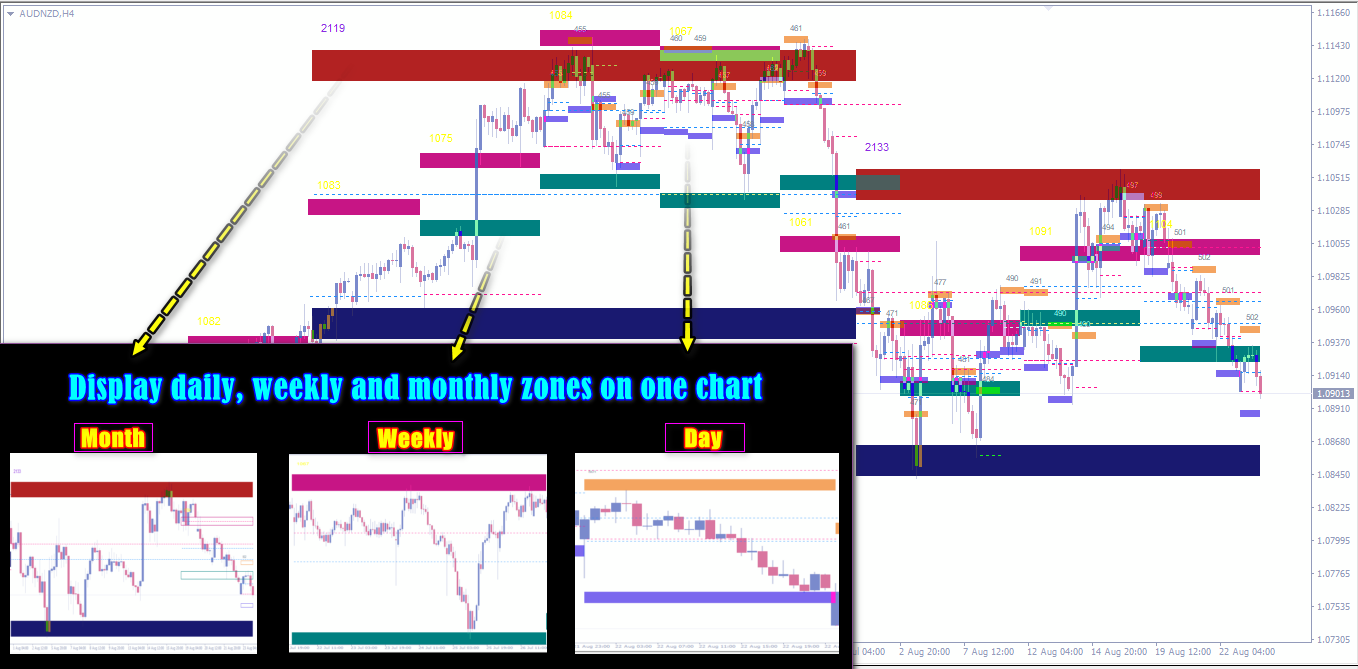
Next, we will analyze the annual volatility for constructing daily, weekly and monthly zones.
Calculation parameters:
For daily zones 260 days,
For weekly 52 weeks,
For monthly zones 12 months.
You can also use: monthly, quarterly, semi-annual, biennial average volatility for the calculation.
Recommendations :
Additionally, it is recommended to produce statistics and regularly adjust the parameters for each instrument.


 на 21-04-2025")
")