• 미리보기
  • 리뷰
  • 코멘트

CalculateScientificTradePeriod

Firstly, the script estimates how many Mx bars of the chart (on which this script is applied) the future trend will most likely continue and what is its quality.

Secondly (and most importantly), the script is an auxiliary tool for the extremely mathematically advanced and extremely effective ScientificTrade indicator in trading.

The script calculates the optimal averaging period, which is also equal to Mx, of the ScientificTrade indicator, which gives the maximum profit according to the strategy of this indicator.

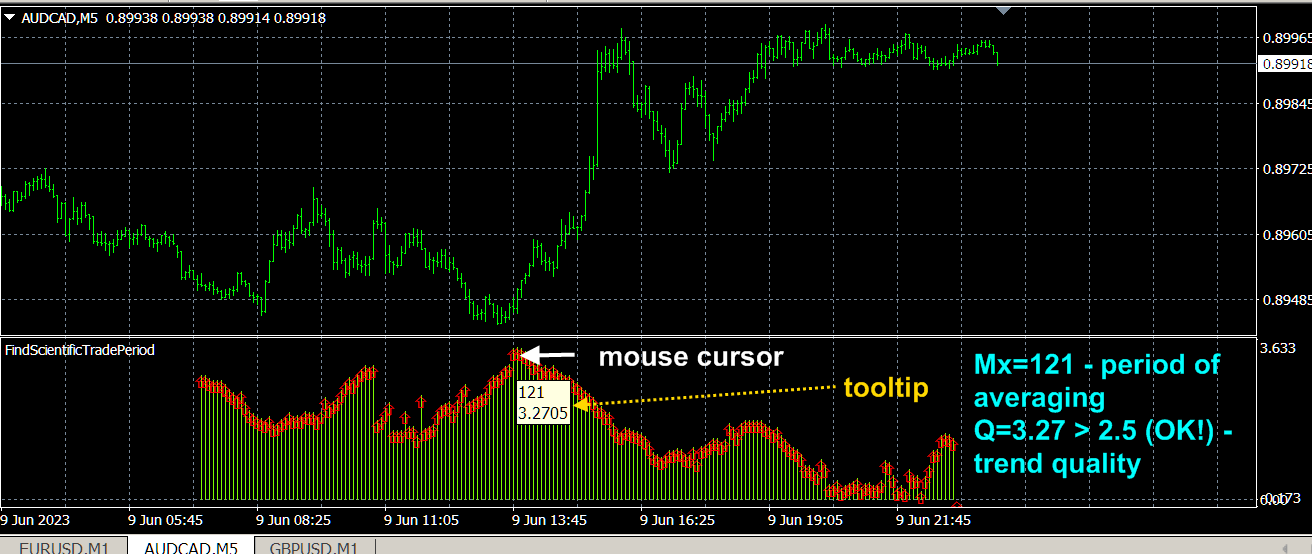
To display the data of the CalculateScientificTradePeriod script, you need to download the FindScientificTradePeriod indicator, on the scale of which these data are displayed.

On the horizontal (time for conventional indicators) axis of the FindScientificTradePeriod indicator, the averaging period "M" is plotted, and on the vertical axis, the forecast values of certain parameters calculated by the CalculateScientificTradePeriod script are plotted.  By default, the CalculateScientificTradePeriod script predicts the trend quality indicator Q (which is described by the Quality trend indicator in real time and on the price history) on a set of future time periods starting with a length of 10 bars from the current bar into the future and ending with a length of 200 bars from the current bar of the corresponding timeframe , which forms the function Q(M) of the  quality of the trend  future trend at different time intervals.  The optimal period Mx corresponds to the maximum Mx=max Q(M) of the trend quality function, which (maximum) is located according to the chart displayed by the FindScientificTradePeriod indicator. To determine the optimal period to the maximum of the function (to the red bar), you need to move the mouse cursor and the value of this period and the value of this function will be displayed in the tooltip.  At the same time, you need to look for a smoothly drawn maximum without random beats of the displayed parameter, which are mainly characteristic of small intervals.  The desired maximum value should be greater than 2.5.


Script settings.

  • Spectrum of computed values 10<M<200  The maximum calculated averaging period. Values: Any positive integer between 11 and 200. Default is 200.
  • Estimated price fluctuation . Estimated price fluctuation in standard deviations. The default is 3.0. Should be the same as in the ScientificTrade indicator.
  • Mode. Operating mode. Values: S(M)/M Profit growth rate,  S(M) Profit,  Q(M) Trend Quality (default),  P(M) Probability of winning.


추천 제품
Now, you have your own AUTO-CLOSE program ! Once your account target or drawdown hits, all open orders will be closed automatically. ========================================== INPUTS: Account target: Put the exact account target. Once the equity hits it or went above that, all orders closed. Please add buffer to consider slippage. Use fixed value or dynamic value: Choose whether you will need a fixed value or dynamic value for drawdown.  DYNAMIC SETTINGS: Equity-based or Balance-based drawdown:
To achieve mutual support between MT4 and MT5, and to purchase the MT5 version, please click here>> Main follow-up function: 1. Reverse order capability 2. Cross platform follow-up, ignoring different names 3. Proportional order, magnification and reduction order 4. Compared to a specified currency pair, not compared to a specified currency pair 5. Can be ordered one to many, many to one, any order 6. Other unclear messages 6. Other unclear messages.
Commodity Channel Index Message is an indicator for the MetaTrader 4 trading platform. Unlike the original indicator, this three in one version has a system of alerts that inform on market situation changes. It consists of the following signals: when the Main line crosses the levels of extreme zones and 50% level; when the Main line crosses the Trend line in the indicator window; Divergence on the last bar. Values of the middle and extreme levels and divergence zones are customizable. Parameter
Watermark Symbol
Makarii Gubaydullin
차트에 워터 마크:기호+기간/또는 자신의 텍스트 내#1 유틸리티 :38+기능을 포함| 당신은 질문이있는 경우 저에게 연락 표시기의 설정에서 구성 할 수 있습니다: 글자크기; 텍스트 색상; 글꼴 이름; 위치: 1=왼쪽 상단; 2=오른쪽 상단; 3=왼쪽 하단; 4=오른쪽 하단; 5=센터; 현재 시간 프레임 표시:켜기/끄기; 제거 할 기호의 접두사는 다음과 같습니다.; 제거 할 기호의 접미사(미화 치사한 사람 프로-->미화 치사한 사람); 사용자 정의 텍스트 표시:활성화하면 아래에 지정된 자신의 텍스트가 표시됩니다: 나만의 워터마크; 내#1 유틸리티 :38+기능을 포함| 당신은 질문이있는 경우 저에게 연락 ..................................
PW Oscillator
Svyatoslav Kucher
5 (1)
PW Oscillator   - индикатор предназначенный для поиска локальных экстремумов, определения текущей тенденции. В расчетах индикатора используется авторская методика. С помощью индикатора можно определять места возможного разворота цены желательно в направлении тенденции, но также с достаточной точностью и против нее. Также с помощью индикатора можно определять текущую тенденцию. Индикатор подходит для любых валютных пар, но для адекватного отображения показания необходимо, чтобы было достаточно ис
ChangePeriod MT4
Kazuya Yamaoka
You can change the time period of the chart at the touch of a button. You can also change multiple charts at the touch of a button. You can also change multiple charts at the touch of a button, saving you the trouble of changing time periods. We are live-streaming the actual operation of the system. https://www.youtube.com/@ganesha_forex We do not guarantee your investment results. Investments should be made at your own risk. We sharll not be liable for any disadvantage or damage caused by th
손익분기점을 자동으로 설정하는 유틸리티로, 주어진 거리를 지나갈 때 거래를 손익분기점으로 전환합니다. 위험을 최소화할 수 있습니다. 상인을 위해 전문 상인이 만들었습니다. 유틸리티는 거래자가 수동으로 또는 고문을 사용하여 개설한 모든 시장 주문과 함께 작동합니다. 매직 넘버로 거래를 필터링할 수 있습니다. 유틸리티는 동시에 원하는 수의 주문을 처리할 수 있습니다. MT5 버전 https://www.mql5.com/ru/market/product/57077 유틸리티가 할 수 있는 일: 1핍에서 가상 손익분기점 설정 실제 수준의 손익분기점 설정 각 주문에 대해 개별적으로 작업(손익분기 수준은 각 주문에 대해 별도로 설정됨) 단방향 주문 바구니로 작업(손익분기 수준은 모든 주문에 대해 공통으로 설정되고 별도로 구매 및 판매) 양방향 주문 바스켓으로 작업(손익분기 수준은 모든 주문에 대해 공통으로 설정되며, 함께 구매 및 판매) 테스트 및 작업을 위해 차트의 버튼을 사용할 수 있습니
Auto Fibo Pro m
DMITRII GRIDASOV
"Auto FIBO Pro" Crypto_Forex 지표 - 거래에 유용한 보조 도구입니다! - 지표는 자동으로 Fibo 수준과 로컬 추세선(빨간색)을 계산하여 차트에 배치합니다. - Fibonacci 수준은 가격이 반전될 수 있는 주요 영역을 나타냅니다. - 가장 중요한 수준은 23.6%, 38.2%, 50%, 61.8%입니다. - 역전 스캘핑이나 존 그리드 거래에 사용할 수 있습니다. - Auto FIBO Pro 지표를 사용하여 현재 시스템을 개선할 수 있는 기회도 많습니다. - Info Spread Swap Display가 있습니다. 현재 Spread와 Swap이 부착된 외환 쌍을 표시합니다. - 디스플레이에는 계정 잔액, 자본 및 마진도 표시됩니다. - 차트의 어느 모서리에서나 Info Spread Swap Display를 찾을 수 있습니다. 0 - 왼쪽 상단 모서리, 1 - 오른쪽 상단, 2 - 왼쪽 하단, 3 - 오른쪽 하단. // 훌륭한 트레이딩 로봇과 지표는 여기
Marks Market Imbalance / Fair Value Gaps / Improper Price Action On The Chart . As traders continue to search for the best trading indicators to guide their investments, the   I mbalance   / I mproper   P rice   A ction   / F air   V alue   G ap   I ndicator has become increasingly popular. This indicator helps to identify opportunities   for taking profit . The indicator begins by scanning the markets for imbalance-improper price action events, allowing traders to immediately see when markets
红盘手交易助手,该EA不会自动交易,属于辅助工具,参考4小时图表波动率参数,自动给订单设置止损和止盈,以及追踪止损。策略带有风控标准,如下<1K为50 >1K<1W为100, >1W<5W为500, >5W<10W为1000, >10<20为2000。最大的特色是资金管理和风控功能。显示信号为5日平滑均线方向,布林线中轨平仓功能,开仓警报提醒功能,手数资金恢复功能,该EA可以在历史数据测试时下单,所以它相当于复盘工具。注意EA会修改所不带止损和止盈品种的定单,并执行风控标准。EA参数经过实盘反复验证和优化,可以直接使用默认参数。        参数与功能: FixBuy_target 指定后统一修改当前品种所有多单的止盈价; FixSell_target 指定后统一修改当前品种所有空单的止盈价; 一比一恢复资金 默认不启用,启用盈利按固定亏损金额数字平仓; Boll_close_order 默认不启用,启用后价格遇到布林线(周期30)中轨平仓; Lots 设置固定手数,开启UseMM后无效; UseMM 默认启用资金管理; 风险系数 启用; ATR止损基数 默认按4小时
BreakEven Line is a very useful and easy to use indicator. In case of multiple positions opened on the same instrument, the indicator shows the breakeven point where it is possible to close the positions. Its graphic simplicity makes it an unobtrusive and customizable tool. You can enable/disable a line on a chart, so you can make the indicator invisible. Inputs Show cumulative BE (line on/off) Breakeven line color (to change the line color) Breakeven line style Breakeven line width Show short B
Alerts Pro
Dmitry Zhezhera
This indicator is a simple and handy tool, the main tasks of which are: Remind the trader of the approaching closing of the current bar. Visually display the remaining time on the chart before the end of the current bars of the charts with periods M1, M5, M15, M30 and H1. Notify the trader of the breakdown of High and/or Low bar set in the indicator settings. Notify the trader of the breakdown of the specified trend lines. In addition, notify the trader about the server connection loss.  Setting
The script allows to close part of opened position if this position has some profit. You just need to drop this script on the chart with a desired currency pair.  Let's say you have 1 lot for a Long position with positive profit. With this script you can close any part of the 1 lot (input parameter LotCoeff from 0.1 to 0.9) and remain (for example, 0.4 lot) will have a BreakEven StopLoss. Before placing an opposite orders, the input window is opened allowing you to modify all input parameters: 
UPD1 Pivot Levels
Vitaliy Kuznetsov
5 (1)
지표는 전날을 기준으로 계산된 클래식 피벗 수준을 차트에 표시합니다. 수식을 계산할 시간을 선택할 수 있습니다. 반전을 위해 플랫에서 거래하십시오. 트렌드 시장에서 이들을 타깃으로 삼으세요. 성공적인 거래를 위한 전략과 결합하십시오. 레벨은 버퍼를 사용하여 작성되고 사용 가능한 전체 견적 내역에 표시됩니다. 입력 매개변수. Start Hour - 몇 시부터 하루의 시작을 계산합니다. 00 - 기본값. Show Mid Pivots - 중간 수준 표시. Visual Button - 버튼 표시(활성화/비활성화). Corner - 버튼 앵커 각도. X indent - 픽셀의 수평 패딩. Y indent - 픽셀의 수직 패딩. Label Visual - 디스플레이 레벨 레이블. Label Font Size   - 글꼴 크기. Label Shift Bars   - 비문의 들여쓰기(촛불의 수). Label Tooltip   - 레벨 위의 커서 아래에 텍스트 표시. Levels Styl
FREE
Lot Risk Calculator is a panel for order size calculation according to stop loss and allowed risk per trade. The calculation is performed for the symbol the indicator is launched at. You can set risk and stop loss manually in the panel. The stop loss is set considering 4 or 5 digits, for example, 20 - 4-digit, 200 - 5-digit. After editing each parameter, press Enter to confirm. To calculate a lot, click Calculate. The result appears below the button. Note! Set the panel for all necessary symbols
News Scalping Executor Pro is an utility which helps to trade high impact and huge volatility   news . This utility helps to create two opposite orders with risk management and profit protection. It moves automatically stop loss level to avoid losses as much as possible by using many different algorithms. It helps to avoid trading the news if spread suddenly becomes very huge. It can lock profit by moving stop loss or partially closing of orders. To be profitable with this type of trading you
The "InfoBox" utility is designed to display the presence of open orders, the number of lots, current profit and much more in one window. The version for the MT5 platform   is here . You've probably encountered a situation where you have an advisor that works on a currency pair, but information about its operation: - orders and their number, the size of the spread for the instrument, the volume of lots on the market, drawdown and much more - are scattered in different places of the terminal and
Easy Virtual Trader
Anoop Sivasankaran
4.89 (9)
Setup Easy Virtual Trader > Input your Rules > You are ready to trade from mobile or another EA or anywhere....Let robot manage your Trades !  This powerful EA will help you manage ALL or SPECIFIC trades automatically based on your PRE-SET rules and settings Once it is setup and running on just one chart, you don't need to monitor your orders anymore, the software will keep watching and control your orders with your predefined rules You can trade from your desktop MT4 or from your mobile appli
Savage Trades M.T.A.  is a Manual Trade Assistant expert advisor. This EA contains self-adaptive market algorithm, which uses price action patterns and standard trading indicators. 1.) Quickly Execute trade entries with the click of a button with your own predetermined Stop Loss and Take Profit. 2.) Non-Repainting retracement and reversal warnings indicated by arrows and system alert. 3.) Auto adjusting Support and Resistance levels with strength indicated by color shade. 4.) Auto adjusting Fibo
Candlestick Pattern Scanner is a multi-timeframe and multi-symbol dashboard and alert system that checks all timeframes and currency pairs for different candlestick patterns that are formed in them. Scanner is integrated with support and resistance zones so you can check the candlestick patterns in the most important areas of the chart to find breakout and reversal patterns in the price chart. Download demo version   (works on M30,D1,W1 timeframes and 20 symbols of Market Watch window) Read the
Panel "panel_kjutaMultiTerminal" for trading. Opens, modifies, closes and deletes trading and pending orders from the chart using virtual lines, buttons and the active information terminal. Automatically opens an order by indicator levels. Hints in Russian, English or disabled. It has a number of functions for trailing virtual Take Profit lines and limit orders. Displays information on the active information terminal.  Hides and includes virtual lines S/L , T / P, buttons "<>","M","X", as well a
Owl smart levels
Sergey Ermolov
4.28 (36)
MT5 버전  |   FAQ Owl Smart Levels Indicator 는   Bill Williams 의 고급 프랙탈, 시장의 올바른 파동 구조를 구축하는 Valable ZigZag, 정확한 진입 수준을 표시하는 피보나치 수준과 같은 인기 있는 시장 분석 도구를 포함하는 하나의 지표 내에서 완전한 거래 시스템입니다. 시장과 이익을 취하는 장소로. 전략에 대한 자세한 설명 표시기 작업에 대한 지침 고문-거래 올빼미 도우미의 조수 개인 사용자 채팅 ->구입 후 나에게 쓰기,나는 개인 채팅에 당신을 추가하고 거기에 모든 보너스를 다운로드 할 수 있습니다 힘은 단순함에 있습니다! Owl Smart Levels   거래 시스템은 사용하기 매우 쉽기 때문에 전문가와 이제 막 시장을 연구하고 스스로 거래 전략을 선택하기 시작한 사람들 모두에게 적합합니다. 전략 및 지표에는 눈에 보이지 않는 비밀 공식 및 계산 방법이 없으며 모든 전략 지표는 공개되어 있습니다. Owl Smart Leve
Account Protector Metatrader 4
Emmanuel Lovski Ijeawele Maduagwuna
Account Protector Meta Trader 4 This utility prevents risk of ruin per trading cycle.  Retail forex trading accounts are designed with   stop out levels   that make it impossible to quickly restore lost trading capital   (to initial levels)   in the event of a human or algorithm trader  " blowing"   an account. This hampers the efforts of a trader who after growing an account investment to a multiple of its initial value, suddenly suffers irreparable loss because of several trade entry mishaps.
Scalping Day Trading Support Utility Scalping One for MT4 setting faile (for white Chart)    http://www.emkyuradias.shop/indexenglish.html One position is displayed with one button. View P & L, Lot, and Point in real time. It is possible to switch the display of positions of only chart currencies and all currency pairs.   Supports automatic identification in Japanese and English   Account currency notation corresponds to dollar, euro, pound, yen (automatic identification) Lot, take profit and
EA Hedger
Sergej Chukhista
4 (4)
거래 고문을 구입했습니까, 신호를 구독했습니까, 아니면 수동으로 거래하고 있습니까?! 위험 관리를 잊지 마십시오. EA Hedger   는 헤징을 사용하여 위험을 관리할 수 있는 다양한 설정이 있는 전문 거래 유틸리티입니다. 헤징은 이미 열려 있는 포지션의 반대 포지션을 여는 거래 기법입니다. 헤징을 통해 위치를 완전히 또는 부분적으로 차단(잠금)할 수 있습니다. 이 제품을 사는 것이 유익한 이유: 신뢰성   - 어드바이저가 철저히 점검 및 테스트되었습니다. 유용성 -전문가 고문은 실제 거래에 사용되며 그 작업에 효과적입니다 성능 -위험 회피와 거래의 결과는 위험 회피없이 거래의 결과보다 훨씬 낫다 가용성 -고문의 비용은 한 달에$4.91 또는 하루에$0.17 입니다-이것은 1-2 스프레드입니다 지원   – 토론에서 판매자에게 질문하고 조언을 얻을 수 있습니다. 개발   - 제품에 대한 희망 사항을 작성할 수 있으며 가능한 경우 추가됩니다. 업데이트   - 예정된 업데이트를 사용할
Утилита для автоматического выставления уровней стоплосс и тейкпрофит. Создан профессиональным трейдером для трейдеров.   Утилита   работает с любыми рыночными ордерами, открытыми трейдером вручную или при помощи советников. Может фильтровать сделки по магическому номеру. Одновременно утилита может работать с любым количеством ордеров.  MT5 version  https://www.mql5.com/ru/market/product/56486 ЧТО МОЖЕТ УТИЛИТА: выставлять виртульные стоплосс и тейкпрофит от 1 пипса реальные  стоплосс и тейкпроф
Vizzion
Joel Protusada
Vizzion is a fully automated scalping Expert Advisor that can be run successfully using GBPJPY currency pair at H1 timeframe. Very Important This Expert Advisor can not run with any EAs in the same account. As part of the money management plan, it calculates and monitors the Margin Level % and assumes that all open trades are created by it. If you want an Expert Advisor that trades in a daily basis, this EA is not for you because using this requires a patience to wait for a few days or weeks on
This product is a multi-functional MT4 indicator and is an indispensable tool for account information statistics, strategy analysis and risk assessment. Functions: 1. Statistical account basic information of profit and loss . 2. Statistics and display the account profit and loss fund curve. 3. Display the order's track on chart ,so that we can analys the strategy and risk of the account. 4 .List account's trade pairs and order totals ,we also can see the profits of each pair. If you have any qu
History Pattern Search
Yevhenii Levchenko
표시기는 현재 시세를 작성하여 과거 시세와 비교할 수 있으며 이를 바탕으로 가격 변동을 예측합니다. 표시기에는 원하는 날짜로 빠르게 이동할 수 있는 텍스트 필드가 있습니다. 옵션: 기호 - 표시기가 표시할 기호 선택. SymbolPeriod - 지표가 데이터를 가져올 기간 선택. IndicatorColor - 표시기 색상. HorisontalShift - 지시자가 그린 따옴표를 지정된 막대 수만큼 이동합니다. Inverse - true는 인용 부호를 반대로, false - 원래 보기를 반전합니다. ChartVerticalShiftStep - 차트를 수직으로 이동합니다(키보드의 위/아래 화살표). 다음은 날짜를 입력할 수 있는 텍스트 필드의 설정으로, '엔터'를 누르면 즉시 이동할 수 있습니다.
VR Cub
Vladimir Pastushak
VR Cub 은 고품질 진입점을 얻는 지표입니다. 이 지표는 수학적 계산을 용이하게 하고 포지션 진입점 검색을 단순화하기 위해 개발되었습니다. 지표가 작성된 거래 전략은 수년 동안 그 효율성을 입증해 왔습니다. 거래 전략의 단순성은 초보 거래자라도 성공적으로 거래할 수 있다는 큰 장점입니다. VR Cub은 포지션 개시 지점과 이익 실현 및 손절매 목표 수준을 계산하여 효율성과 사용 편의성을 크게 높입니다. 간단한 거래 규칙을 이해하려면 아래 전략을 사용한 거래 스크린샷을 살펴보세요. 설정, 세트 파일, 데모 버전, 지침, 문제 해결 등은 다음에서 얻을 수 있습니다. [블로그] 다음에서 리뷰를 읽거나 작성할 수 있습니다. [링크] 버전 [MetaTrader 5] 진입점 계산 규칙 포지션 개설 진입점을 계산하려면 VR Cub 도구를 마지막 최고점에서 마지막 최저점까지 늘려야 합니다. 첫 번째 지점이 두 번째 지점보다 빠른 경우, 거래자는 막대가 중간선 위에서 마감될 때까지 기다립니다
이 제품의 구매자들이 또한 구매함
Trade Assistant MT4
Evgeniy Kravchenko
4.43 (182)
거래당 위험 계산, 라인을 사용한 손쉬운 신규 주문, 부분 청산 기능을 통한 주문 관리, 7가지 유형의 트레일링 스탑 및 기타 유용한 기능을 제공합니다. 추가 자료 및 지침 설치 지침 - 애플리케이션 지침 - 데모 계정용 애플리케이션 평가판 라인 기능       - 차트에 개시선, 손절매, 차익실현을 표시합니다. 이 기능을 사용하면 새로운 주문을 쉽게 하고 개봉 전에 추가 특성을 볼 수 있습니다. 위기 관리       -       위험 계산 기능은 설정된 위험과 손절매 주문의 크기를 고려하여 새 주문의 볼륨을 계산합니다. 이를 통해 손절매 크기를 설정하고 동시에 설정된 위험을 존중할 수 있습니다. 로트 계산 버튼 - 위험 계산을 활성화/비활성화합니다. 필요한 위험 값은 위험 필드에 0에서 100 사이의 백분율 또는 예금 통화로 설정됩니다. 설정 탭에서 위험 계산 옵션을 선택합니다. $ 통화, % 잔액, % 지분, % 자유 마진, % 사용자 정의, % AB 이전 일, % AB
Trade Manager EA에 오신 것을 환영합니다. 이 도구는 거래를 보다 직관적이고 정확하며 효율적으로 만들기 위해 설계된 궁극적인 리스크 관리 도구 입니다. 단순한 주문 실행 도구가 아닌, 원활한 거래 계획, 포지션 관리 및 리스크 제어를 위한 종합 솔루션입니다. 초보자부터 고급 트레이더, 빠른 실행이 필요한 스캘퍼에 이르기까지 Trade Manager EA는 외환, 지수, 상품, 암호화폐 등 다양한 시장에서 유연성을 제공합니다. Trade Manager EA를 사용하면 복잡한 계산은 이제 과거의 일이 됩니다. 시장을 분석하고 진입, 손절 및 익절 수준을 차트의 수평선으로 표시한 후 리스크를 설정하면, Trade Manager가 이상적인 포지션 크기를 즉시 계산하고 SL 및 TP 값을 실시간으로 표시합니다. 모든 거래가 간편하게 관리됩니다. 주요 기능: 포지션 크기 계산기 : 정의된 리스크에 따라 거래 크기를 즉시 결정합니다. 간단한 거래 계획 : 진입, 손절, 익절을 위한
일별 및 주별 마감 거래 내역, 현재 진행 중인 거래, 외환 노출을 한 차트에서 즉시 확인하세요! 히트맵을 사용하여 수익성 있는 거래와 거래 포트폴리오 내에서 현재 하락이 있는 위치를 파악하세요. 빠른 마감 버튼 빠른 마감 버튼을 사용하여 단일 심볼에 대한 모든 거래를 마감하거나, 개별 거래를 전체적으로 마감하거나, 버튼을 클릭하여 일부 수익 또는 손실을 실현하세요. 더 이상 목록에서 거래를 찾아 거래의 일부를 마감하는 방법을 알아낼 필요가 없습니다. 대시보드는 외환 쌍을 거래하는 동안 각 통화 심볼에 대한 현재 노출도 표시하므로 주요 뉴스 이벤트에 앞서 과도하게 노출될 수 있는 영역을 파악하는 데 도움이 됩니다. 버튼을 사용하여 뉴스가 나오기 전에 노출을 즉시 빠르게 줄이거나, 이미 뉴스가 발생하여 수익을 창출한 경우 클릭 한 번으로 빠르게 수익을 확보할 수 있습니다! 진행 중인 거래 히트맵 거래 히트맵은 달러 비용 평균화를 사용하여 거래의 확장 및 축소를 수행하는 포지션 거
Local Trade Copier EA MT4
Juvenille Emperor Limited
5 (87)
Local Trade Copier EA MT4 를 사용하여 매우 빠른 거래 복사 경험을 해보세요. 1분 안에 간편하게 설정할 수 있으며, 이 거래 복사기를 사용하면 Windows 컴퓨터 또는 Windows VPS에서 여러 개의 MetaTrader 터미널 간에 거래를 0.5초 미만의 초고속 복사 속도로 복사할 수 있습니다. 초보자든 전문가든 Local Trade Copier EA MT4 는 다양한 옵션을 제공하여 사용자의 특정 요구에 맞게 맞춤 설정할 수 있습니다. 이는 수익 잠재력을 높이려는 모든 사람을 위한 최고의 솔루션입니다. 지금 사용해보시고 이것이 왜 시장에서 가장 빠르고 쉬운 무역용 복사기인지 알아보세요! 팁: 여기 에서 데모 계정에서 Local Trade Copier EA MT4 데모 버전을 다운로드하여 사용해 볼 수 있습니다. 다운로드한 무료 데모 파일을 MT4 >> File >> Open Data Folder >> MQL4 >> Experts 폴더에 붙여넣고 터미널
MT4 to Telegram Signal Provider 는 사용하기 쉽고 완전히 사용자 정의가 가능한 도구로, 텔레그램으로 신호를 보내어 계정을 신호 제공자로 변환할 수 있습니다. 메시지 형식은 완전히 사용자 정의가 가능합니다! 그러나 간단한 사용을 위해 미리 정의된 템플릿을 선택하고 메시지의 특정 부분을 활성화하거나 비활성화할 수도 있습니다. [ 데모 ]  [ 매뉴얼 ] [ MT5 버전 ] [ 디스코드 버전 ] [ 텔레그램 채널 ] 설정 단계별 사용자 가이드 가 제공됩니다. 텔레그램 API에 대한 지식이 필요 없으며, 개발자가 필요한 모든 것을 제공합니다. 주요 기능 구독자에게 보낸 주문 세부 정보를 사용자 정의할 수 있는 기능 예를 들어 브론즈, 실버, 골드와 같은 계층 구독 모델을 만들 수 있습니다. 골드 구독은 모든 신호 등을 받게 됩니다. ID, 심볼 또는 코멘트별 주문 필터링 주문이 실행된 차트의 스크린샷을 포함 보낸 스크린샷에 종료된 주문을 그려 추가 검증을 제
Exp COPYLOT CLIENT for MT4
Vladislav Andruschenko
4.7 (64)
MetaTrader 4용 트레이드 복사기.       모든 계정의 외환 거래, 포지션, 주문을 복사합니다. 그것은 최고의 무역 복사기 중 하나입니다       MT4 - MT4, MT5 - MT4       위해       카피롯 MT4       버전(또는       MT4 -  MT5   MT5 - MT5       위해       카피롯 MT5       버전). MT5 버전 전체 설명   +DEMO +PDF 구입 방법 설치하는 방법     로그 파일을 얻는 방법     테스트 및 최적화 방법     Expforex의 모든 제품 복사기   버전         MetaTrader 5   터미널 (   МТ5 - МТ5, МТ4 - МТ5   ) -   Copylot Client MT5 고유한 복사 알고리즘은 마스터 계정에서 고객 계정으로 모든 거래를 정확하게 복사합니다. 이 제품은 또한 높은 작동 속도에서 높은 오류 처리로 유명합니다. 강력한 기능 세트. 프로그램은 여러 터
Trade Dashboard MT4
Fatemeh Ameri
5 (43)
Tired of complex order placement and manual calculations? Trade Dashboard is your solution. With its user-friendly interface, placing orders becomes effortless, by a single click, you can open trades, set stop loss and take profit levels, manage trade lot size, and calculate risk to reward ratios, allowing you to only focus on your strategy. Say goodbye to manual calculations and streamline your trading experience with Trade Dashboard. Download  Demo Version  right now. You can find  Details of
The product will copy all telegram signal to MT4   ( which you are member  ) , also it can work as remote copier.  Easy to set up, copy order instant, can work with almost signal formats, image signal, s upport to translate other language to English Work with all type of channel or group, even channel have "Restrict Saving Content", work with  multi channel, multi MT5 Work as remote copier: with signal have ticket number, it will copy exactly via ticket number. Support to backtest signal. How to
Trade Manager MT4 DaneTrades
Levi Dane Benjamin
4.33 (9)
거래 관리자는 위험을 자동으로 계산하는 동시에 거래를 빠르게 시작하고 종료하는 데 도움을 줍니다. 과잉 거래, 복수 거래 및 감정 거래를 방지하는 데 도움이 되는 기능이 포함되어 있습니다. 거래를 자동으로 관리할 수 있으며 계정 성과 지표를 그래프로 시각화할 수 있습니다. 이러한 기능은 이 패널을 모든 수동 거래자에게 이상적으로 만들고 MetaTrader 4 플랫폼을 향상시키는 데 도움이 됩니다. 다중 언어 지원. MT5 버전  |  사용자 가이드 + 데모 트레이드 매니저는 전략 테스터에서 작동하지 않습니다. 데모를 보려면 사용자 가이드로 이동하세요. 위기 관리 % 또는 $를 기준으로 위험 자동 조정 고정 로트 크기 또는 거래량과 핍을 기반으로 한 자동 로트 크기 계산을 사용하는 옵션 RR, Pips 또는 Price를 사용한 손익분기점 손실 설정 추적 중지 손실 설정 목표 달성 시 모든 거래를 자동으로 마감하는 최대 일일 손실률(%)입니다. 과도한 손실로부터 계정을 보호하고 과도한
거래하고자 하는 주요 영역을 파악한 후 자동으로 거래 지원 및 저항 또는 공급 및 수요 구역을 설정합니다. 이 EA를 사용하면 한 번의 클릭으로 매수 및 매도 구역을 그린 다음 가격이 바뀔 것으로 예상되는 정확한 위치에 배치할 수 있습니다. 그런 다음 EA는 해당 구역을 모니터링하고 구역에 대해 지정한 가격 액션에 따라 자동으로 거래를 수행합니다. 초기 거래가 수행되면 EA는 대상 구역이 되는 반대 구역에서 이익을 얻습니다. 그런 다음 거래를 종료하고 진입할 새 구역을 그리거나 이익을 얻고 즉시 반대 방향으로 거래를 역전하여 "항상 시장" 스타일 전략을 만드는 두 가지 선택이 있습니다. 입력 및 전략이 포함된 전체 매뉴얼은 여기에 있습니다: https://www.mql5.com/en/blogs/post/760256 이 EA는 시장에서 고정 또는 하드 스톱 로스를 사용하지 않는 포지션 트레이더 또는 달러 비용 평균 거래 전략을 위해 설계되었습니다. 대신, 다음에 가능한 지지 또는
Grid Manual MT4
Alfiya Fazylova
4.71 (17)
"Grid Manual"은 주문 그리드 작업을 위한 거래 패널입니다. 이 유틸리티는 보편적이며 유연한 설정과 직관적인 인터페이스를 제공합니다. 그것은 손실을 평균화하는 방향뿐만 아니라 이익을 증가시키는 방향으로 주문 그리드와 함께 작동합니다. 거래자는 주문 그리드를 만들고 유지할 필요가 없으며 유틸리티에서 수행합니다. 거래자가 주문을 시작하는 것으로 충분하며 "Grid Manual"는 자동으로 그를 위한 주문 그리드를 생성하고 거래가 마감될 때까지 그와 동행할 것입니다. 전체 설명 및 데모 버전 여기 . 유틸리티의 주요 기능: 모바일 터미널을 포함하여 어떤 방식으로든 열린 주문과 함께 작동합니다. "제한" 및 "중지"의 두 가지 유형의 그리드와 함께 작동합니다. 고정 및 동적(ATR 표시기 기반)의 두 가지 유형의 그리드 간격 계산과 함께 작동합니다. 오픈 오더 그리드의 설정을 변경할 수 있습니다. 차트에서 각 주문 그리드의 손익분기점 수준을 표시합니다. 각 주문 그리드에 대한 이익
The Expert Advisor will help you forward all pop-up alert with screenshot from  MetaTrader 4 to Telegram channel/ group, also forward all notifications to Telegram. Parameters  -  Telegram Bot Token - create bot on Telegram and get token.  -  Telegram Chat ID  - input your Telegram user ID,  group / channel ID  -  Forward Alert - default true, to forward alert.  -  Send message as caption of Screenshot - default false, set true to send message below Screenshot  How to setup and guide  - Telegram
Exp SafetyLock PRO
Vladislav Andruschenko
4.7 (27)
SAFETYLOCK을 사용하면 거래자는 이미 열린 포지션에 대해 반대 주문을 설정하여 강한 시장 반전을 피할 수 있습니다. 거래자 또는 EA가 포지션을 열면, SAFETYLOCK은 자동으로 반대 방향의 보류 주문을 설정합니다. 포지션이 손실 상태로 전환되면, 이 보류 주문이 활성화되어 잠금(락)을 생성하여 손실을 최소화합니다. EA는 초기 포지션을 닫거나, 후행 정지를 사용하여 수익을 최적화하거나, 로트를 증가시켜 거래 전략을 강화하는 다양한 옵션을 제공합니다. 또한, 포지션 가격에 맞추어 미결 주문의 오픈 가격을 조정하여 시장 움직임에 유연하게 대응할 수 있습니다. 전체 설명 +DEMO +PDF 구입 방법 설치하는 방법     로그 파일을 얻는 방법     테스트 및 최적화 방법     Expforex의 모든 제품 매개변수 기본(블로그의 매개변수에 대한 전체 설명) MilliSecondsTimerForMonitoring – 알고리즘 실행 시간을 밀리초 단위로 설정합니다(기본
TradePanel MT4
Alfiya Fazylova
4.9 (86)
Trade Panel은 다기능 거래 보조원입니다. 이 애플리케이션에는 수동 거래를 위한 50개 이상의 거래 기능이 포함되어 있으며 대부분의 거래 작업을 자동화할 수 있습니다. 전략 테스터에서는 애플리케이션이 작동하지 않습니다. 구매하기 전에 데모 계정에서 데모 버전을 테스트할 수 있습니다. 데모 버전 여기 . 전체 지침 여기 . 거래. 한 번의 클릭으로 거래 작업을 수행할 수 있습니다: 자동 위험 계산을 통해 지정가 주문 및 포지션을 엽니다. 한 번의 클릭으로 여러 주문과 포지션을 열 수 있습니다. 주문 그리드를 엽니다. 그룹별 대기 주문 및 포지션을 마감합니다. 포지션 반전(매수 청산 후 매도 개시 또는 매도 청산 후 매수 개시). 포지션 고정(매수 포지션과 매도 포지션의 양을 동일하게 하는 추가 포지션 개설). 한 번의 클릭으로 모든 포지션을 부분 청산합니다. 모든 포지션의 이익실현과 손절매를 동일한 가격 수준으로 설정합니다. 모든 포지션에 대한 손절매를 해당 포지션의 손익 분기
Custom Alerts: 여러 시장을 동시에 모니터링하고 중요한 기회를 놓치지 마세요 개요 Custom Alerts 는 여러 종목에서 발생하는 잠재적 세트업을 중앙 집중 방식으로 추적하고자 하는 트레이더를 위한 역동적인 솔루션입니다. FX Power, FX Volume, IX Power 등 주요 도구들의 데이터를 통합하여 Custom Alerts 는 여러 차트를 번갈아 보거나 중요한 기회를 놓칠 위험 없이, 시장의 중요 변화를 자동으로 알려 줍니다. 보다 스마트하고 효율적인 트레이딩을 원하신다면, Custom Alerts 를 통해 모니터링 능력을 한 단계 끌어올려 보세요. 1. 왜 Custom Alerts가 트레이더에게 매우 유용한가 올인원 시장 모니터링 • Custom Alerts 는 8대 주요 통화, 골드, 그리고 최대 7개의 지수 혹은 상품을 포함한 다양한 종목의 신호를 수집 및 통합합니다. • 여러 차트를 계속 전환할 필요 없이 명확하고 집중된 알림을 받아 볼 수 있
Telegram To MT4 Receiver
Levi Dane Benjamin
5 (4)
당신이 멤버인 어떤 채널에서든(비공개 및 제한된 채널 포함) 신호를 직접 MT4로 복사하세요.  이 도구는 사용자를 고려하여 설계되었으며 거래를 관리하고 모니터하는 데 필요한 많은 기능을 제공합니다. 이 제품은 사용하기 쉽고 시각적으로 매력적인 그래픽 인터페이스로 제공됩니다. 설정을 사용자 정의하고 제품을 몇 분 안에 사용하십시오! 사용자 가이드 + 데모  | MT5 버전 | Discord 버전 데모를 시도하려면 사용자 가이드로 이동하십시오. Telegram To MT5 수신기는 전략 테스터에서 작동하지 않습니다! Telegram To MT4 특징 한 번에 여러 채널에서 신호를 복사합니다. 비공개 및 제한된 채널에서 신호를 복사합니다. Bot 토큰이나 채팅 ID가 필요하지 않습니다(필요한 경우 계속 사용할 수 있음). 위험 % 또는 고정된 로트를 사용하여 거래합니다. 특정 심볼을 제외합니다. 모든 신호를 복사할지 복사할 신호를 사용자 정의할지 선택합니다. 모든 신호를 인식하기
Ultimate Trailing Stop EA
BLAKE STEVEN RODGER
4.33 (15)
This EA Utility allows you to manage (with advanced filtering) unlimited open orders (manual or EA) with 16 trailing stop methods: fixed, percent, ATR Exit, Chandelier Exit, Moving Average, Candle High Low Exit, Bollinger Bands, Parabolic, Envelope, Fractal, Ichimoku Kijun-Sen, Alligator, Exit After X Minutes or Bars, RSI and Stochastic. The trailing stop can be either real or virtual, and you can exit fully or with a partial close percent on touch or bar close.  Moreover, you can add (overrid
Eezeorder 2
Tawanda Tinarwo
5 (2)
NEW VERSION!  NB: IF YOU ARE USING A VERY HIGH RESOLUTION MACHINE AND THE EA DISPLAY LOOKS TOO SMALL, CONTACT ME SO I CAN HELP YOU. Open Multiple Trades on MT4 in 1 click at one price. Enter the Lot size Specify the number of trades you want to open Choose whether you want TP SL or Trailing Stop Once you are done, click Buy or Sell Open Multiple Pending Orders on MT4 in 1 click at one price. Enter the Lot size Specify the gap from the current price, where you want to place the pending order Spe
Risk Manager for MT4
Sergey Batudayev
4.6 (10)
MT4의 Expert Advisor Risk Manager는 매우 중요하며 제 생각에는 모든 거래자에게 필요한 프로그램입니다. 이 Expert Advisor를 사용하면 거래 계정의 위험을 제어할 수 있습니다. 위험 및 이익 통제는 금전적 측면과 백분율 측면에서 모두 수행될 수 있습니다. Expert Advisor가 작동하려면 통화 쌍 차트에 첨부하고 예금 통화 또는 현재 잔액의 %로 허용되는 위험 값을 설정하기만 하면 됩니다. PROMO BUY 1 GET 2 FREE -   https://www.mql5.com/en/blogs/post/754725 어드바이저 기능 이 위험 관리자는 위험을 제어하는 ​​데 도움이 됩니다. - 거래를 위해 - 하루 - 일주일 동안 - 한 달 동안 당신은 또한 제어할 수 있습니다 1) 거래 시 최대 허용 랏 2) 1일 최대 주문 수 3) 하루 최대 수익 4) 지분 인수 이익 설정 그게 다가 아닙니다. 설정에서 자동 설정을 지정하면 고문이
Take a Break
Eric Emmrich
5 (30)
The most advanced news filter on MQL market - free demo available Take a Break has transformed from a basic news filter into a comprehensive account protection solution. It seamlessly pauses any other Expert Advisors during news events or based on your custom filters, all while safeguarding your EA settings - restoring them automatically when trading resumes for complete peace of mind. Typical use cases: A single news filter for all your EAs. Stop trading during news/high volatility (+ close all
Exp4 Duplicator
Vladislav Andruschenko
4.5 (22)
Expert Advisor   는   귀하의 계정 MetaTrader 4   에서 사전 설정된 횟수만큼 거래 및 포지션을 반복하거나 신호를 보냅니다. 수동으로 또는 다른 Expert Advisor에 의해 열린 모든 거래를 복사합니다. 신호를 복사하고 신호에서 로트를 늘립니다   ! 다른 EA의 수를 늘립니다. 다음 기능이 지원됩니다: 복사된 거래에 대한 사용자 지정 로트, 손절매 복사, 이익 실현, 후행 정지 사용. MT5 버전 전체 설명 +DEMO +PDF 구입 방법 설치하는 방법     로그 파일을 얻는 방법     테스트 및 최적화 방법     Expforex의 모든 제품 연결 MetaTrader용 무역 복사기는 여기에서 사용할 수 있습니다:   COPYLOT 주목 참고: 터미널 간 거래를 위한 복사기가 아닙니다. 전략 테스터에서 Expert Advisor를 테스트하고 비주얼 모드에서 EAPADPRO 도구 모음과 거래할 수 있습니다! 1개의 통화 쌍에 EA를 설치하는 것
Ultimate Trade Copier
BLAKE STEVEN RODGER
5 (1)
This trade copy utility allows you to instantly and seamlessly replicate and synchronize unlimited orders from multiple master accounts to multiple slave accounts on your local machine. You can create custom channels (or portfolios) with advanced filtering capabilities to copy from multiple master accounts to multiple slave accounts. Moreover, you can tailor these channels with a range of lot sizing and trade condition options to ensure that copied trades outperform the original source. You can
News Trapper EA
Noha Mohamed Fathy Younes Badr
4.85 (13)
Hi, all.  News trapper EA It is an expert for trading news very safe expert  Automated Trading on the news of the economic calendar. It shows stable trading during last 10  years. EA doesn't use dangerous technologies like martingale, grid. The Expert is very simple to use.      sale will end after 48 h how to install it     and set files     read the blog         after purchase contact me to add you to   VIP   channel  The program contains flexible settings for trading on the news of the econo
Summer 40% discount ($149 -> $88) Everything for chart Technical Analysis indicator mt4 in one tool Draw your supply demand zone with rectangle and support resistance with trendline and get alerts to mobile phone or email alert -  Risk reward indicator Video tutorials, manuals, DEMO download   here .  Find contacts on my   profile . 1.   Extended rectangles and trendlines Object will be extended to the right edge of the chart when price will draw new candles on chart. This is rectangle extende
Transform Your Trading with the MT4 to MT4/5 Local Trade Copier. Seamlessly bridge the gap between two trading platforms with a user friendly interface for a easy to use copier. User Guide + Demo  |   MT5 Version Local Trade Clone MT4 does not work in the Strategy Tester. For a   demo   please go to the   User Guide To Copy to MT5 you will need to purchase the MT5 version separately  Features Copy trades across MT4 and MT5 in any combination (MT4>MT4, MT4>MT5, MT5>MT4, MT5>MT5). Easy to use G
Bar Replay MT4
Hoang The Manh
3.43 (7)
Don't purchase before testing the Demo version first. DEMO version:   https://www.mql5.com/en/market/product/76917 __________________________________________________ This EA  - Tool allow you replay bar in Meta Trader 4 for back test. This Tool can back test in multi timeframe in only one chart. This Tool is very useful for Price action trader. It can work with Indicators, some indicators cannot works. So please download Demo to test before purchase.  Demo Version We do not accept refund in any
Trading History MT4
Siarhei Vashchylka
5 (10)
Trading History - A program for trading and money management on the history of quotes in stratagy tester. It can work with pending and immediate orders, and is equipped with trailing stop, breakeven and take profit functions. Very good for training and testing different strategies. Manual (Be sure to read before purchasing) Advantages 1. Allows you to test any trading strategy in the shortest possible time 2. An excellent simulator for trading training. You can gain months of trading experience
TPSpro Trade PRO
Roman Podpora
4.6 (5)
주어진 손절매 수준에 따라 포지션 크기나 위험을 즉시 계산할 수 있는 도구는 전문 트레이더와 초보 트레이더 모두에게 중요합니다. TRADE PRO 트레이딩 유틸리티는 빠르고 정확한 계산을 제공하여 시간에 민감하고 변동성이 큰 시장에서 결정을 내리는 데 도움이 됩니다. 추가 설치 재료 응용 프로그램 설명서       – 평가판을 다운로드하세요       MT4       -       MT5 MT5 버전 주요 기능: 독창적. 단순. 효과적. 메인 거래 패널을 독창적이고 편리하게 여는 방법: 차트의 오른쪽으로 마우스를 이동하고 적절한 방향을 클릭하여 미래 주문을 하세요. 시장 주문의 빠른 설치 TRADE PRO로 잔액 또는 자본의 위험을 감수할 비율을 설정하거나, 위험을 감수할 특정 금액을 지정하세요. 차트에서 손절매 수준을 시각적으로 정의하여 도구가 각 통화 쌍에 대한 최적의 포지션 크기를 자동으로 계산할 수 있도록 하세요. 도구는 지정된 위험/보상 비율에 따라 이익 목표(이익 실
VirtualTradePad mt4 Extra
Vladislav Andruschenko
4.88 (57)
한 번의 클릭으로 거래할 수 있는 거래 패널.   위치 및 주문 작업!   차트 또는 키보드에서 거래. 거래 패널을 사용하면 차트에서 클릭 한 번으로 거래하고 표준 MetaTrader 컨트롤보다 30배 빠르게 거래 작업을 수행할 수 있습니다. 거래자의 삶을 더 쉽게 만들고 거래자가 훨씬 빠르고 편리하게 거래 활동을 수행할 수 있도록 도와주는 매개변수 및 기능의 자동 계산. 차트의 무역 거래에 대한 그래픽 팁 및 전체 정보. MT5 버전 전체 설명   +DEMO +PDF 구입 방법 설치하는 방법     로그 파일을 얻는 방법     테스트 및 최적화 방법     Expforex의 모든 제품 열기 및 닫기, 반전 및 잠금, 부분 닫기/오토로트. 가상/실제 손절매/이익 실현/후행 정지/손익분기점, 주문 그리드 .... MetaТrader 4   의 주요 요청 거래 제어판   : 구매, 판매, 구매 중지, 구매 제한, 판매 중지, 판매 제한, 닫기, 삭제, 수정, 후행 중지, 손절매,
MT4 to Discord Signal Provider 는 Discord로 직접 거래 신호를 보내는 데에 설계된 사용자 친화적이고 완전히 맞춤화할 수 있는 유틸리티입니다. 이 도구는 귀하의 거래 계좌를 효율적인 신호 제공자로 변환합니다. 귀하의 스타일에 맞게 메시지 형식을 사용자 정의하세요! 사용 편의성을 위해 사전에 디자인된 템플릿을 선택하고 포함하거나 제외할 메시지 요소를 선택할 수 있습니다. [ 데모 ] [ 매뉴얼 ] [ MT5 버전 ] [ Telegram 버전 ] 설정 간편한 설정을 위해 저희의 상세한 사용자 가이드 를 따르세요. Discord API에 대한 사전 지식이 필요 없습니다; 필요한 모든 도구를 제공합니다. 주요 기능 구독자 업데이트를 위한 주문 세부 정보를 사용자 정의합니다. 각 계층이 다른 수준의 신호 접근을 제공하는 브론즈, 실버, 골드와 같은 계층적 구독 모델을 구현합니다. 주문이 실행된 차트의 스크린샷을 첨부합니다. 더 명확하게 하기 위해 이 스크린샷에
제작자의 제품 더 보기
Identify Trend
Aleksey Ivanov
4.09 (23)
"추세 식별" 표시기는 매우 정확하고 가장 중요한 것은 짧은 지연으로 진정한 추세 움직임의 시작을 확립할 수 있는 강력한 필터링 방법을 사용합니다. 지표는 거래 스캘퍼 전략과 장기 거래 전략 모두에 사용할 수 있습니다.              지표 평균 알고리즘은 마지막 스크린샷에 나와 있습니다.               표시기 판독값은 명확하고 매우 간단하며 설명이 필요하지 않습니다. 지표의 파란색 선은 상승 추세를 표시하고 금색 선은 플랫, 빨간색 선은 하락 추세를 나타냅니다.  빨간색 또는 금색 선이 파란색으로 바뀌면 바이 로트가 열려야 합니다. 파란색 또는 금색 라인이 빨간색으로 변경되면 매도 포지션이 열립니다.         가격 변경 방향의 가능한 순간은 어떤 상황에서도 다시 그려지지 않는 화살표로 표시됩니다. 표시기는 모든 유형의 알림을 포함합니다. 표시 지침(추세 방향에 대한)이 마지막 두 막대에서 일치할 때 경고가 트리거됩니다.     표시기 설
FREE
TrueChannel
Aleksey Ivanov
5 (7)
The TrueChannel   indicator shows us the true price movement channels. This indicator resembles Donchian Channel   in its appearance, but is built on the basis of completely different principles and gives (in comparison with Donchian Channel , which is better just to use to assess volatility) more adequate trading signals.              As shown in the article , the price actually moves in channels parallel to the time axis and jumps abruptly from the previous channels to the subsequ
FREE
Absolute Bands
Aleksey Ivanov
4.67 (3)
Principles of construction of the indicator.               The Absolute Bands (AB) indicator is reminiscent of the Bollinger Bands indicator with its appearance and functions, but only more effective for trading due to the significantly smaller number of false signals issued to them. This effectiveness of the Absolute Bands indicator is due to its robust nature.               In the Bollinger Bands indicator, on both sides of the moving average - Ma, there are lines spaced from Ma by the standa
FREE
Prof MACD
Aleksey Ivanov
5 (1)
I present an indicator for professionals. Prof MACD is very similar to classic MACD in appearance and its functions . However, Prof MACD is based on completely new algorithms (for example, it has only one averaging period) and is more robust, especially on small timeframes, since it filters random price walks. The classic MACD indicator (Moving Average Convergence / Divergence) is a very good indicator following the trend, based on the ratio between two moving averages, namely the EMA
Profit MACD
Aleksey Ivanov
5 (2)
I present an indicator for professionals. ProfitMACD is very similar to classic MACD in appearance and its functions . However, ProfitMACD is based on completely new algorithms (for example, it has only one averaging period) and is more robust, especially on small timeframes, since it filters random price walks. The classic MACD indicator (Moving Average Convergence / Divergence) is a very good indicator following the trend, based on the ratio between two moving averages, namely the EM
Channel Builder
Aleksey Ivanov
4.67 (3)
The Channel Builder (CB) or Ivanov Bands indicator is a broad generalization of the Bollinger Bands indicator. First, in CB, the mean line <X> is calculated using various averaging algorithms. Secondly, the mean deviations calculated by Kolmogorov averaging are plotted on both sides of the middle line <X>.                The middle line <X>, besides the standard SMA, EMA, SMMA and LWMA averaging algorithms, can be Median = (Max + Min) / 2 sliding median (which is the default). In
FREE
Alligator Analysis
Aleksey Ivanov
5 (1)
Indicator description.            The “ Alligator Analysis ” ( AA ) indicator allows you to build various (by averaging types and by scales) “ Alligators ” and their combinations, i.e. allows you to analyze the state of the market based on the correlation of this state with a whole range of different " Alligators ".  The classic " Alligator " by Bill Williams is based on moving averages and Fibonacci numbers, which makes it one of the best indicators now. The classic " Alligator "   is based on
FREE
PDP indicator is used for: defining price probability distributions. This allows for a detailed representation of the channel and its borders and forecast the probability of a price appearing at each segment of its fluctuations; defining the channel change moment. Operation principles and features PDP analyzes a quote history on lower timeframes and calculates a price probability distribution on higher ones. Forecast algorithms allow the indicator to calculate probability distributions and mov
Signal Bands
Aleksey Ivanov
Signal Bands is a sensitive and convenient indicator, which performs deep statistical processing of information. It allows to see on one chart (1) the price trend, (2) the clear price channel and (3) latent signs of trend change. The indicator can be used on charts of any periods, but it is especially useful for scalping due to its high sensitivity to the current market state. The functions of the indicator : First, the Signal Bands indicator draws channels into which all price fluctuations exa
Iterative Moving Average
Aleksey Ivanov
5 (1)
Iterative Moving Average – IMA.   IMA is obtained by correcting the usual   MA.   The correction consists in addition   to MA averaged difference between the time series (X) and its MA, i.e.   IMA(X)=MA(X) + MA ( Х -MA(X)). Correction is done in several iterations (and, exactly, 2 iterations in this indicator) and with a change in the averaging period.               As a result, the time-series points begin to cluster around (on all sides) of the getting   IMA and with a smaller de
Structure of the indicator.               The Cunning crocodile indicator consists of three moving averages (applied to the price   Median price   = (high + low)/2 ) :   1) the usual MA ( SMA , EMA , SMMA ,   LWMA )  or the mean <X> of the process X and her two generalizations 2) <XF> = <X / <X >> * <X> and 3) <XS> = <X * <X >> / <X> with the same averaging period. All three curves intersect at common points that (such an intersection in which the cunning crocodile, unlike the usual one, "never
Sensitive Signal
Aleksey Ivanov
5 (2)
The Sensitive Signal ( SS ) indicator, using the filtering methods  (which includes cluster multicurrency analysis) developed by the author, allows, with a high degree of probability, to establish the beginning of the true (filtered from interference - random price walks) trend movement. It is clear that such an indicator is very effective for trading on the currency exchange , where signals are highly distorted by random noise. The filtration developed by the author is carried out
The principle of the indicator.               A simple moving average (SMA) with an averaging period (2n + 1) of bars is always obtained lagging by n bars. If SMA or other types of moving averages are the basis for making trading decisions, then their strong delay does not allow   to open positions in time and close positions, which leads to losses.                            The Estimation moving average without lag ( EMAWL ) indicator calculates the non-lagging moving average, which is calcula
The principle of the indicator.               The Strong Trend Flat Signal (STFS) indicator is the intersection of two, developed by the author, non-lagging moving averages with averaging periods 21 and 63.               A simple moving average (SMA) with an averaging period (2n + 1) of bars is always obtained lagging by n bars. If SMA or other types of moving averages are the basis for making trading decisions, then their strong delay does not allow  to open positions in time and close positio
StatChannel
Aleksey Ivanov
5 (1)
The principle of the indicator.               The StatChannel ( SC ) indicator is a development of the Bollinger Bands indicator ( ВВ ).  BB is a moving average, on both sides of which two lines are drawn, separated from it by standard deviations std multiplied by the corresponding coefficient. At the same time, a moving average with an averaging period (2n + 1) bars is always obtained lagging behind n bars.  Sliding std is also lagging behind on n bars, also calculated by (2n + 1) points. Such
StatPredict
Aleksey Ivanov
Introduction.             The indicator predicts the price in accordance with the prevailing trend  and its own small statistical price fluctuations around this trend. At the same time, in StatPredict , you need to set the time horizon of the forecasted events, which is set by the parameter settings of the “ Length of forecast in bars ” indicator and determined by the characteristic time scale of the current   trend, which is best measured by the ProfitMACD indicator or by the previous price co
Asummetry
Aleksey Ivanov
The principle of the indicator.                             The Asummetry  indicator allows you to predict the beginning of a change in the direction of trends, long before their visual appearance on the price chart.               The author statistically revealed that before changing the direction of the trend, the probability distribution function of the price is made as asymmetric as possible. More precisely, the price movement in any direction always pulls sideways the function of its dist
Indicator is used for: defining price probability distributions. This allows for a detailed representation of the channel and its borders and forecast the probability of a price appearing at each segment of its fluctuations; defining the channel change moment.   Operation principles and features Indicator analyzes a quote history on lower timeframes and calculates a price probability distribution on higher ones. Forecast algorithms allow the indicator to calculate probability distributions and m
Identify Market State
Aleksey Ivanov
5 (1)
The Identify Market State   indicator allows you to set the beginning of a new trends and pullbacks on an existing trend. This indicator can be used both for trading on scalper strategies and for long-term trading strategies.               The indicator is based on the 14 periodic DeMarker   indicator and the 8 periodic simple moving average from this indicator. Statistical studies have shown that the sharp peaks of the DeMarker   indicator curve when they drop below its minimum li
Signal Envelopes
Aleksey Ivanov
The Signal Envelopes   indicator uses the robust filtering method based on: (1) the moving median Buff0 = <Median> = (Max {x} + Min {x}) / 2 and (2) the averaging algorithm developed by the author Buff1 = <(<Median> ) ^ (- 3)> * (<Median>) ^ 4  based on the moving median. The Signal Envelopes   indicator allows you to most accurately and with the minimum possible delay set the beginning of a new trend.  The Signal Envelopes indicator can be used both for trading according to scalpe
Profit Trade
Aleksey Ivanov
The principle of constructing indicator lines .               Profit Trade  indicator is very effective for trading. Profit Trade  is a deep development of the well-known Donchian channel  indicator. The upper (BlueViolet color) Dup and the lower (IndianRed) Ddn lines of the indicator are constructed in the same way as in the Donchian channel , based on the highest (high of High) and lowest (low of Low) prices for the previous n1 = 20 periods. The middle line (Gold) Dm is constructed in the sam
Signal Channel
Aleksey Ivanov
The principle of constructing indicator lines and their meaning .               The Signal Channel   indicator uses a robust filtering method based on two moving medians applicable to the High and Low prices, i.e. the lines <High> and <Low>, where <..> is the sign of linear averaging, which are shifted by certain values ​​in an uptrend and by opposite values ​​in a downtrend, which allows you to get a narrow channel, approximately outlining each bar. Sharp kinks of the lines of such a channel a
Robust Filter
Aleksey Ivanov
5 (1)
The Robust filter   indicator is based on the robust filtering algorithm developed by the author using the multi-period averaged moving median. The algorithm for this averaging is shown in the last screenshot.                The indicator calculates and shows: 1. The direction of the trend; 2. Entry and exit points of positions; 3. StopLoss   lines calculated from current price probability distributions and selected probability of closing an order by StopLoss before the trend revers
Absolute price
Aleksey Ivanov
This   indicator is intended for professionals assessing fundamental market trends.  This indicator calculates the index of any instrument and analyzes it.              The index of the state currency shows the real purchasing power of this currency, and the dynamics of this index shows the dynamics of the economic state of the corresponding state. An analysis of the indices of both currencies included in a currency pair makes it much more reliable to identify the trend of this cur
The Multicurrency Trend Detector ( MTD ) indicator allows you to immediately and on one chart on a selected time interval (extending from a zero bar to a bar set in the settings by the value horizon) determine the presence, direction and strength of trends in all major currencies, as well as assess the reliability of these trends.               This is achieved by calculating indices (non-relative purchasing power) of eight major currencies, namely: AUD, CAD, CHF, EUR, GBP, JPY, NZ
StatZigZag
Aleksey Ivanov
The StatZigZag  indicator looks like a regular ZigZag , but is built on the basis of completely different algorithms. The StatZigZag  indicator is a broken line built from segments of regression lines of different lengths, the beginning of each of which comes from the end of the previous segment. Each regression segment is built until the variance or spread of price around it begins to exceed a certain critical value, after which the construction of this segment ends and the constr
Velocity of price change
Aleksey Ivanov
5 (1)
The Velocity of price change   ( VP ) indicator shows the average rate of price change at those characteristic time intervals where this rate was approximately constant. The robust algorithm used in VP   to smooth out the price from its random jumps, ensures the reliability of the indicator reading, which does not react to simple price volatility and its insignificant movements.             The indicator allows you to track trends and the moments of their reversals , during which t
Casual Channel
Aleksey Ivanov
5 (1)
차트에서 보는 추세가 항상 수익을 올릴 수 있는 추세는 아닙니다. 트렌드에는 두 가지 종류가 있다:  1)   안정적이고 따라서 거래자에게 신뢰할 수 있는 이익을 제공할 수 있는 근본적인 경제적 이유에 의해 야기되는 진정한 추세;  2)    추세처럼 보이지만 일련의 무작위 이벤트로 인해 발생하는 잘못된 추세 섹션 - 가격(주로)을 한 방향으로 이동. 이러한 잘못된 추세 섹션은 짧고 언제든지 방향을 바꿀 수 있습니다(그리고 일반적으로 식별 후 즉시 역전됨).  따라서 잘못된 추세로 돈을 버는 것은 (우연이 아닌) 불가능합니다. 시각적으로 참과 거짓 추세는 처음에는 구별할 수 없습니다. 더욱이 무작위 가격 변동이나 그에 의해 생성된 잘못된 추세는 항상 실제 추세에 중첩되어 특히 실제 추세에서 후퇴를 일으킬 수 있습니다. 그러한 국지적 역전은 새로운 근본적인 경제적 원인에 의해 야기된 글로벌 역전과 식별되고 구별될 필요가 있습니다.              캐주얼
Quality trend
Aleksey Ivanov
5 (1)
The Quality trend indicator expresses the ratio of the strength of a trend or the speed of its growth (fall) to the degree of its noisiness or a certain norm of amplitudes of chaotic fluctuations of a growing (falling) price. The position of the indicator line above zero shows an increasing trend, below zero - a falling trend, the fluctuation of the indicator line near zero shows a flat. If the indicator line begins to fluctuate rapidly around zero and approach it, then this indica
Scientific trade
Aleksey Ivanov
5 (1)
An extremely convenient indicator that truly makes the process of making money on the exchange easy. It is based on the scientifically rigorous theory of the market developed by the author, the beginning of which is presented here .                The full algorithm of this indicator operation is presented in the article .               The indicator calculates the most probable price movement trajectory and displays it on the chart. Based on the predicted price movement trajectory
필터:
리뷰 없음
리뷰 답변