Matthew Chan / Venditore
Prodotti pubblicati

WARNING: due to the calculations used by this indicator, it may take time to load and running it may slow down the user's terminal
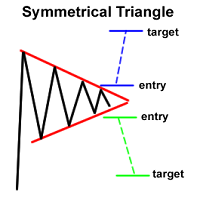
Description & Summary Dashboard to detect Higher-Low/Lower-High breakouts and Triangle Patterns on 28 currency pairs and up to 8 timeframes at once. Numbers on the left are the normalized values of distance between price and last Lower-High and Higher-Low if one has formed (displays "--" if none). Text will turn Red upon a Higher-Low Breakout and Green upon a Lower-