Young Ho Seo / Profilo
- Informazioni
|
10+ anni
esperienza
|
62
prodotti
|
1182
versioni demo
|
|
4
lavori
|
0
segnali
|
0
iscritti
|
https://www.mql5.com/en/market/product/4488
https://www.mql5.com/en/market/product/4475
https://algotrading-investment.com/portfolio-item/harmonic-pattern-plus/
Non Repainting and Non Lagging Harmonic Pattern Indicator – Customizable Harmonic + Japanese Candlestic Pattern Scanner + Advanced Channel + Many more
https://www.mql5.com/en/market/product/41993
https://www.mql5.com/en/market/product/41992
https://algotrading-investment.com/portfolio-item/profitable-pattern-scanner/
Supply Demand Indicator – Multiple Timeframe Scanning Added + Non Repainting + Professional Indicator
https://www.mql5.com/en/market/product/40076
https://www.mql5.com/en/market/product/40075
https://algotrading-investment.com/portfolio-item/ace-supply-demand-zone/
Momentum Indicator – Path to Volume Spread Analysis
https://www.mql5.com/en/market/product/30641
https://www.mql5.com/en/market/product/30621
https://algotrading-investment.com/portfolio-item/excessive-momentum-indicator/
Elliott Wave Indicator for the Power User
https://www.mql5.com/en/market/product/16479
https://www.mql5.com/en/market/product/16472
https://algotrading-investment.com/portfolio-item/elliott-wave-trend/
Forex Prediction - Turn Support and Resistance to the Advanced Strategy
https://www.mql5.com/en/market/product/49170
https://www.mql5.com/en/market/product/49169
https://algotrading-investment.com/portfolio-item/fractal-pattern-scanner/
MetaTrader 4 and MetaTrader 5 Product Page: https://www.mql5.com/en/users/financeengineer/seller#products
Free Forex Prediction with Fibonacci Analysis: https://algotrading-investment.com/2020/10/23/forex-prediction-with-fibonacci-analysis/
Free Harmonic Pattern Signal: https://algotrading-investment.com/2020/12/17/harmonic-pattern-signal-for-forex-market/
============================================================================================================================
Here are the trading education books. We recommend reading these books if you are a trader or investor in Forex and Stock market. In the list below, we put the easy to read book on top. Try to read the easy to read book first and try to read the harder book later to improve your trading and investment.
First Link = amazon.com, Second Link = Google Play Books, Third Link = algotrading-investment.com, Fourth Link = Google Books
Technical Analysis in Forex and Stock Market (Supply Demand Analysis and Support Resistance)
https://www.amazon.com/dp/B09L55ZK4Z
https://play.google.com/store/books/details?id=pHlMEAAAQBAJ
https://algotrading-investment.com/portfolio-item/technical-analysis-in-forex-and-stock-market/
https://books.google.co.kr/books/about?id=pHlMEAAAQBAJ
Science Of Support, Resistance, Fibonacci Analysis, Harmonic Pattern, Elliott Wave and X3 Chart Pattern (In Forex and Stock Market Trading)
https://www.amazon.com/dp/B0993WZGZD
https://play.google.com/store/books/details?id=MME3EAAAQBAJ
https://algotrading-investment.com/portfolio-item/science-of-support-resistance-fibonacci-analysis-harmonic-pattern/
https://books.google.co.kr/books/about?id=MME3EAAAQBAJ
Profitable Chart Patterns in Forex and Stock Market (Fibonacci Analysis, Harmonic Pattern, Elliott Wave, and X3 Chart Pattern)
https://www.amazon.com/dp/B0B2KZH87K
https://play.google.com/store/books/details?id=7KrQDwAAQBAJ
https://algotrading-investment.com/portfolio-item/profitable-chart-patterns-in-forex-and-stock-market/
https://books.google.com/books/about?id=7KrQDwAAQBAJ
Guide to Precision Harmonic Pattern Trading (Mastering Turning Point Strategy for Financial Trading)
https://www.amazon.com/dp/B01MRI5LY6
https://play.google.com/store/books/details?id=8SbMDwAAQBAJ
http://algotrading-investment.com/portfolio-item/guide-precision-harmonic-pattern-trading/
https://books.google.com/books/about?id=8SbMDwAAQBAJ
Scientific Guide to Price Action and Pattern Trading (Wisdom of Trend, Cycle, and Fractal Wave)
https://www.amazon.com/dp/B073T3ZMBR
https://play.google.com/store/books/details?id=5prUDwAAQBAJ
https://algotrading-investment.com/portfolio-item/scientific-guide-to-price-action-and-pattern-trading/
https://books.google.com/books/about?id=5prUDwAAQBAJ
Predicting Forex and Stock Market with Fractal Pattern: Science of Price and Time
https://www.amazon.com/dp/B086YKM8BW
https://play.google.com/store/books/details?id=VJjiDwAAQBAJ
https://algotrading-investment.com/portfolio-item/predicting-forex-and-stock-market-with-fractal-pattern/
https://books.google.com/books/about?id=VJjiDwAAQBAJ
Trading Education Book 1 in Korean (Apple, Google Play Book, Google Book, Scribd, Kobo)
https://books.apple.com/us/book/id1565534211
https://play.google.com/store/books/details?id=HTgqEAAAQBAJ
https://books.google.co.kr/books/about?id=HTgqEAAAQBAJ
https://www.scribd.com/book/505583892
https://www.kobo.com/ww/en/ebook/8J-Eg58EDzKwlpUmADdp2g
Trading Education Book 2 in Korean (Apple, Google Play Book, Google Book, Scribd, Kobo)
https://books.apple.com/us/book/id1597112108
https://play.google.com/store/books/details?id=shRQEAAAQBAJ
https://books.google.co.kr/books/about?id=shRQEAAAQBAJ
https://www.scribd.com/book/542068528
https://www.kobo.com/ww/en/ebook/X8SmJdYCtDasOfQ1LQpCtg
About Young Ho Seo
Young Ho Seo is an Engineer, Financial Trader, and Quantitative Developer, working on Trading Science and Investment Engineering since 2011. He is the creator of many technical indicators, price patterns and trading strategies used in the financial market. He is also teaching the trading practice on how to use the Supply Demand Analysis, Support, Resistance, Trend line, Fibonacci Analysis, Harmonic Pattern, Elliott Wave Theory, Chart Patterns, and Probability for Forex and Stock Market. His works include developing scientific trading principle and mathematical algorithm in the work of Benjamin Graham, Everette S. Gardner, Benoit Mandelbrot, Ralph Nelson Elliott, Harold M. Gartley, Richard Shabacker, William Delbert Gann, Richard Wyckoff and Richard Dennis. You can find his dedicated works on www.algotrading-investment.com . His life mission is to connect financial traders and scientific community for better understanding of this world and crowd behaviour in the financial market. He wrote many books and articles, which are helpful for understanding the technology and application behind technical analysis, statistics, time series forecasting, fractal science, econometrics, and artificial intelligence in the financial market.
If you are interested in our software and training, just visit our main website: www.algotrading-investment.com
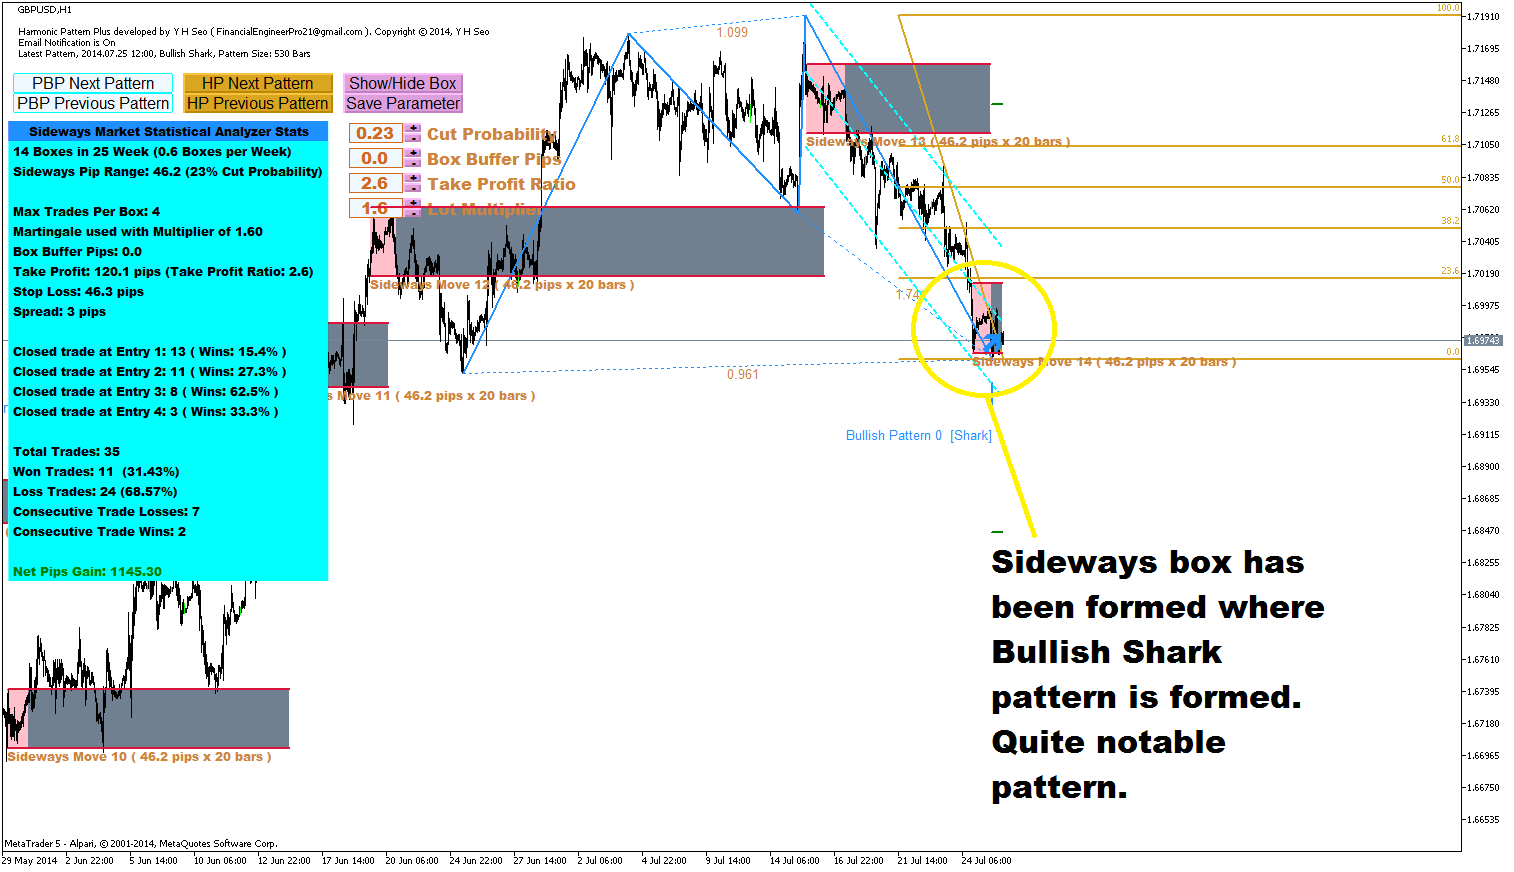
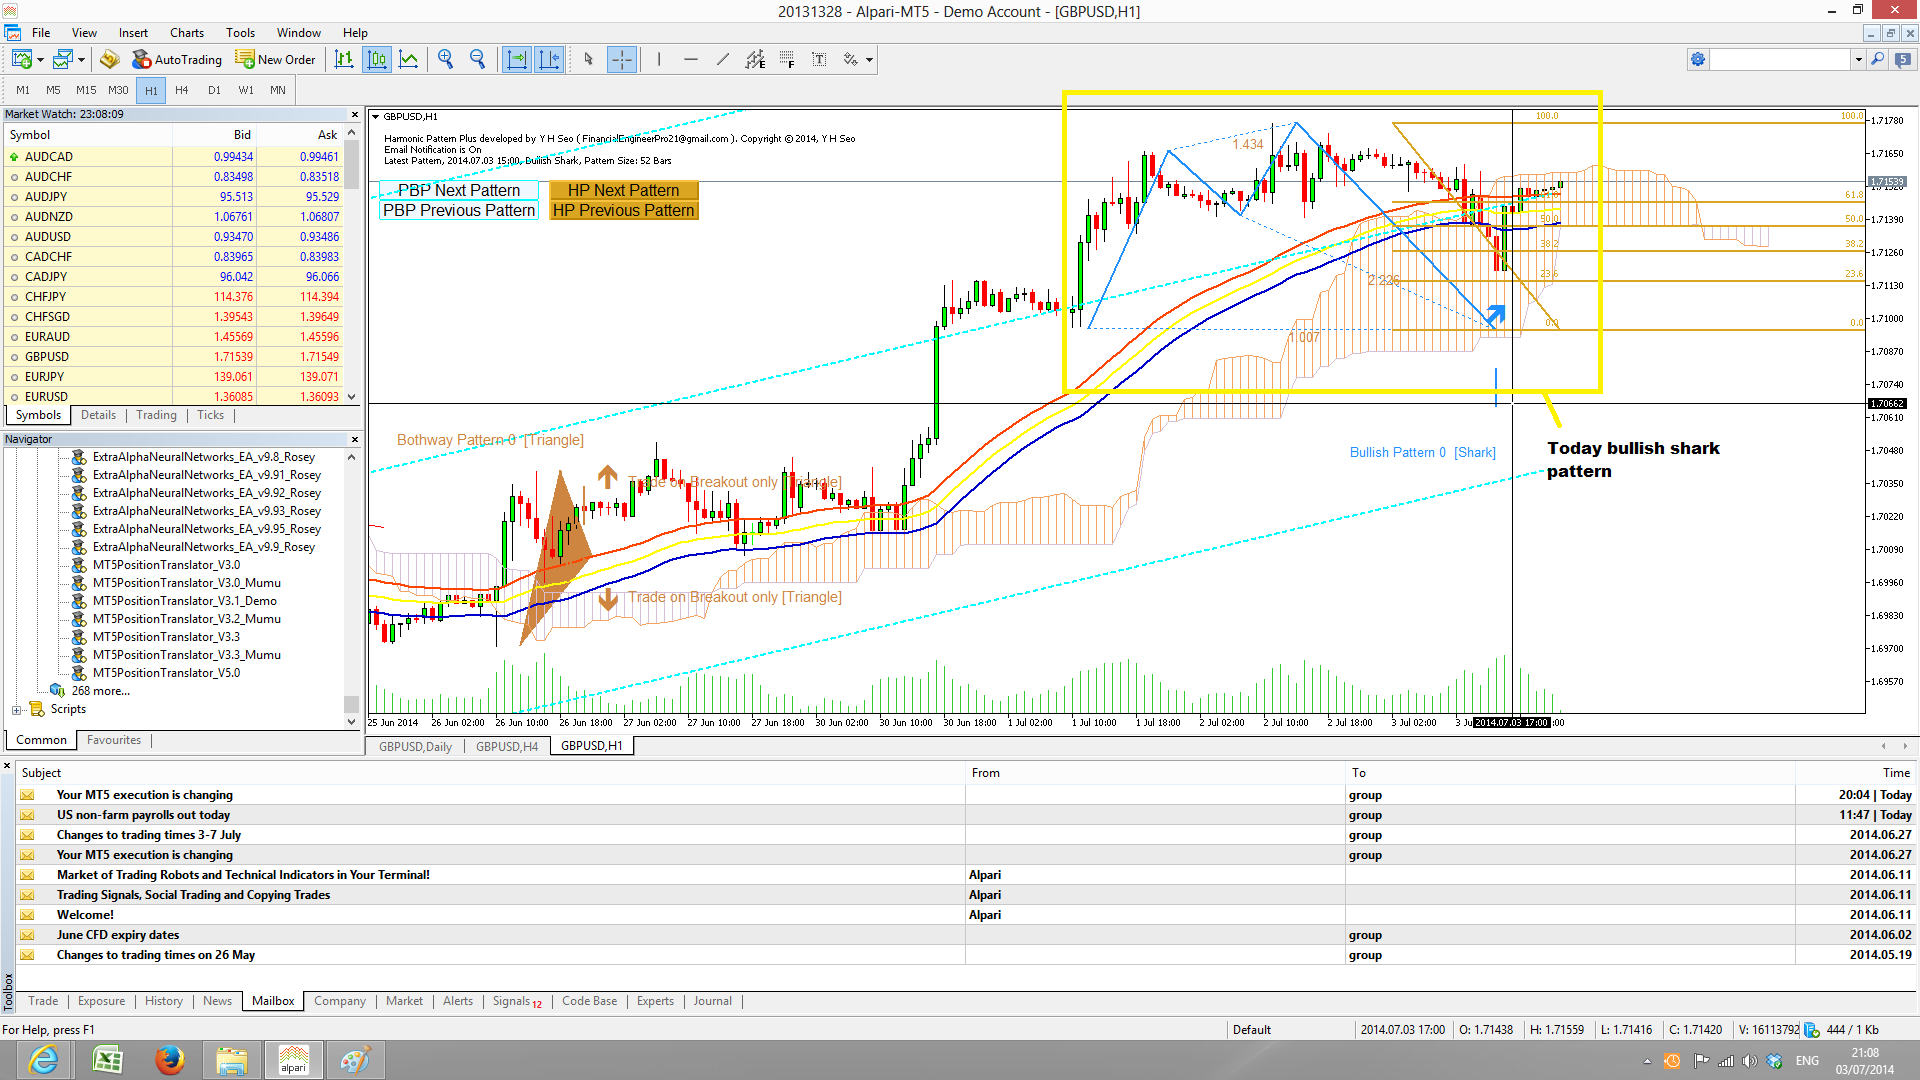
Th most notable pattern I have is on H1 time frame.
I got large bullish shark pattern plus sideways movement box formed together.
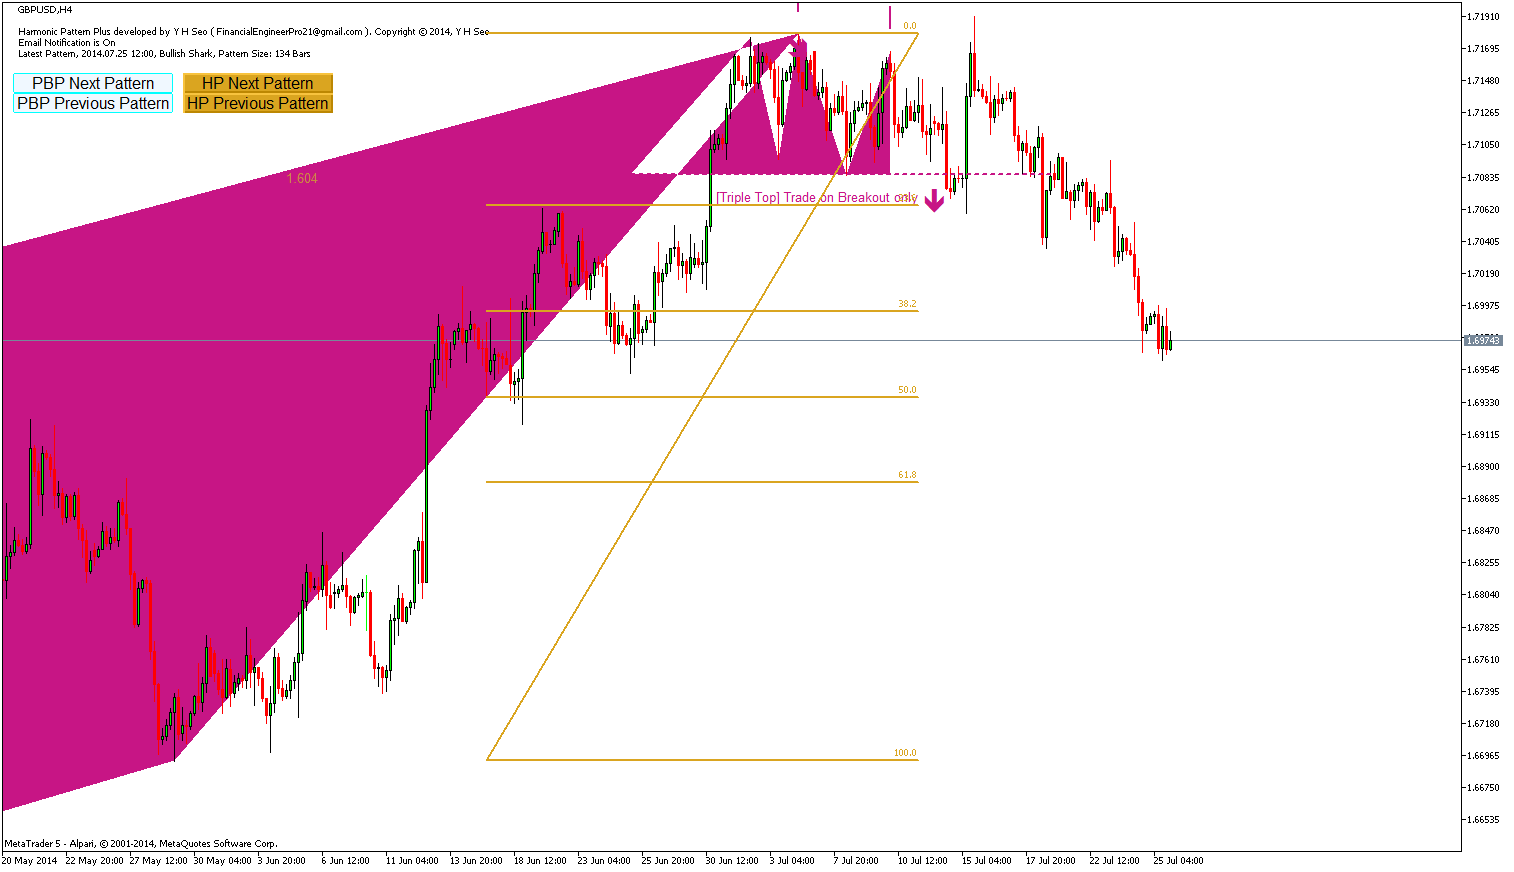
I will just repost it again for you. So my signal started with bearish ABCD pattern plus bearish triple top patterns.
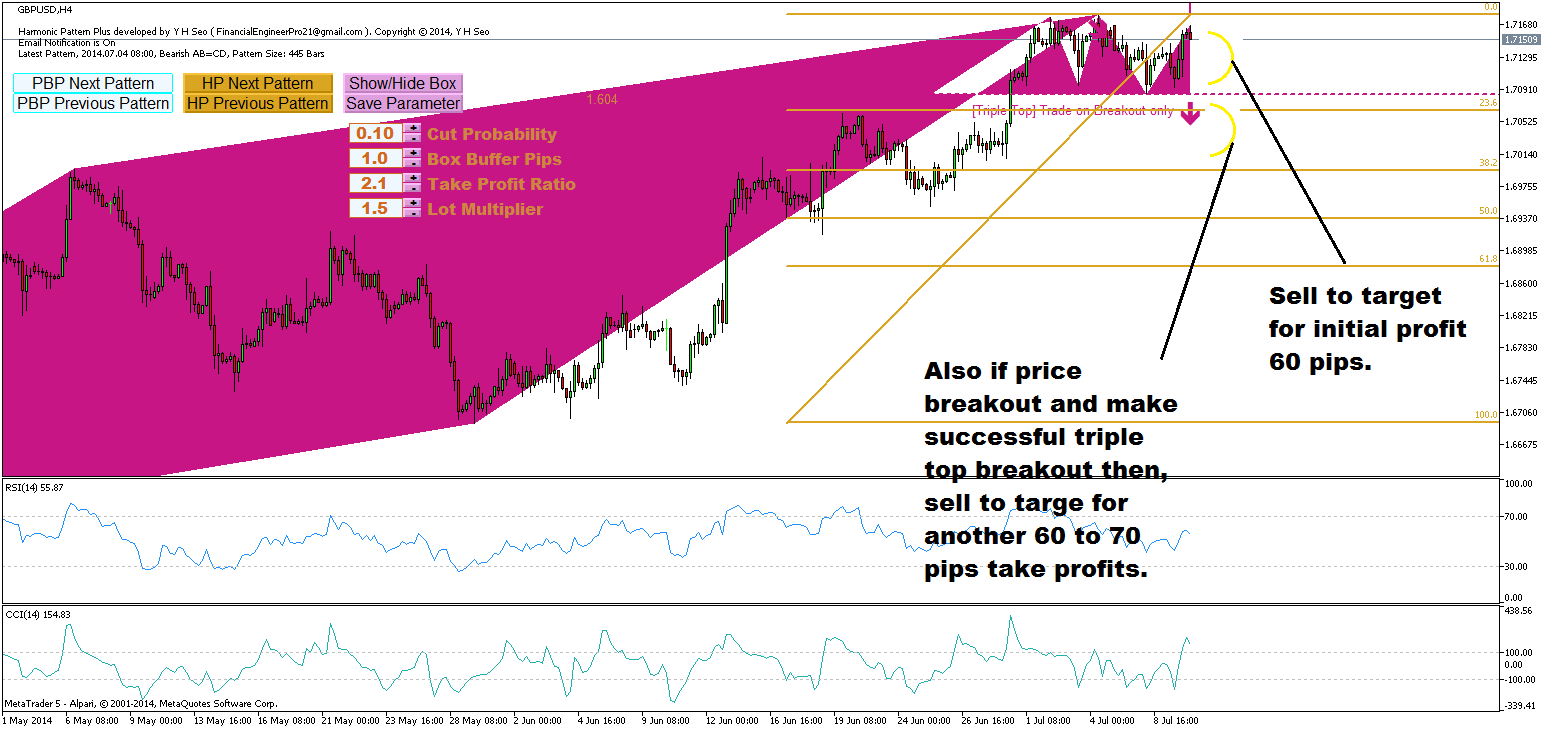
The unfinished EA only contains the rough pattern detection algorithm. It shows good potential but still the accuracy decrease with this rough algorithm.
The point is that I can't find out a way to reduce computation for the pattern detection algorithm. So for now, the work will be remain as in its experimental stage only.
If you still curious with the unfinished work of this scalping EA with the Price Breakout Pattern, you can visit this forum. The experimental EA is free for everyone.
http://www.forexfactory.com/showthread.php?t=496532
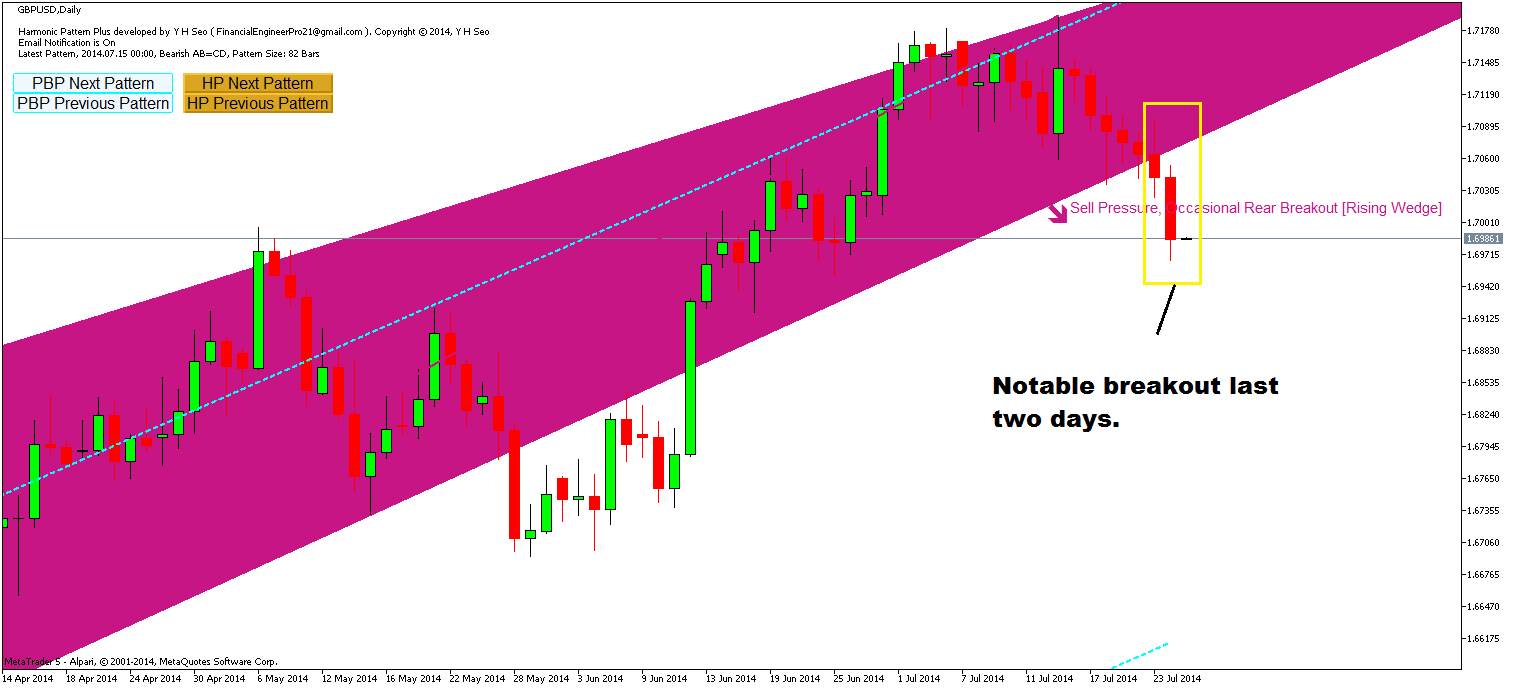
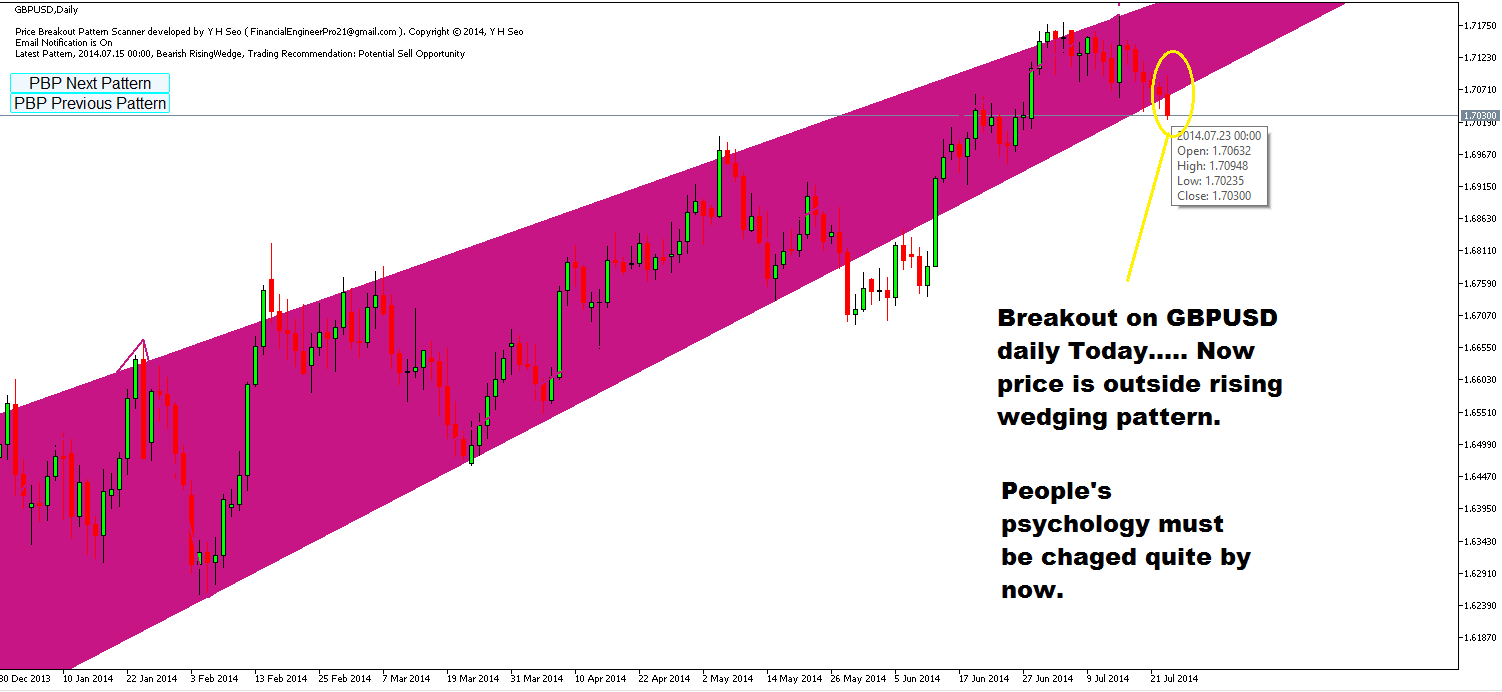
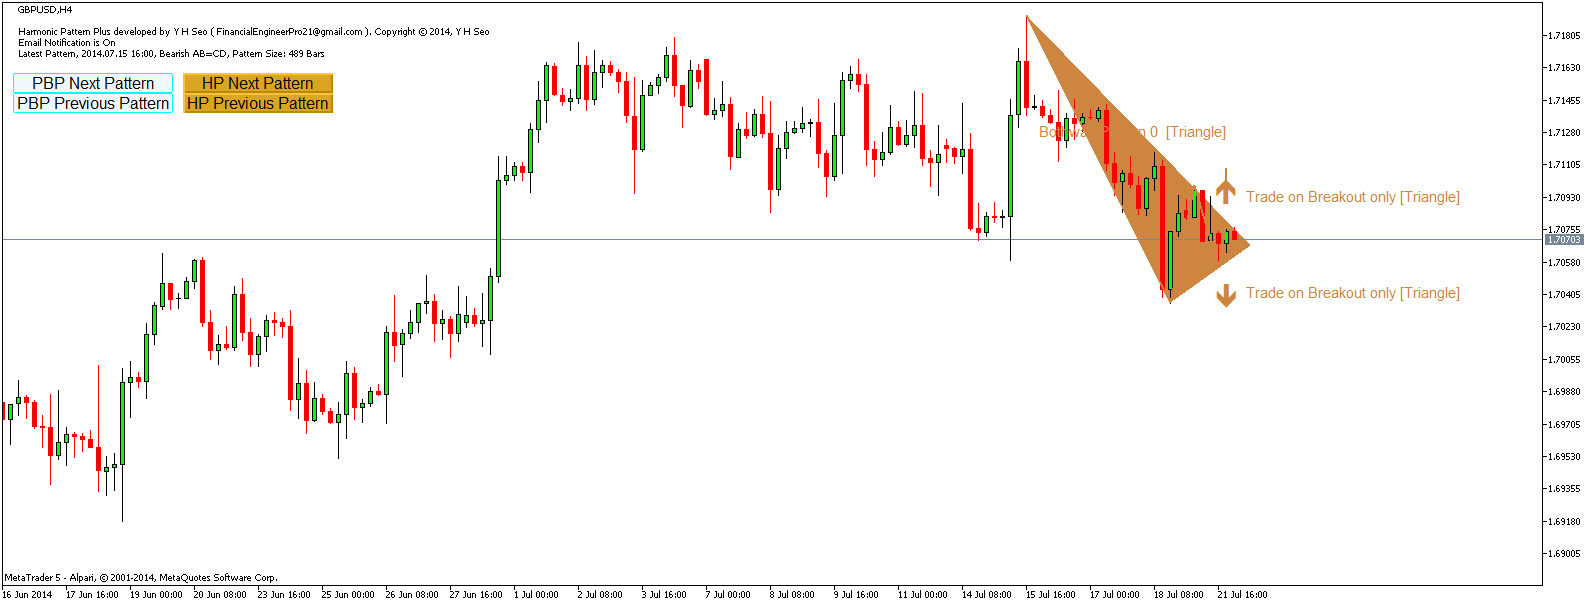
I also see H4 time frame triangle pattern. With many patterns indicating the same, This is probably time to watch out on your risk management side of business not to wipe out many weeks of your cumulative profits from sudden large movements.
Today we have Core CPI and Existing home sales. :) :) enjoy trading.
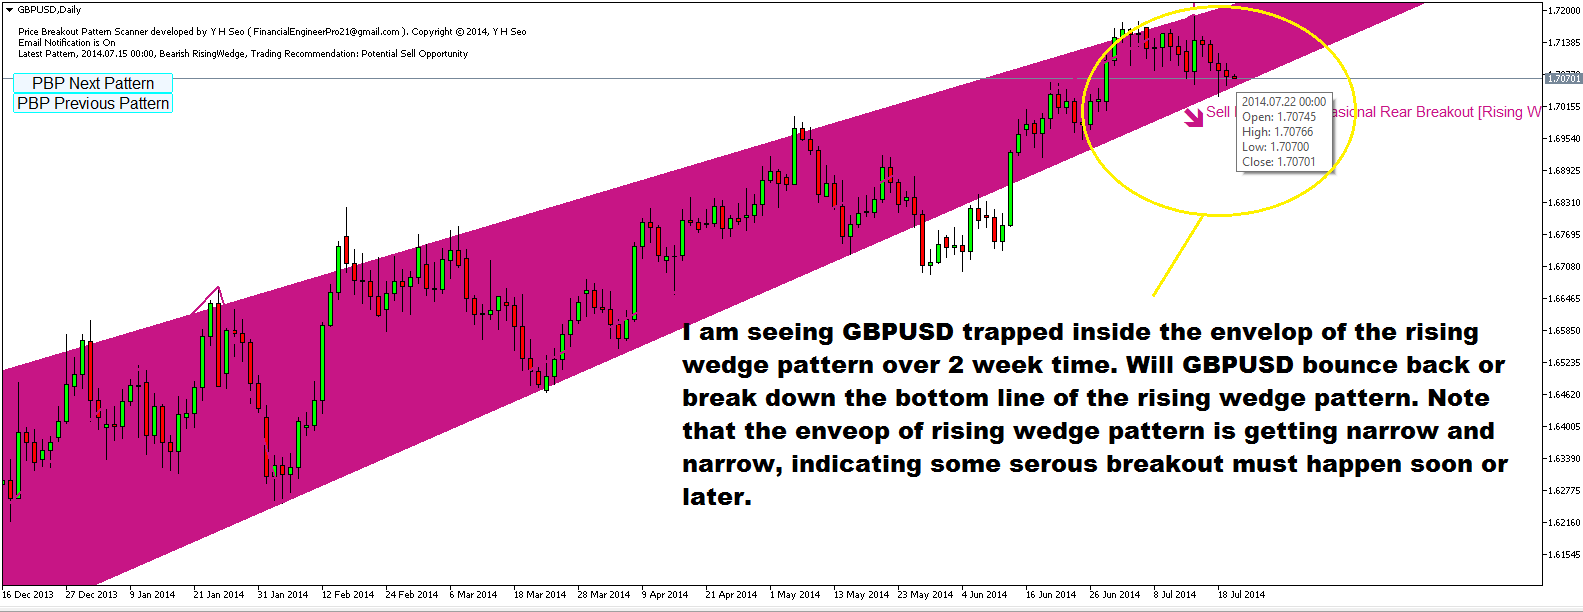
Today, we have couple of important GBPUSD data to be released including possible MPC rate statement. So use this analysis with together.


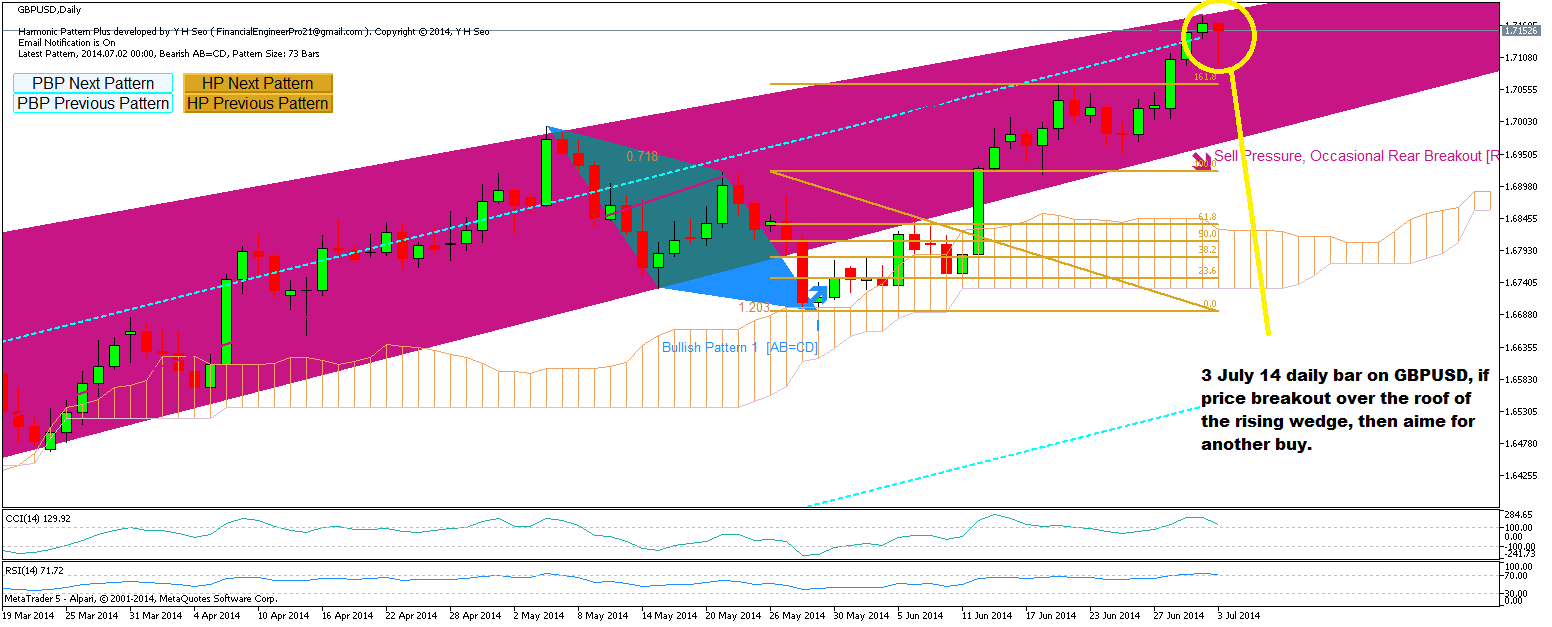
This might be acting as springboard to another bullish movement tomorrow. This is why I can't recommend you direct sell signal.
So I will say if price breakout the top roof of 1.71953, then we should aim another buy.
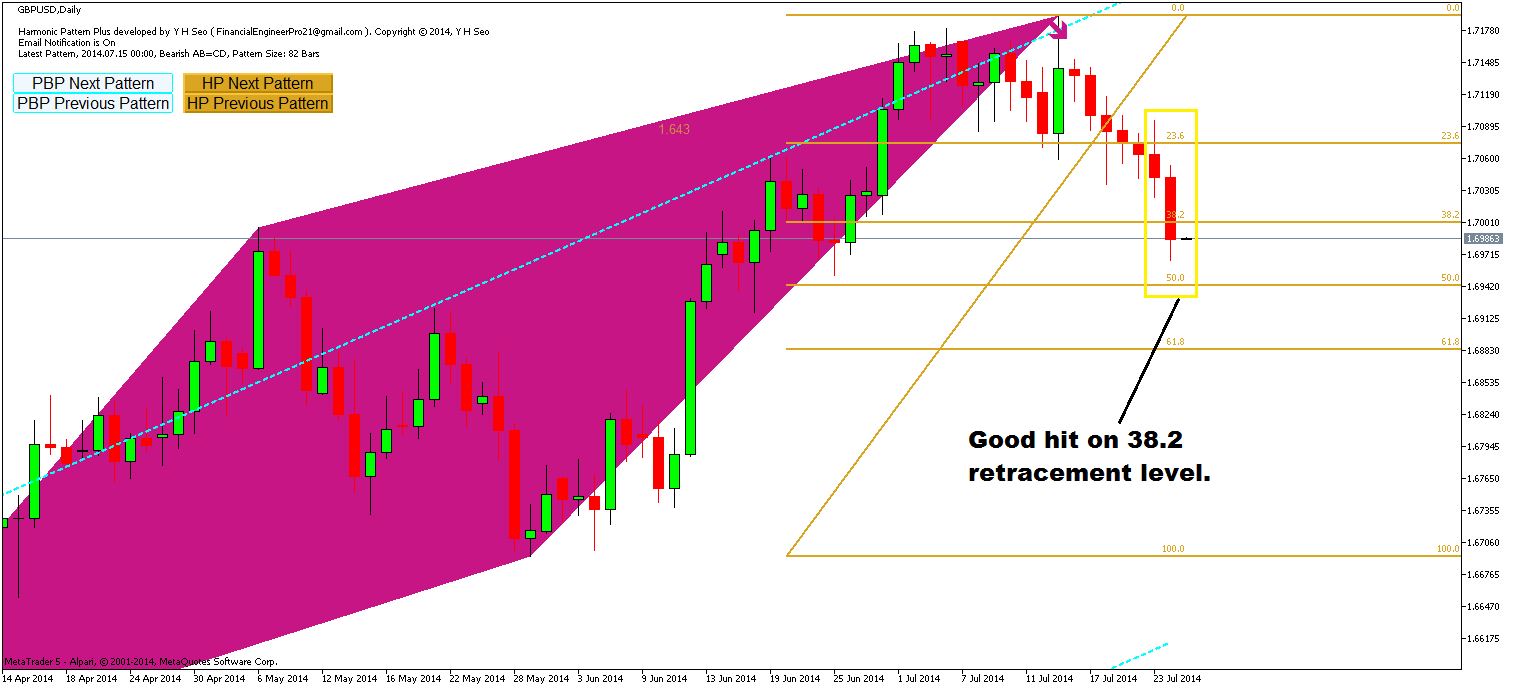
If the price breakout below 26.8 retracement level 1.70500 (second pics), then we should aim sell here.
However I will recommend to do nothing if the price stays inside this range.
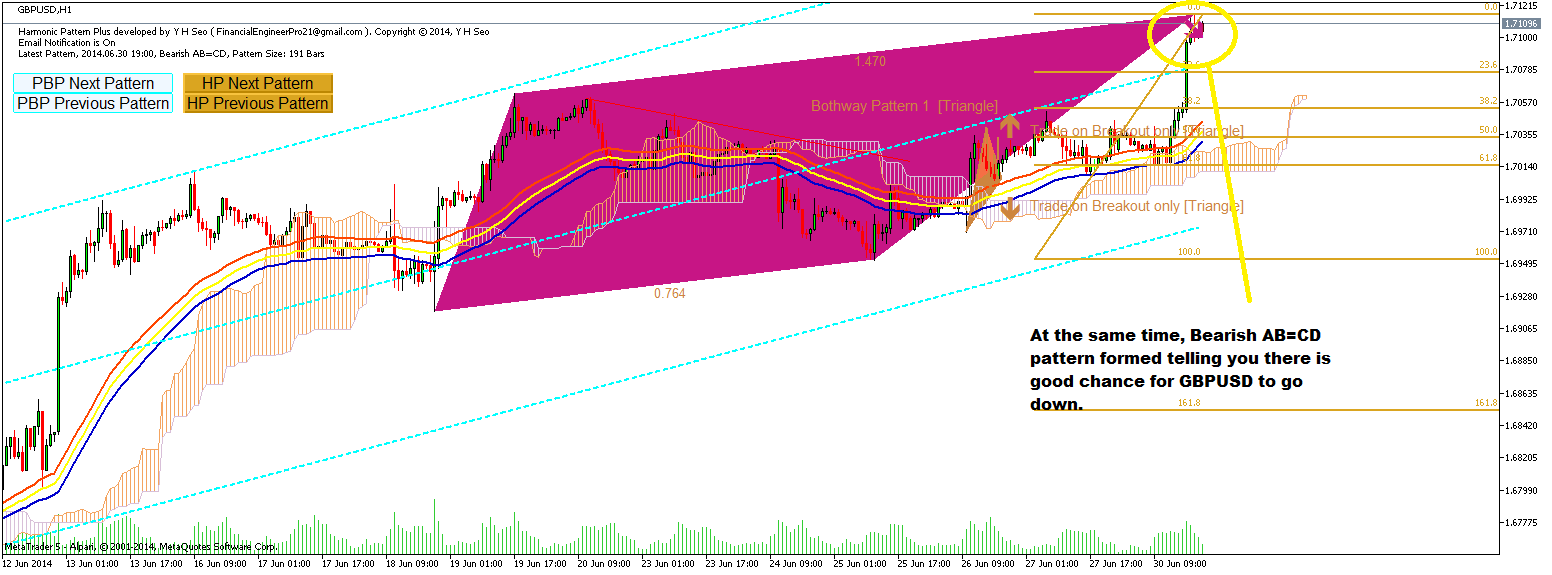
However, with current price very close to the top roof of the rising wedge pattern, I would not advise any sell position as breaking out through the roof can be another buy signal. Note that even if below 26.8 fibo level, there is sufficient profits zone for sell until bottom of rising wedge pattern. So don't rush for the decision now.
Therefore, you should only aim the sell, if the price hit 26.8 fibo level is breakdown.

Firstly, current GBPUSD is very close to the top roof of the rising wedge pattern.
If price breakout through the roof of the rising wedge pattern, then there can be another buy signal. This is really big and important pattern and price move will be significant.
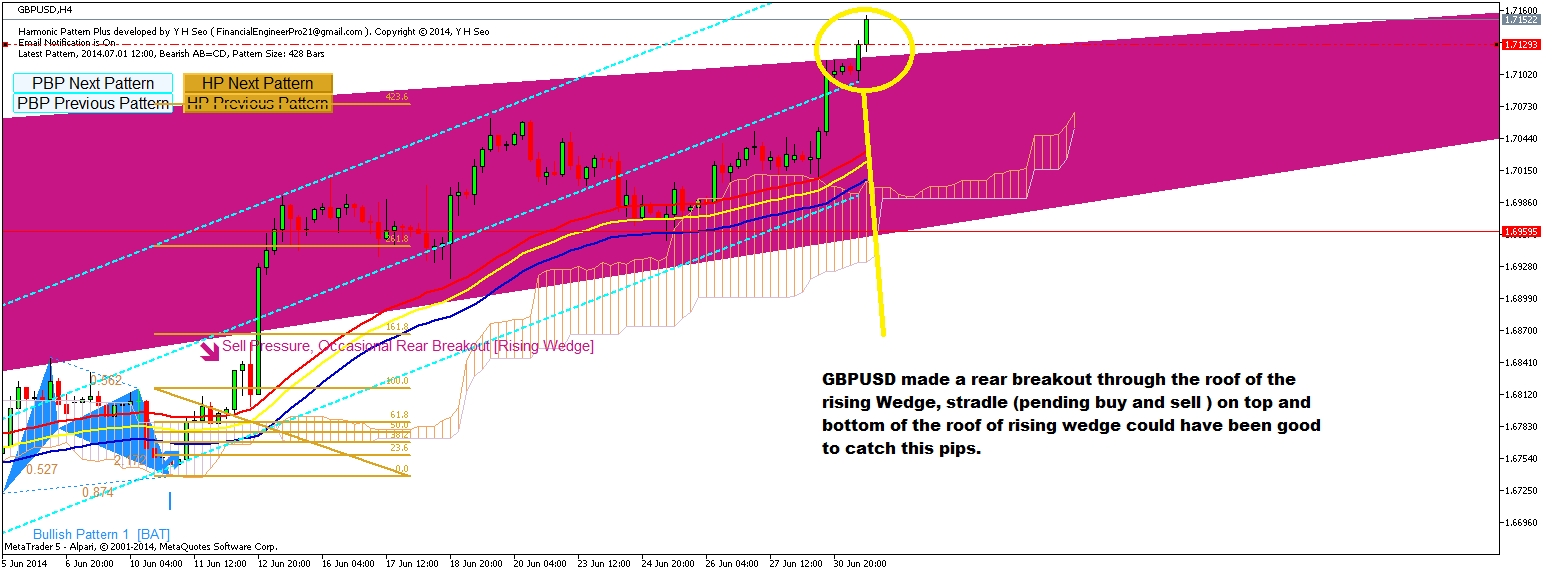
After Mark Carney (BOE) gave the market some clue on interest rate of GBP, we may be in the premature stage to expect bearish trend.
However still trade on price breakout does not need to know the market direction at all. Just follow the price action at that time. If they don't breakout, then don't trade and you have nothing to lose. :)

Price Breakout pattern Scanner is the automatic scanner for traders and investors. It can detect following patterns automatically from your chart. Head and Shoulder - Common tradable pattern. Reverse Head and Shoulder - This pattern is the reverse formation of the Head and Shoulder. Double Top - When the price hits resistance level twice and decline toward the support level, the trader can anticipate sudden bearish breakout through the support level. Double Bottom - The double bottom
Price Breakout pattern Scanner is the automatic scanner for traders and investors. It can detect following patterns automatically from your chart. Head and Shoulder - Common tradable pattern. Reverse Head and Shoulder - This pattern is the reverse formation of the Head and Shoulder. Double Top - When the price hits resistance level twice and decline toward the support level, the trader can anticipate sudden bearish breakout through the support level. Double Bottom - The double bottom
You were probably using wrong trading methods in the past and did not understand how to trade using harmonic patterns.
Ha Ha :) :)
Also if you want to combine harmonic pattern trading style and your own trading system, you could use harmonic Pattern Plus to do that.
Harmonic pattern is one of very few trading system you can trade with phase 1 of trend (if you don't understand phase 1, just read Birth of new Trend Triple entry trading system of my own).
You can combine with almost any trading system with harmonic pattern trading style.
Ha Ha :) :)
Harmonic pattern plus can help you to do this by providing you the back testing capabilities.
For example, one great idea is to combine harmonic pattern with Volume spread analysis (VSA) or Volume price analysis (VPA).
Harmonic pattern is based on pure price action and the some missing puzzles can be found by looking at VSA or VPA.
This is just one example. If you know which trend phase your trading system works, then you can always combine your trading system with harmonic pattern.
Then may the luck be with you in Forex market.
Plus there are some useful information I added latest related to harmonic pattern trading for traders.
I hope this is helpful.
http://harmonicpattern.ucoz.co.uk/
Kind regards.
