Young Ho Seo / Profilo
- Informazioni
|
10+ anni
esperienza
|
62
prodotti
|
1182
versioni demo
|
|
4
lavori
|
0
segnali
|
0
iscritti
|
https://www.mql5.com/en/market/product/4488
https://www.mql5.com/en/market/product/4475
https://algotrading-investment.com/portfolio-item/harmonic-pattern-plus/
Non Repainting and Non Lagging Harmonic Pattern Indicator – Customizable Harmonic + Japanese Candlestic Pattern Scanner + Advanced Channel + Many more
https://www.mql5.com/en/market/product/41993
https://www.mql5.com/en/market/product/41992
https://algotrading-investment.com/portfolio-item/profitable-pattern-scanner/
Supply Demand Indicator – Multiple Timeframe Scanning Added + Non Repainting + Professional Indicator
https://www.mql5.com/en/market/product/40076
https://www.mql5.com/en/market/product/40075
https://algotrading-investment.com/portfolio-item/ace-supply-demand-zone/
Momentum Indicator – Path to Volume Spread Analysis
https://www.mql5.com/en/market/product/30641
https://www.mql5.com/en/market/product/30621
https://algotrading-investment.com/portfolio-item/excessive-momentum-indicator/
Elliott Wave Indicator for the Power User
https://www.mql5.com/en/market/product/16479
https://www.mql5.com/en/market/product/16472
https://algotrading-investment.com/portfolio-item/elliott-wave-trend/
Forex Prediction - Turn Support and Resistance to the Advanced Strategy
https://www.mql5.com/en/market/product/49170
https://www.mql5.com/en/market/product/49169
https://algotrading-investment.com/portfolio-item/fractal-pattern-scanner/
MetaTrader 4 and MetaTrader 5 Product Page: https://www.mql5.com/en/users/financeengineer/seller#products
Free Forex Prediction with Fibonacci Analysis: https://algotrading-investment.com/2020/10/23/forex-prediction-with-fibonacci-analysis/
Free Harmonic Pattern Signal: https://algotrading-investment.com/2020/12/17/harmonic-pattern-signal-for-forex-market/
============================================================================================================================
Here are the trading education books. We recommend reading these books if you are a trader or investor in Forex and Stock market. In the list below, we put the easy to read book on top. Try to read the easy to read book first and try to read the harder book later to improve your trading and investment.
First Link = amazon.com, Second Link = Google Play Books, Third Link = algotrading-investment.com, Fourth Link = Google Books
Technical Analysis in Forex and Stock Market (Supply Demand Analysis and Support Resistance)
https://www.amazon.com/dp/B09L55ZK4Z
https://play.google.com/store/books/details?id=pHlMEAAAQBAJ
https://algotrading-investment.com/portfolio-item/technical-analysis-in-forex-and-stock-market/
https://books.google.co.kr/books/about?id=pHlMEAAAQBAJ
Science Of Support, Resistance, Fibonacci Analysis, Harmonic Pattern, Elliott Wave and X3 Chart Pattern (In Forex and Stock Market Trading)
https://www.amazon.com/dp/B0993WZGZD
https://play.google.com/store/books/details?id=MME3EAAAQBAJ
https://algotrading-investment.com/portfolio-item/science-of-support-resistance-fibonacci-analysis-harmonic-pattern/
https://books.google.co.kr/books/about?id=MME3EAAAQBAJ
Profitable Chart Patterns in Forex and Stock Market (Fibonacci Analysis, Harmonic Pattern, Elliott Wave, and X3 Chart Pattern)
https://www.amazon.com/dp/B0B2KZH87K
https://play.google.com/store/books/details?id=7KrQDwAAQBAJ
https://algotrading-investment.com/portfolio-item/profitable-chart-patterns-in-forex-and-stock-market/
https://books.google.com/books/about?id=7KrQDwAAQBAJ
Guide to Precision Harmonic Pattern Trading (Mastering Turning Point Strategy for Financial Trading)
https://www.amazon.com/dp/B01MRI5LY6
https://play.google.com/store/books/details?id=8SbMDwAAQBAJ
http://algotrading-investment.com/portfolio-item/guide-precision-harmonic-pattern-trading/
https://books.google.com/books/about?id=8SbMDwAAQBAJ
Scientific Guide to Price Action and Pattern Trading (Wisdom of Trend, Cycle, and Fractal Wave)
https://www.amazon.com/dp/B073T3ZMBR
https://play.google.com/store/books/details?id=5prUDwAAQBAJ
https://algotrading-investment.com/portfolio-item/scientific-guide-to-price-action-and-pattern-trading/
https://books.google.com/books/about?id=5prUDwAAQBAJ
Predicting Forex and Stock Market with Fractal Pattern: Science of Price and Time
https://www.amazon.com/dp/B086YKM8BW
https://play.google.com/store/books/details?id=VJjiDwAAQBAJ
https://algotrading-investment.com/portfolio-item/predicting-forex-and-stock-market-with-fractal-pattern/
https://books.google.com/books/about?id=VJjiDwAAQBAJ
Trading Education Book 1 in Korean (Apple, Google Play Book, Google Book, Scribd, Kobo)
https://books.apple.com/us/book/id1565534211
https://play.google.com/store/books/details?id=HTgqEAAAQBAJ
https://books.google.co.kr/books/about?id=HTgqEAAAQBAJ
https://www.scribd.com/book/505583892
https://www.kobo.com/ww/en/ebook/8J-Eg58EDzKwlpUmADdp2g
Trading Education Book 2 in Korean (Apple, Google Play Book, Google Book, Scribd, Kobo)
https://books.apple.com/us/book/id1597112108
https://play.google.com/store/books/details?id=shRQEAAAQBAJ
https://books.google.co.kr/books/about?id=shRQEAAAQBAJ
https://www.scribd.com/book/542068528
https://www.kobo.com/ww/en/ebook/X8SmJdYCtDasOfQ1LQpCtg
About Young Ho Seo
Young Ho Seo is an Engineer, Financial Trader, and Quantitative Developer, working on Trading Science and Investment Engineering since 2011. He is the creator of many technical indicators, price patterns and trading strategies used in the financial market. He is also teaching the trading practice on how to use the Supply Demand Analysis, Support, Resistance, Trend line, Fibonacci Analysis, Harmonic Pattern, Elliott Wave Theory, Chart Patterns, and Probability for Forex and Stock Market. His works include developing scientific trading principle and mathematical algorithm in the work of Benjamin Graham, Everette S. Gardner, Benoit Mandelbrot, Ralph Nelson Elliott, Harold M. Gartley, Richard Shabacker, William Delbert Gann, Richard Wyckoff and Richard Dennis. You can find his dedicated works on www.algotrading-investment.com . His life mission is to connect financial traders and scientific community for better understanding of this world and crowd behaviour in the financial market. He wrote many books and articles, which are helpful for understanding the technology and application behind technical analysis, statistics, time series forecasting, fractal science, econometrics, and artificial intelligence in the financial market.
If you are interested in our software and training, just visit our main website: www.algotrading-investment.com
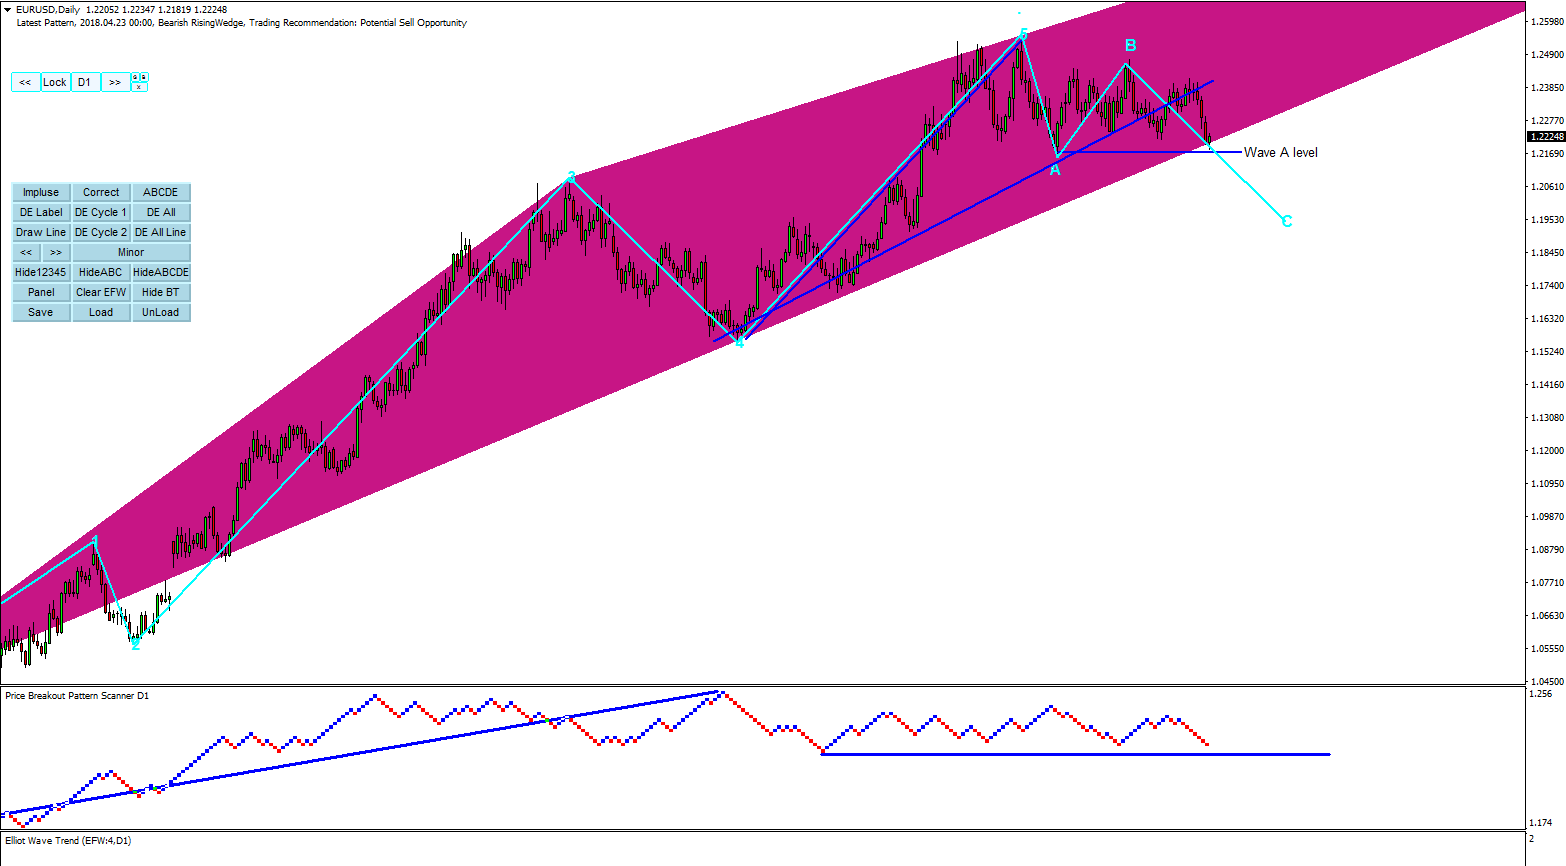
EURUSD realized the bearish correction up to Wave A level. So since our last post, EURUSD made around 100 pips down. If the correction stop here, then it is flat correction. If the correction can go down further below Wave A level, then it is the deep correction. So far, EURUSD is making some bullish reaction after the 230 pips down since 18 April.
If you have an interested in Elliott Wave trading, wedge pattern might be part of Elliott Wave .12345 strucure, therefore, check them before your trading.
If you are not interested in Elliott Wave trading, then trade according to the typical guide line of Price Action and Pattern Trading provided by us.
http://algotrading-investment.com/
https://www.mql5.com/en/users/financeengineer/seller#products
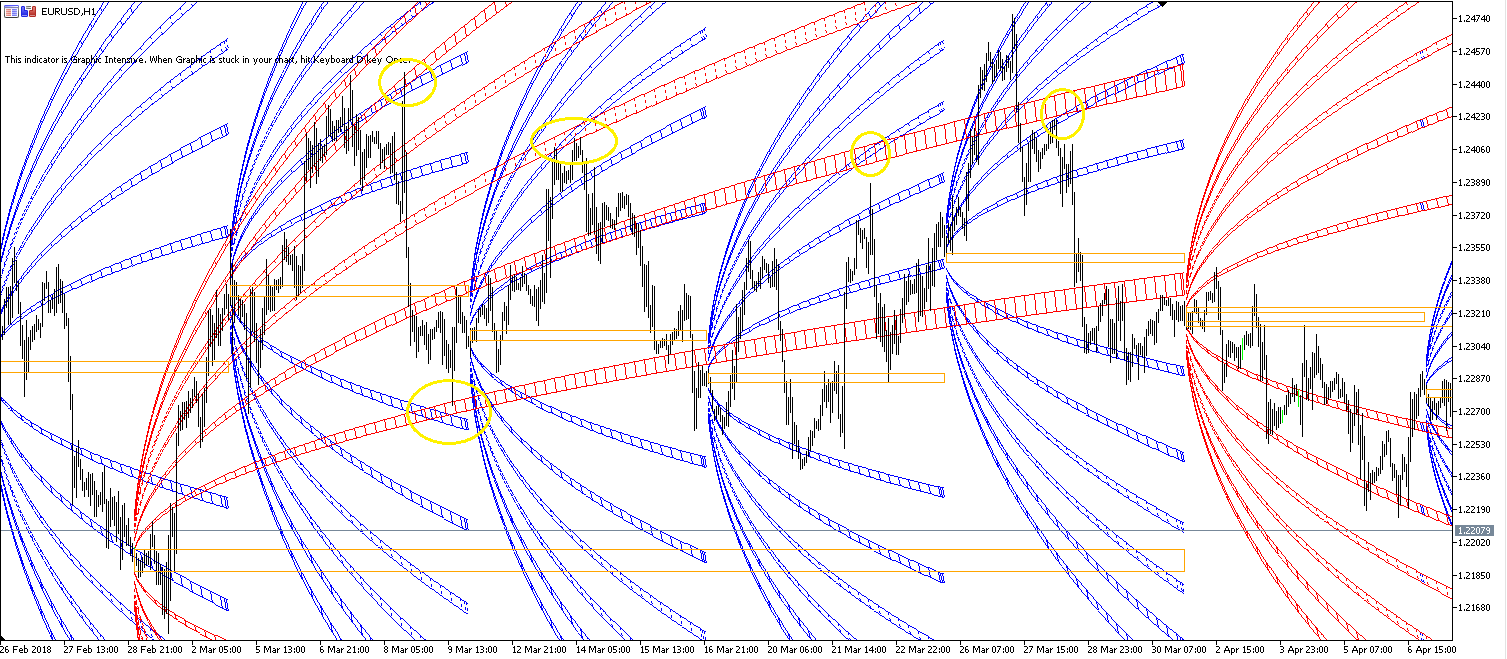
Introduction to Harmonic Volatility Indicator Harmonic Volatility Indicator is the first technical analysis applying the Fibonacci analysis to the financial volatility. Harmonic volatility indicator is another level of price action trading tool, which combines robust Fibonacci ratios (0.618, 0.382, etc.) with volatility. Originally, Harmonic Volatility Indicator was developed to overcome the limitation and the weakness of Gann’s Angle, also known as Gann’s Fan. We have demonstrated that Harmonic
Introduction to Harmonic Volatility Indicator Harmonic Volatility Indicator is the first technical analysis applying the Fibonacci analysis to the financial volatility. Harmonic volatility indicator is another level of price action trading tool, which combines robust Fibonacci ratios (0.618, 0.382, etc.) with volatility. Originally, Harmonic Volatility Indicator was developed to overcome the limitation and the weakness of Gann’s Angle, also known as Gann’s Fan. We have demonstrated that Harmonic
You can setup both weekly and monthly using Harmonic Volatlity Indicator. In this case, you can use rather smaller margin for the trading zone. The whole purpose is to find the intersaction between weekly and monthly lines. For this reason, you do not need thick trading zone. The idea behind is similar to Gann's angle. When few angles are interacts together, they often serves as the great turning point area. Check the sample screenshots.
From my experience, when two angles are forming the clear sissor shape, they tend to act as a really good turning point.
You can also use Harmonic Volatility Indicator to confirm your Harmonic Pattern. It is probably one of those highly synconized one for harmonic pattern.
http://algotrading-investment.com/
https://www.mql5.com/en/users/financeengineer/seller#products
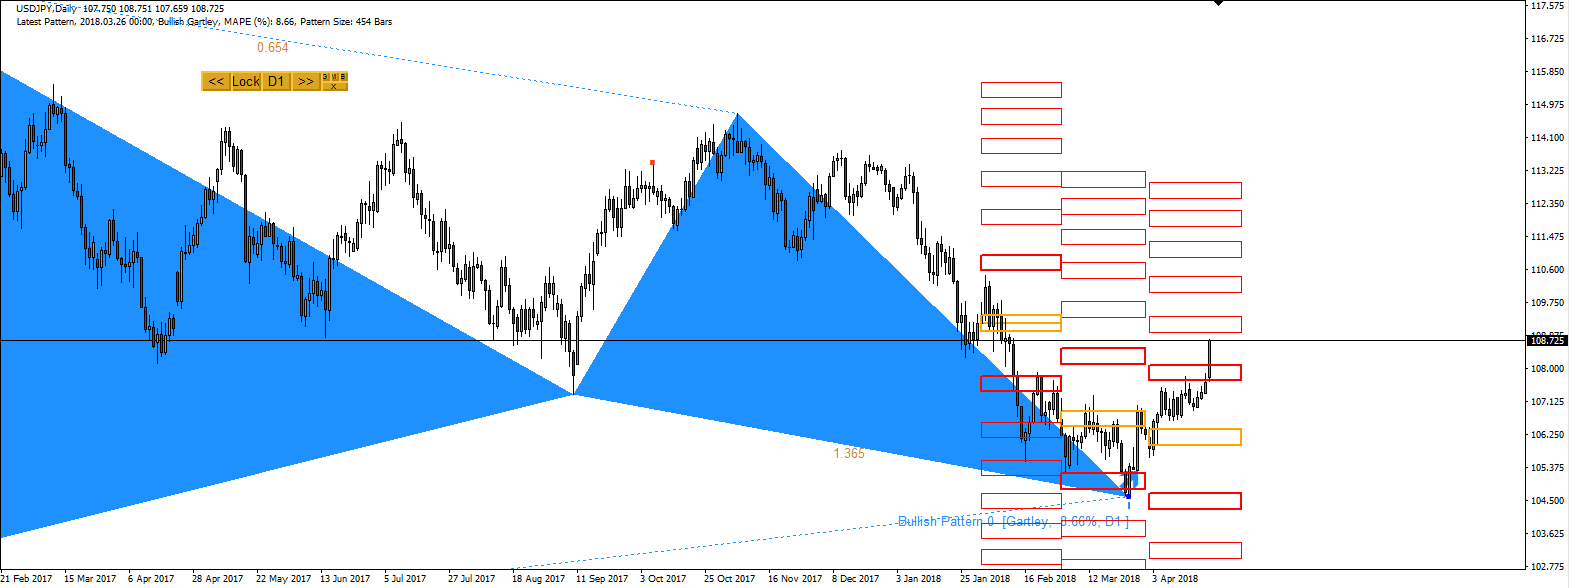
New York session is nearly end now. USDJPY was one of those bullish pair today. It nealy rose 100 pips today continuing the bullish reaction from the Gartley pattern. At the moment it is about to touch the 38.2% volaltity zone. So be noticed in advance.
http://algotrading-investment.com/
https://www.mql5.com/en/users/financeengineer/seller#products
During weekend, we predicted the potential movement on EURUSD. So far, EURUSD followed the corrective path for around 50 pips today. Here is the late post you may refer to.
http://tradeinvestsmart.com/2018/04/eurusd-market-outlook-21-april-2018/
Having said that there is no bullet proof trading system but they are subjective to probablity.
Here is the link to our website:
http://algotrading-investment.com
https://www.mql5.com/en/users/financeengineer/seller#products
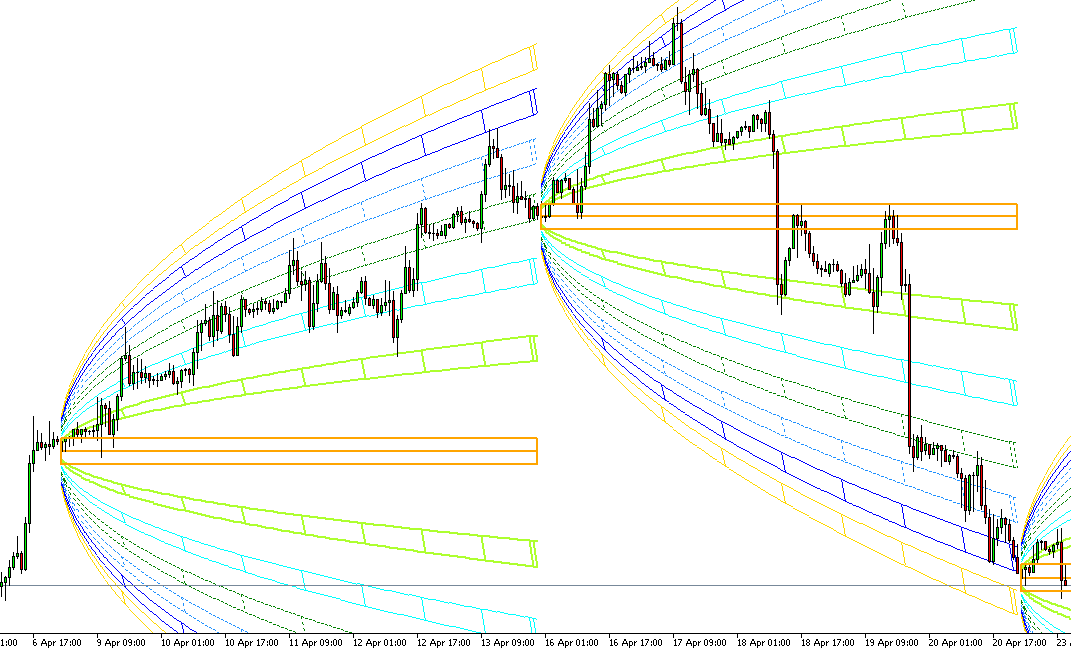
We have released Harmonic Volatility Indicator for your information. Some people asks the difference between Harmonic Volatilty Indicator and double Harmonic Volatltity Indicator.
For starters, we recommend Harmonic Volatlity Indicator becuase it is easy to use and it comes with trading zone displays.
For advanced users, you can use both Harmonic Volatlity Indicator and double Harmonic Volatlity Indicator.
We hope you to meet this amazing brand new trading tool for your wining trading.
http://algotrading-investment.com/
https://www.mql5.com/en/users/financeengineer/seller#products
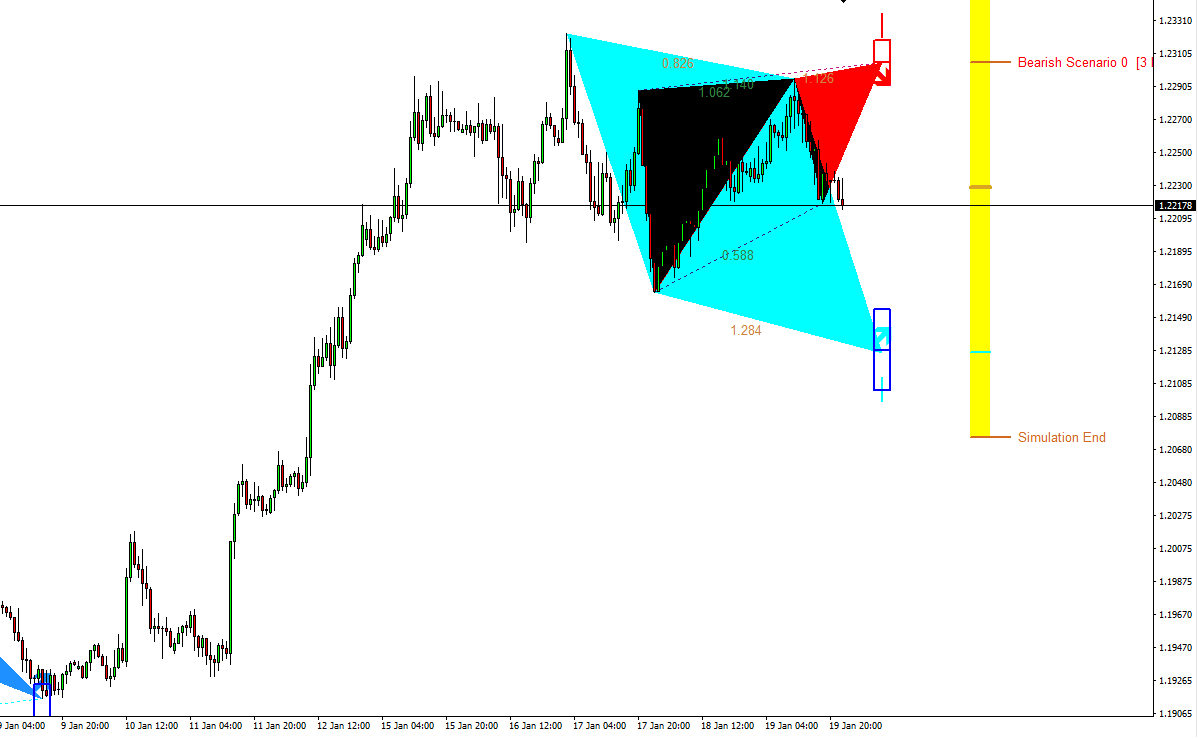
Harmonic Pattern Scenario Planner is a tool you can scan and search future harmonic patterns in just one button click. It would detect any potential future harmonic patterns in your search range. You can even get the potential take profit and stop loss of the future patterns even before they form. What is even more, you can use all the features and functionality of harmonic pattern plus from your harmonic pattern scenario planner too. Harmonic Pattern Scenario Planner is also compatible with our Harmonic Pattern Order EA.
Have watched this interesting movie called “Next” ? Check out the guy can see the few minutes into the futures. How powerful the 2 minutes vision for future is. Predicting future is very tactical game but it is hard because future keep changing based on the presents. However, it is definitely an interesting game. As a trader, you can gain a lot of advantege over other traders by predicting futures.
http://www.imdb.com/title/tt0435705/
We are only one selling the future predictive harmonic pattern scanner.
http://algotrading-investment.com/portfolio-item/harmonic-pattern-scenario-planner/
https://www.mql5.com/en/market/product/6101
https://www.mql5.com/en/market/product/6240
Especially if you like Price Action and Pattern Trading like Harmonic Pattern, Price Breakout pattern ,etc, then you can read this free articles.
http://tradeinvestsmart.com/2018/03/quick-guideline-for-harmonic-pattern-plus-for-starter
http://tradeinvestsmart.com/2017/12/pattern-completion-interval-versus-potential-reversal-zone
http://tradeinvestsmart.com/2018/03/how-elliott-wave-can-improve-your-trading-performance
http://tradeinvestsmart.com/2018/02/backtesting-potential-reversal-zone-with-harmonic-pattern-plus-with-harmonic-pattern-scenario-planner
http://tradeinvestsmart.com/2018/02/real-time-renko-smart-renko-and-price-breakout-pattern-scanner/
http://tradeinvestsmart.com/2017/10/tactical-use-of-pattern-completion-interval
http://tradeinvestsmart.com/2018/02/multiple-timeframe-pattern-analysis/
http://tradeinvestsmart.com/2017/11/next-generation-technical-indicator/
http://tradeinvestsmart.com/2018/02/introduction-to-peak-trough-analysis-for-your-trading/
Hitting 1.4376 initially shown some recovery sign for GBPUSD from its Brexit effect. However, GBPUSD did not hold firmly around 1.4376 making a sharp fall around 380 pips in few days last week. Technically speaking GBPUSD just hit the 9% Harmonic Volatility Zone. With the appearance of the Butterfly pattern, we might be able to guess some correction from 380 pips drop last week. First sign will be GBPUSD will move outside the 9% Harmonic Volatilty Zone towards 14.6% Zone. Will check with further progress of GBPUSD.
http://algotrading-investment.com/
https://www.mql5.com/en/users/financeengineer/seller#products
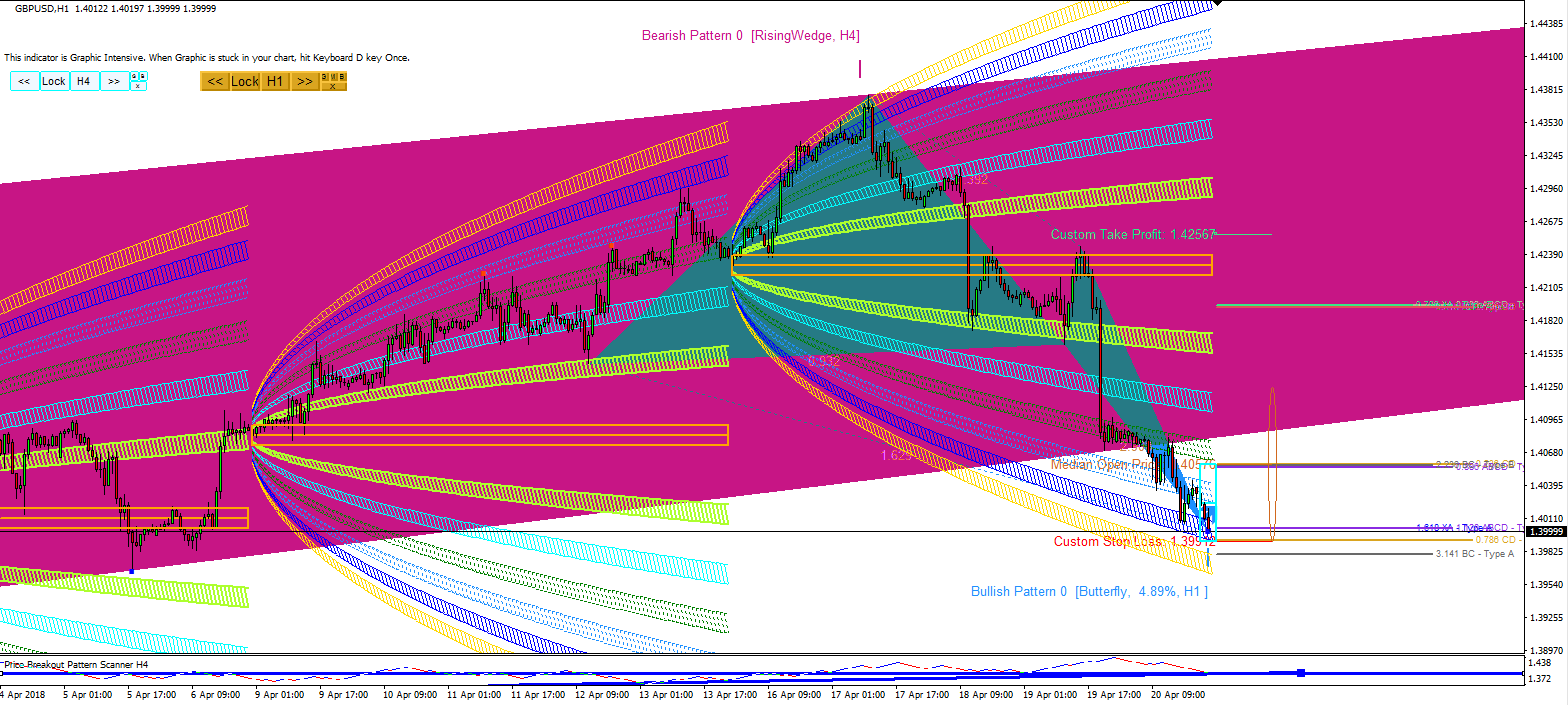
Harmonic Pattern Plus and Harmonic Volatilty Indicator can go really nice together. Here is the screenshot for your winning trading. Screenshot explain how to trade. So we do not even have to explain.
http://algotrading-investment.com/
https://www.mql5.com/en/users/financeengineer/seller#products
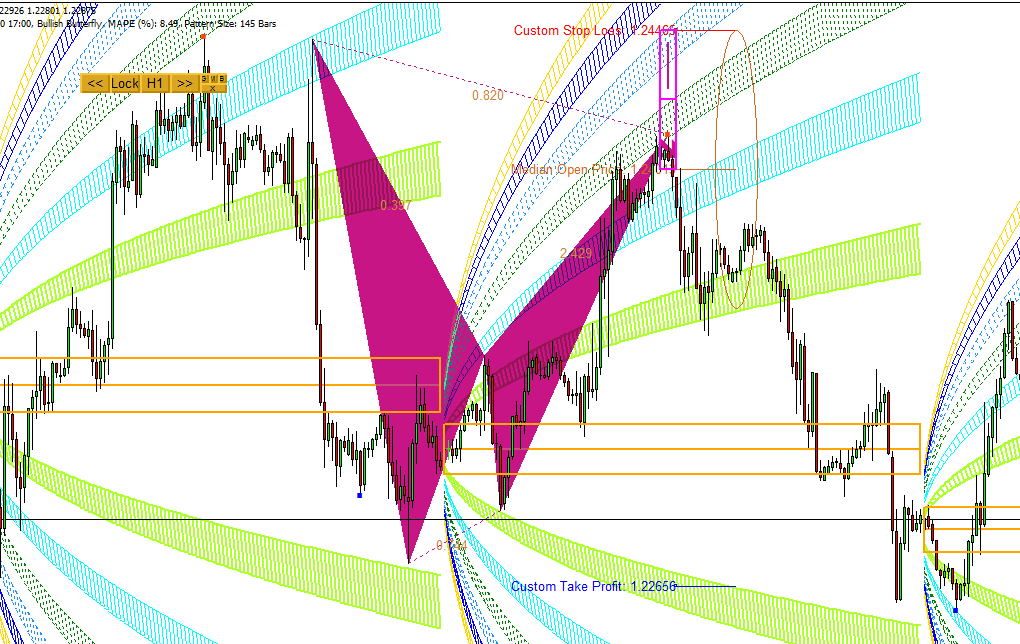
Harmonic Volatility Indicator will open new generation of trading technology. check this marvelous trading system, which you have ever dreamt of.
http://algotrading-investment.com/
https://www.mql5.com/en/users/financeengineer/seller#products
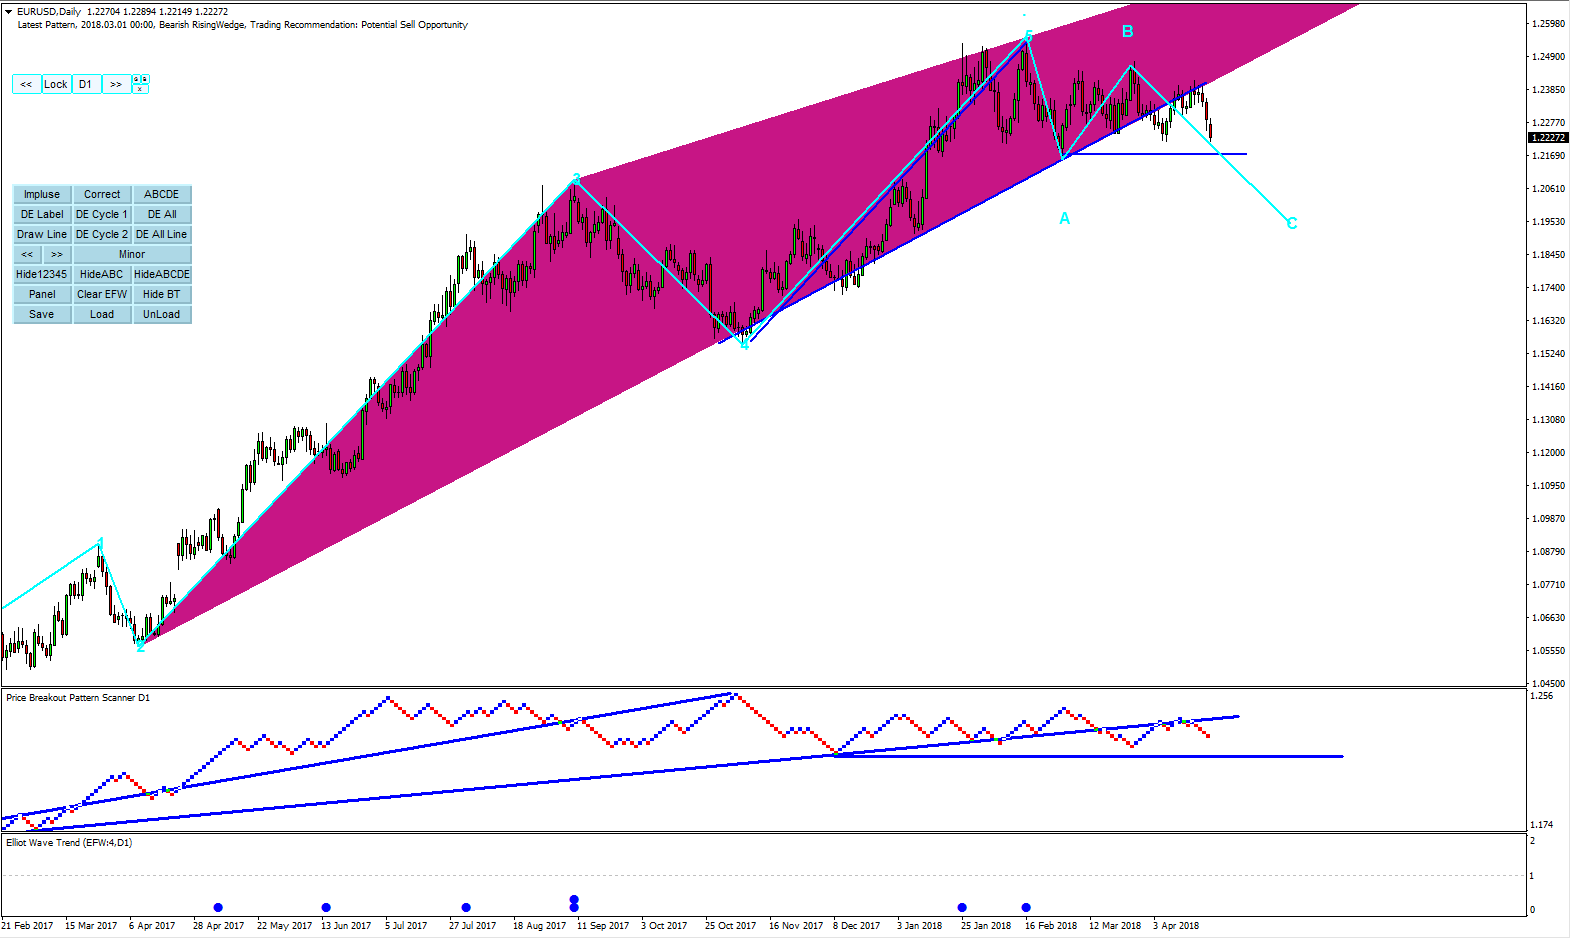
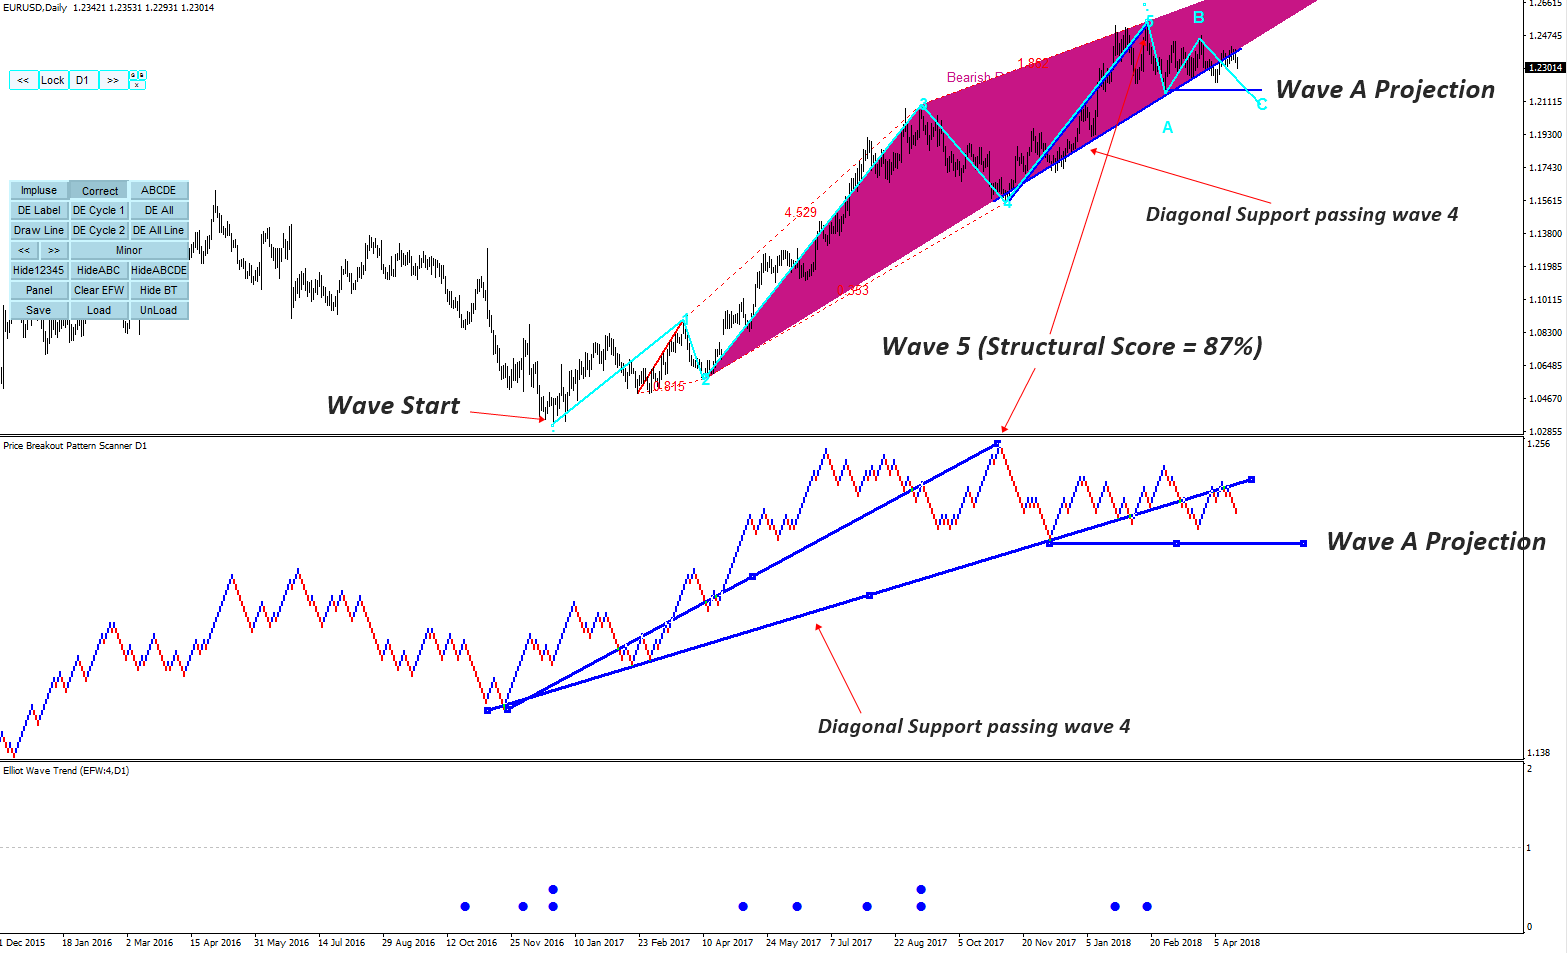
Ok. So here is some combination of analysis using Price Breakout pattern scanner and elliott wave trend. Firstly this analysis is subjective to probabilty becuase we start this analysis with 87% Structural Score of Wave .12345. It is marked in the Cyan. So you can spot them in the chart.
Before my analysis Price Breakout Pattern Scanner detected rising wedge automatically. Well, so it give me clue of Wave .12345. Since rising wedge can associate with wave .12345 often.
Given the 87.5% structure score, it seems EURUSD had a right reaction so far.
Of course, one correction will follow one impulse. So it is not difficult to guess that we could have the correction.
What matter for our trading is to look for where EURUSD can land in the future. This is probably the most difficult prediction but most useful predition.
To get some clue, we have extended the location of Wave A to the right. We are around 110 pip aways from this Wave A projection.
Remember that this analysis performed with 87.5% Structural Score. In the course of market progress, market can form better scenario since Market (or universe) love the most efficient way (or path). If they found an alternative path with more efficiency during the course, then they will follow such a path. For now, this is good guess for the given the information.
Use this information at your own risk.
=======================
Here are some technical tips. Diagonal support passing wave 4 was identifed in Renko chart first.
1.Draw the line in Smart Renko, then double click the line. It will be automatically copied to your main chart. Adjust the line in renko to aline them corrently in your main chart.
2.To get label for Wave .12345, click impulse button, then click blue circle in bottom window. It is automatic. Then click draw button to check Structural score.
3.To use price breakout pattern scanner + Elliott Wave Trend, apply price breakout pattern scanner first, then apply Elliott Wave Trend
Simply with our tools and trading system, you have an access to the most advanced trading technology at your finger tip. We do provide the technology which is only availbe in someone's secret research laborartoy. Visit our site:
http://algotrading-investment.com/
https://www.mql5.com/en/users/financeengineer/seller#products
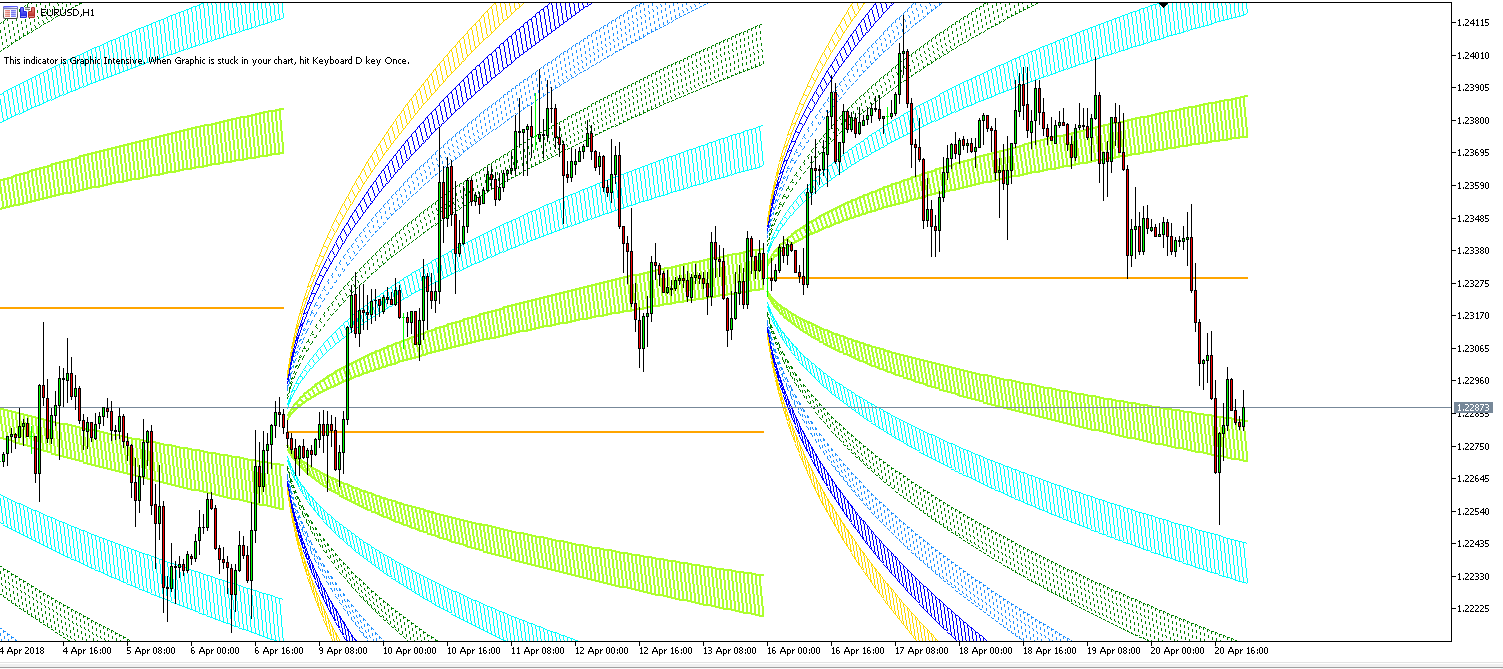
Finally we have relased Harmonic Volatiltiy Indicator. This indicator will provide you the key to sucesss. This indicator will provide another level of price action trading tool which acts on the financial volatilty. It is very rare tool to help you to trade on good volatlity moment.
http://algotrading-investment.com/portfolio-item/harmonic-volatility-indicator/
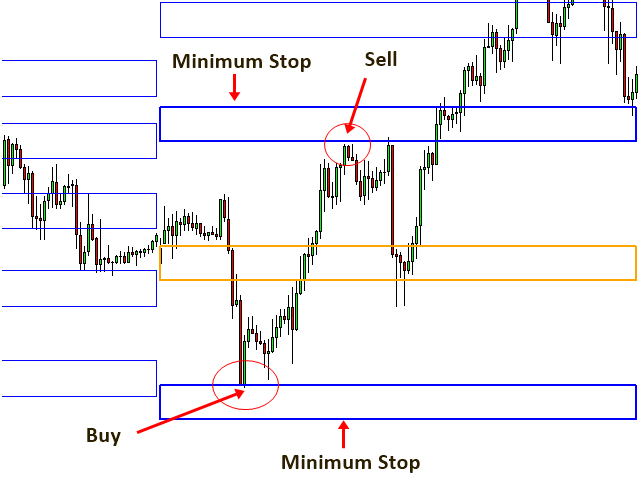
We have a notable effect on oil lately from the concering on the reduce supply. Brent oil price gone above 70 dollar already and WTI is around 70 dollar too. Syrian conflict add more effects on these concern too. Current market outlook of EURUSD look like the screenshot. EURUSD is deviting more from the bottom of rising wedge pattern (price braekout pattern scanner). Bearish AB=CD pattern is still in effective zone.
http://algotrading-investment.com/
https://www.mql5.com/en/users/financeengineer/seller#products

NAFTA deal is coming in three weeks time. There could be potential concern on this with dollar and CAD next few weeks. Technically, EURUSD made a fast fall as soon as they hit the wall of wedge pattern detected with price Breakout pattern scanner.
http://algotrading-investment.com/
https://www.mql5.com/en/users/financeengineer/seller#products
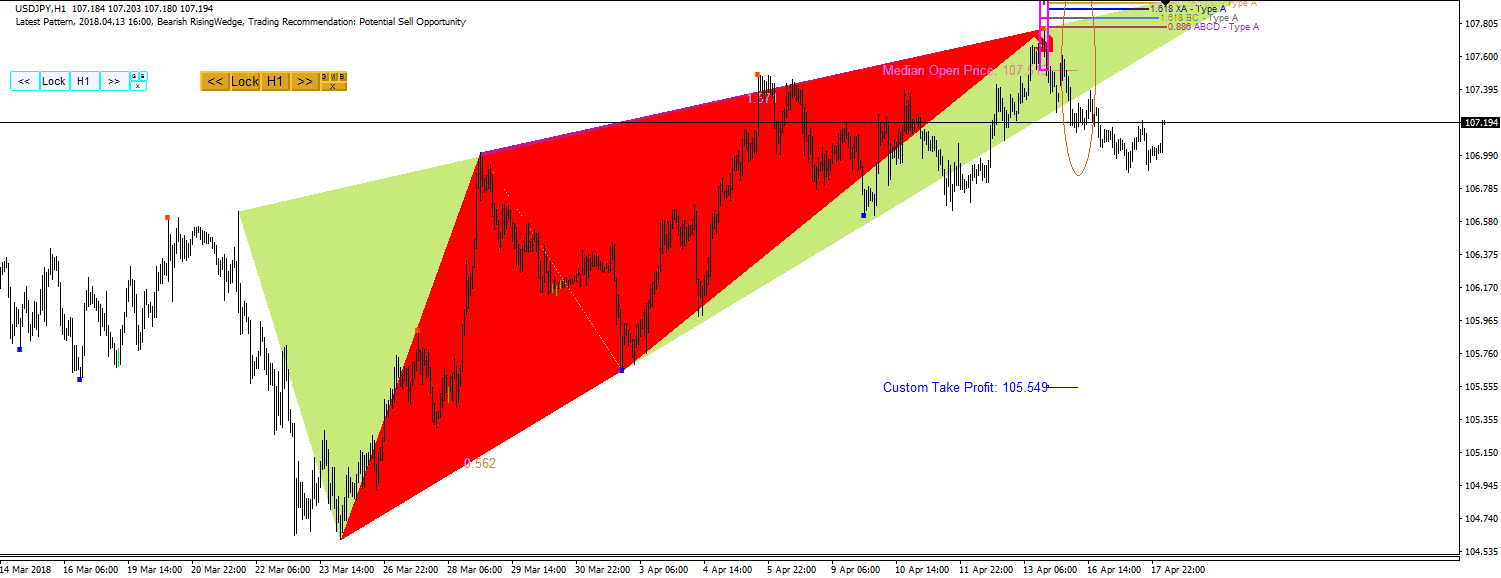
Asian sessin started few hours ago. Asian stock market started with bullish. It seems to be driven with US earning yesterday too. The most notable movemnt so far is that USD gain against JYP this morning (around 30 pips). Here is the screenshot of USDjPY.
http://algotrading-investment.com/
https://www.mql5.com/en/users/financeengineer/seller#products
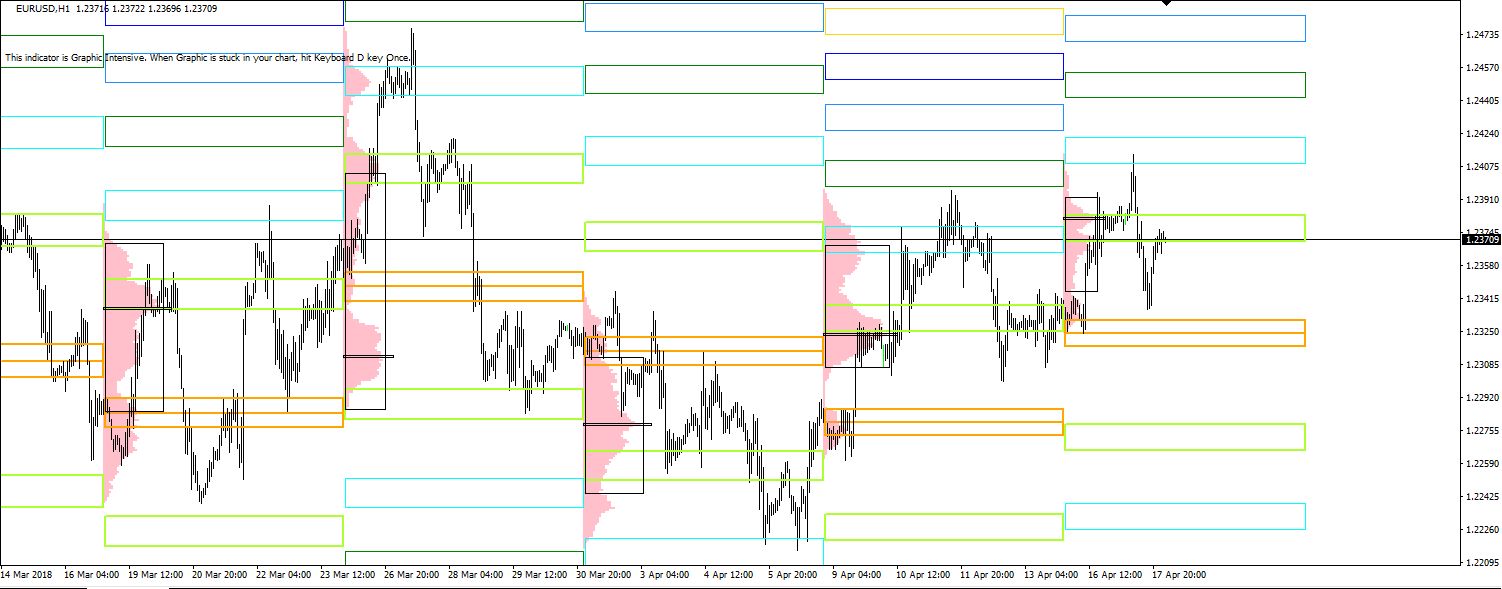
Here are the new screenshots of Harmonic Volaltity Indicator coming into the market.
Stable and consistent tradable pattern detector. You can match your market profile per session with harmonic volatility indicator for the extra performance.
http://algotrading-investment.com/
https://www.mql5.com/en/users/financeengineer/seller#products
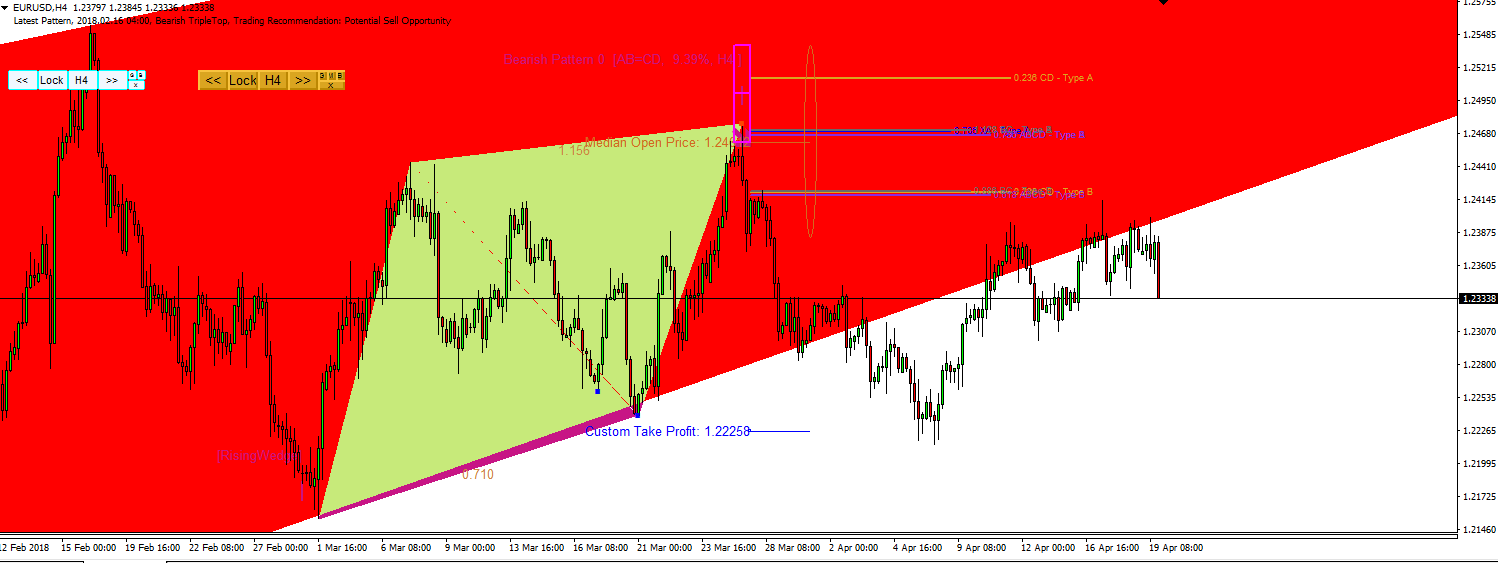
US Stock market started with bullish. That had a direct effect on EURUSD today pushing USD higher. The overall pattern looks like that EURUSD come out of the wedge pattern (Price Breakout Pattern Scanner) we were talking about few weeks now. Recent Fx market moved so much zig zag fashion overall.
http://algotrading-investment.com
https://www.mql5.com/en/users/financeengineer/seller#products

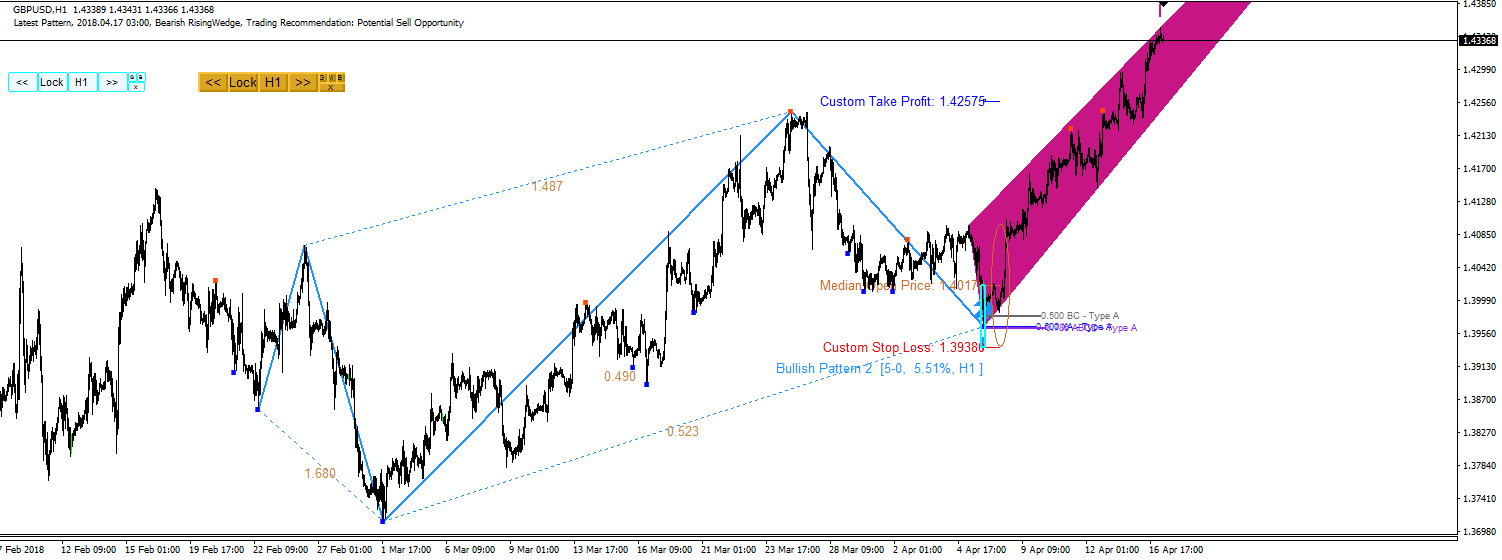
GBPUSD shows strong bullish against USD. As you can tell from the screenshot, GBPUSD builds sort of rising wedge pattern (price breakout pattern scanner) with such a momentum. The effect of bullish 5-0 pattern is most dominating at the moment. GBPUSD stays on the upside of this wedge pattern. Now the effect is showing equally strong on EURGBP and GBPJPY too.
We hope this analysis is useful for your trading.
http://algotrading-investment.com/
https://www.mql5.com/en/users/financeengineer/seller#products
