Daniel Damian Palasz / Venditore
Prodotti pubblicati

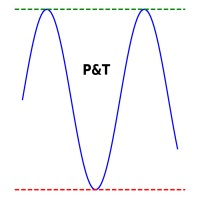
It is used to automatically detect and draw horizontal lines on a chart that represent price peaks and troughs based on analysis of historical price data.
The script allows the user to select the number of recent candles to analyze, the minimum gap between high and low, and the minimum number of candles needed to recognize a high or low. It is a useful tool for traders who want to automatically detect and visualize important support and resistance levels on a chart, making it easier to make i